The same plot in 14 other libraries — JavaScript: Chart.js, Apache ECharts, Highcharts, MUI X Charts; Python: Altair, Bokeh, lets-plot, Matplotlib, Plotly, plotnine, Pygal, Seaborn; R: ggplot2; Julia: Makie.jl. Compare all 15 side by side: Box Plot with Strip Overlay in Python, R, Julia and JavaScript.
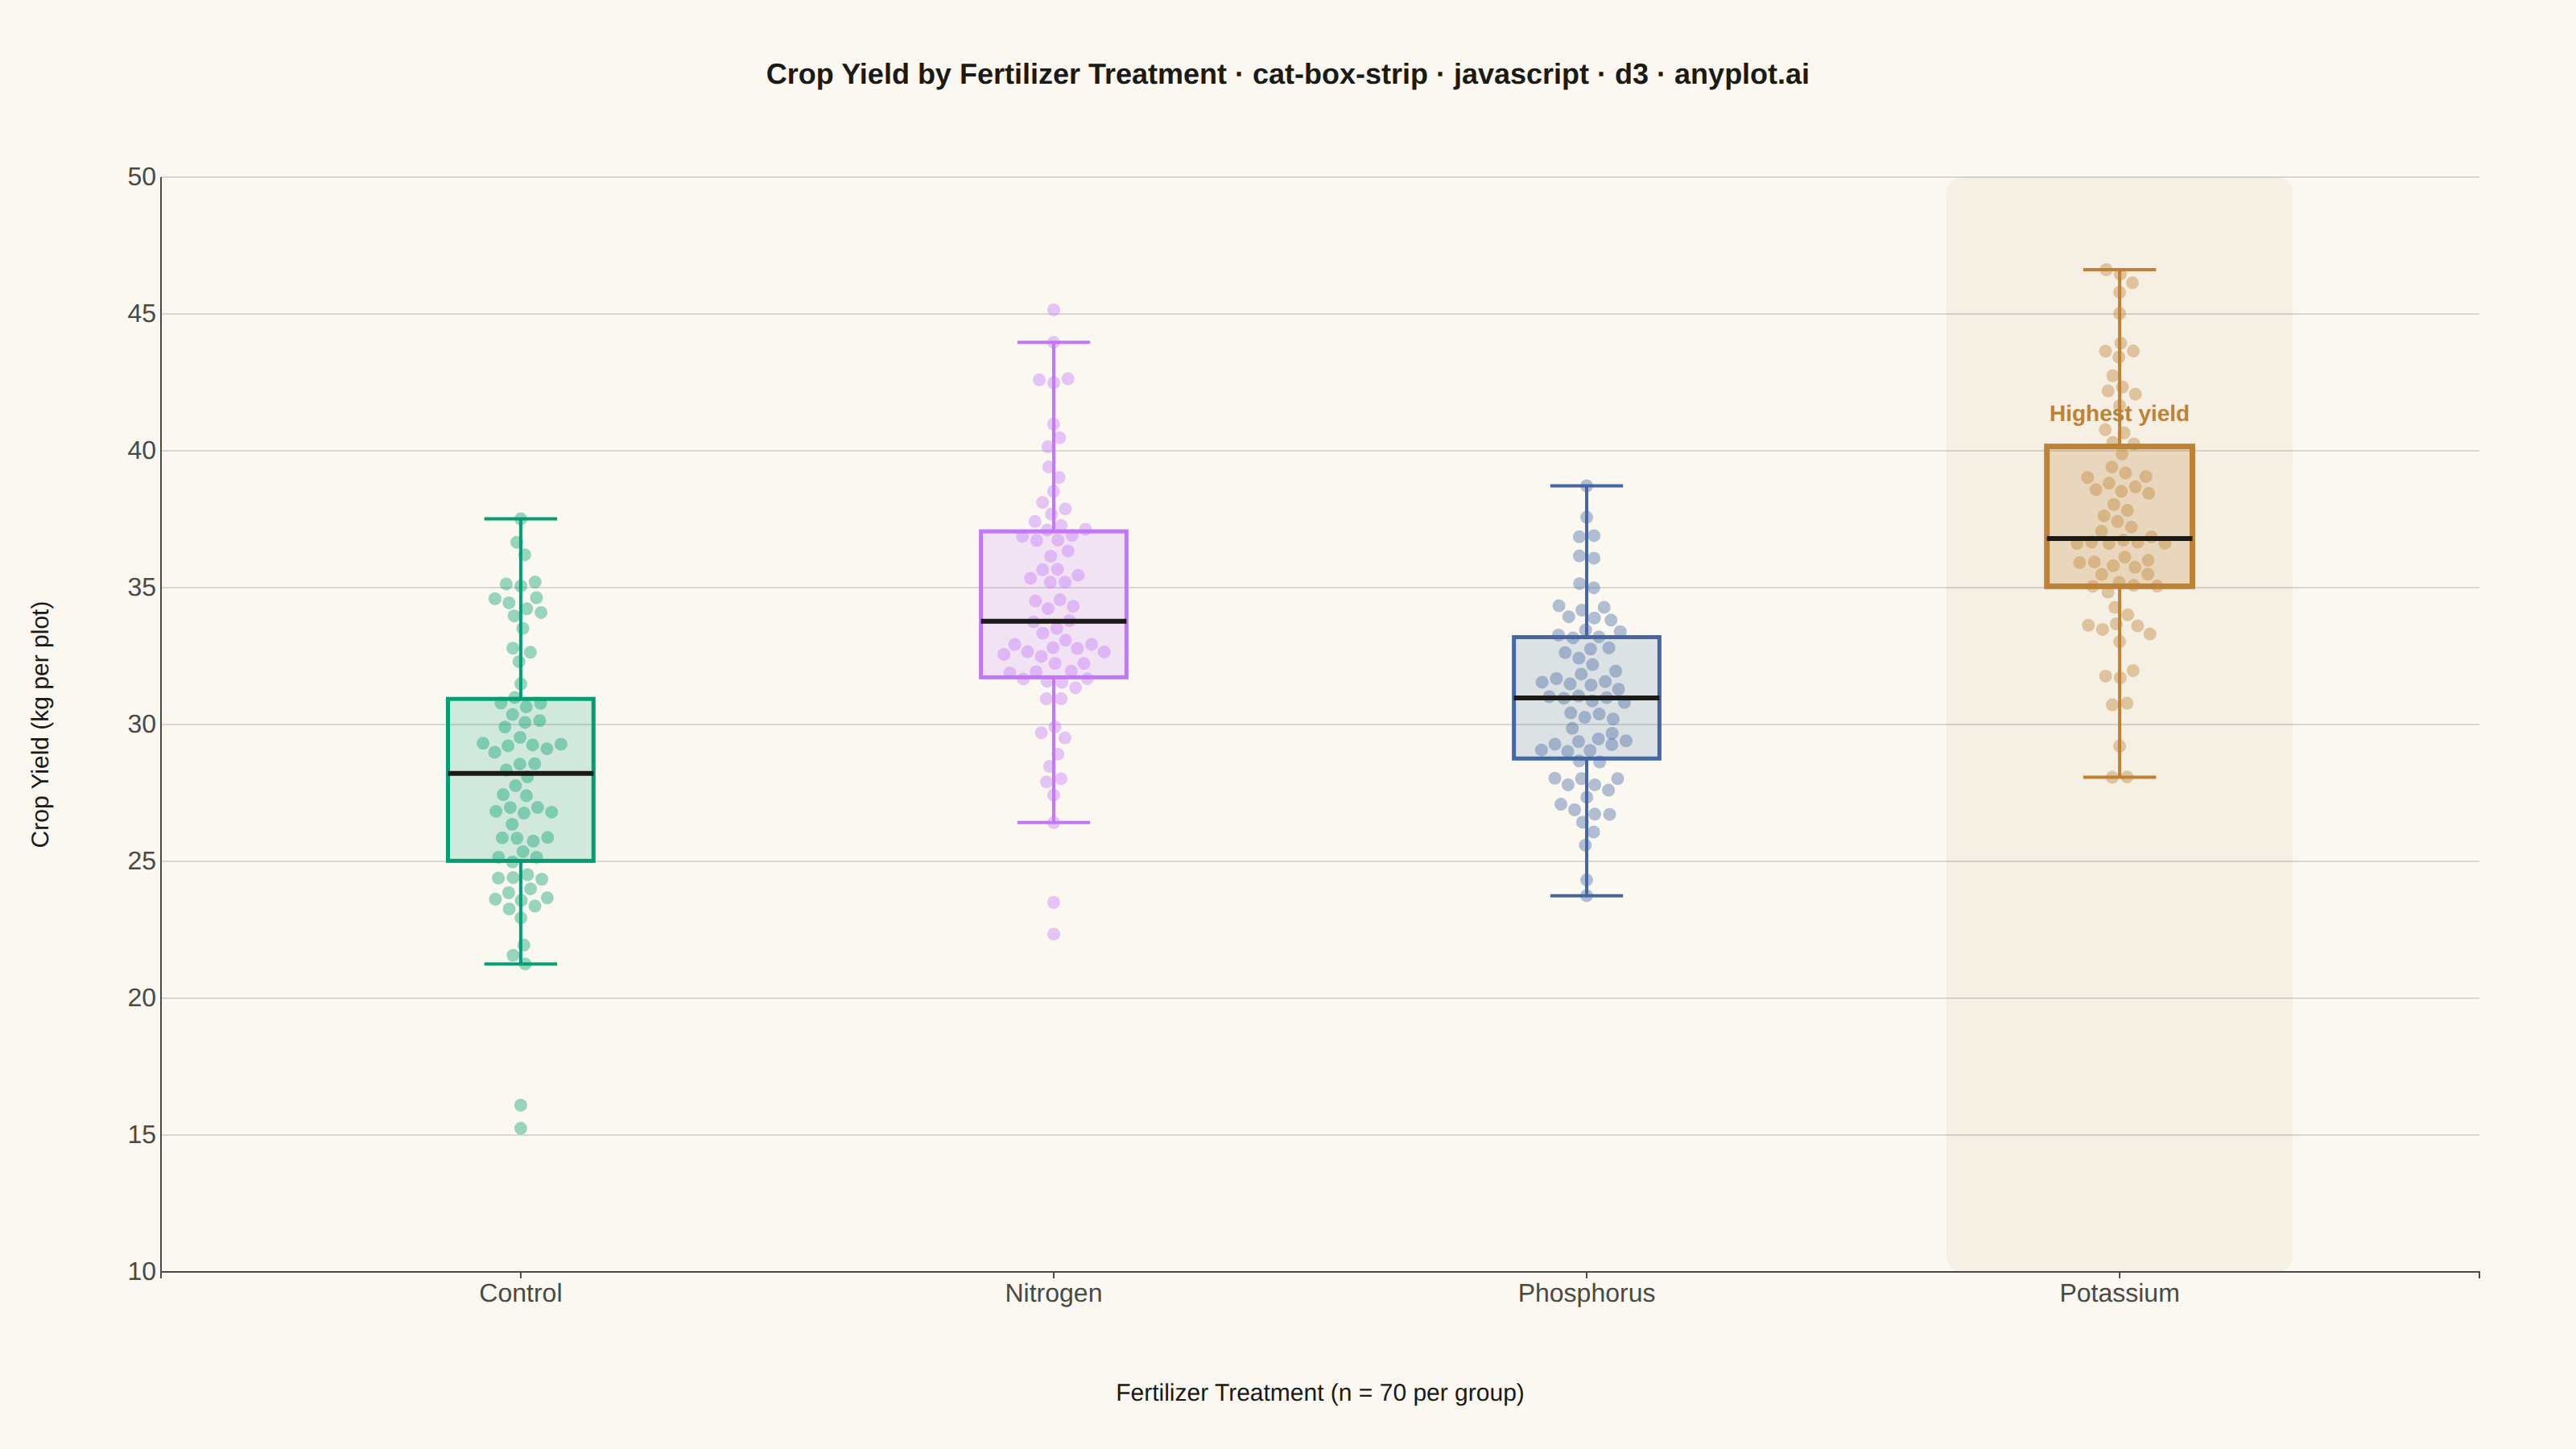
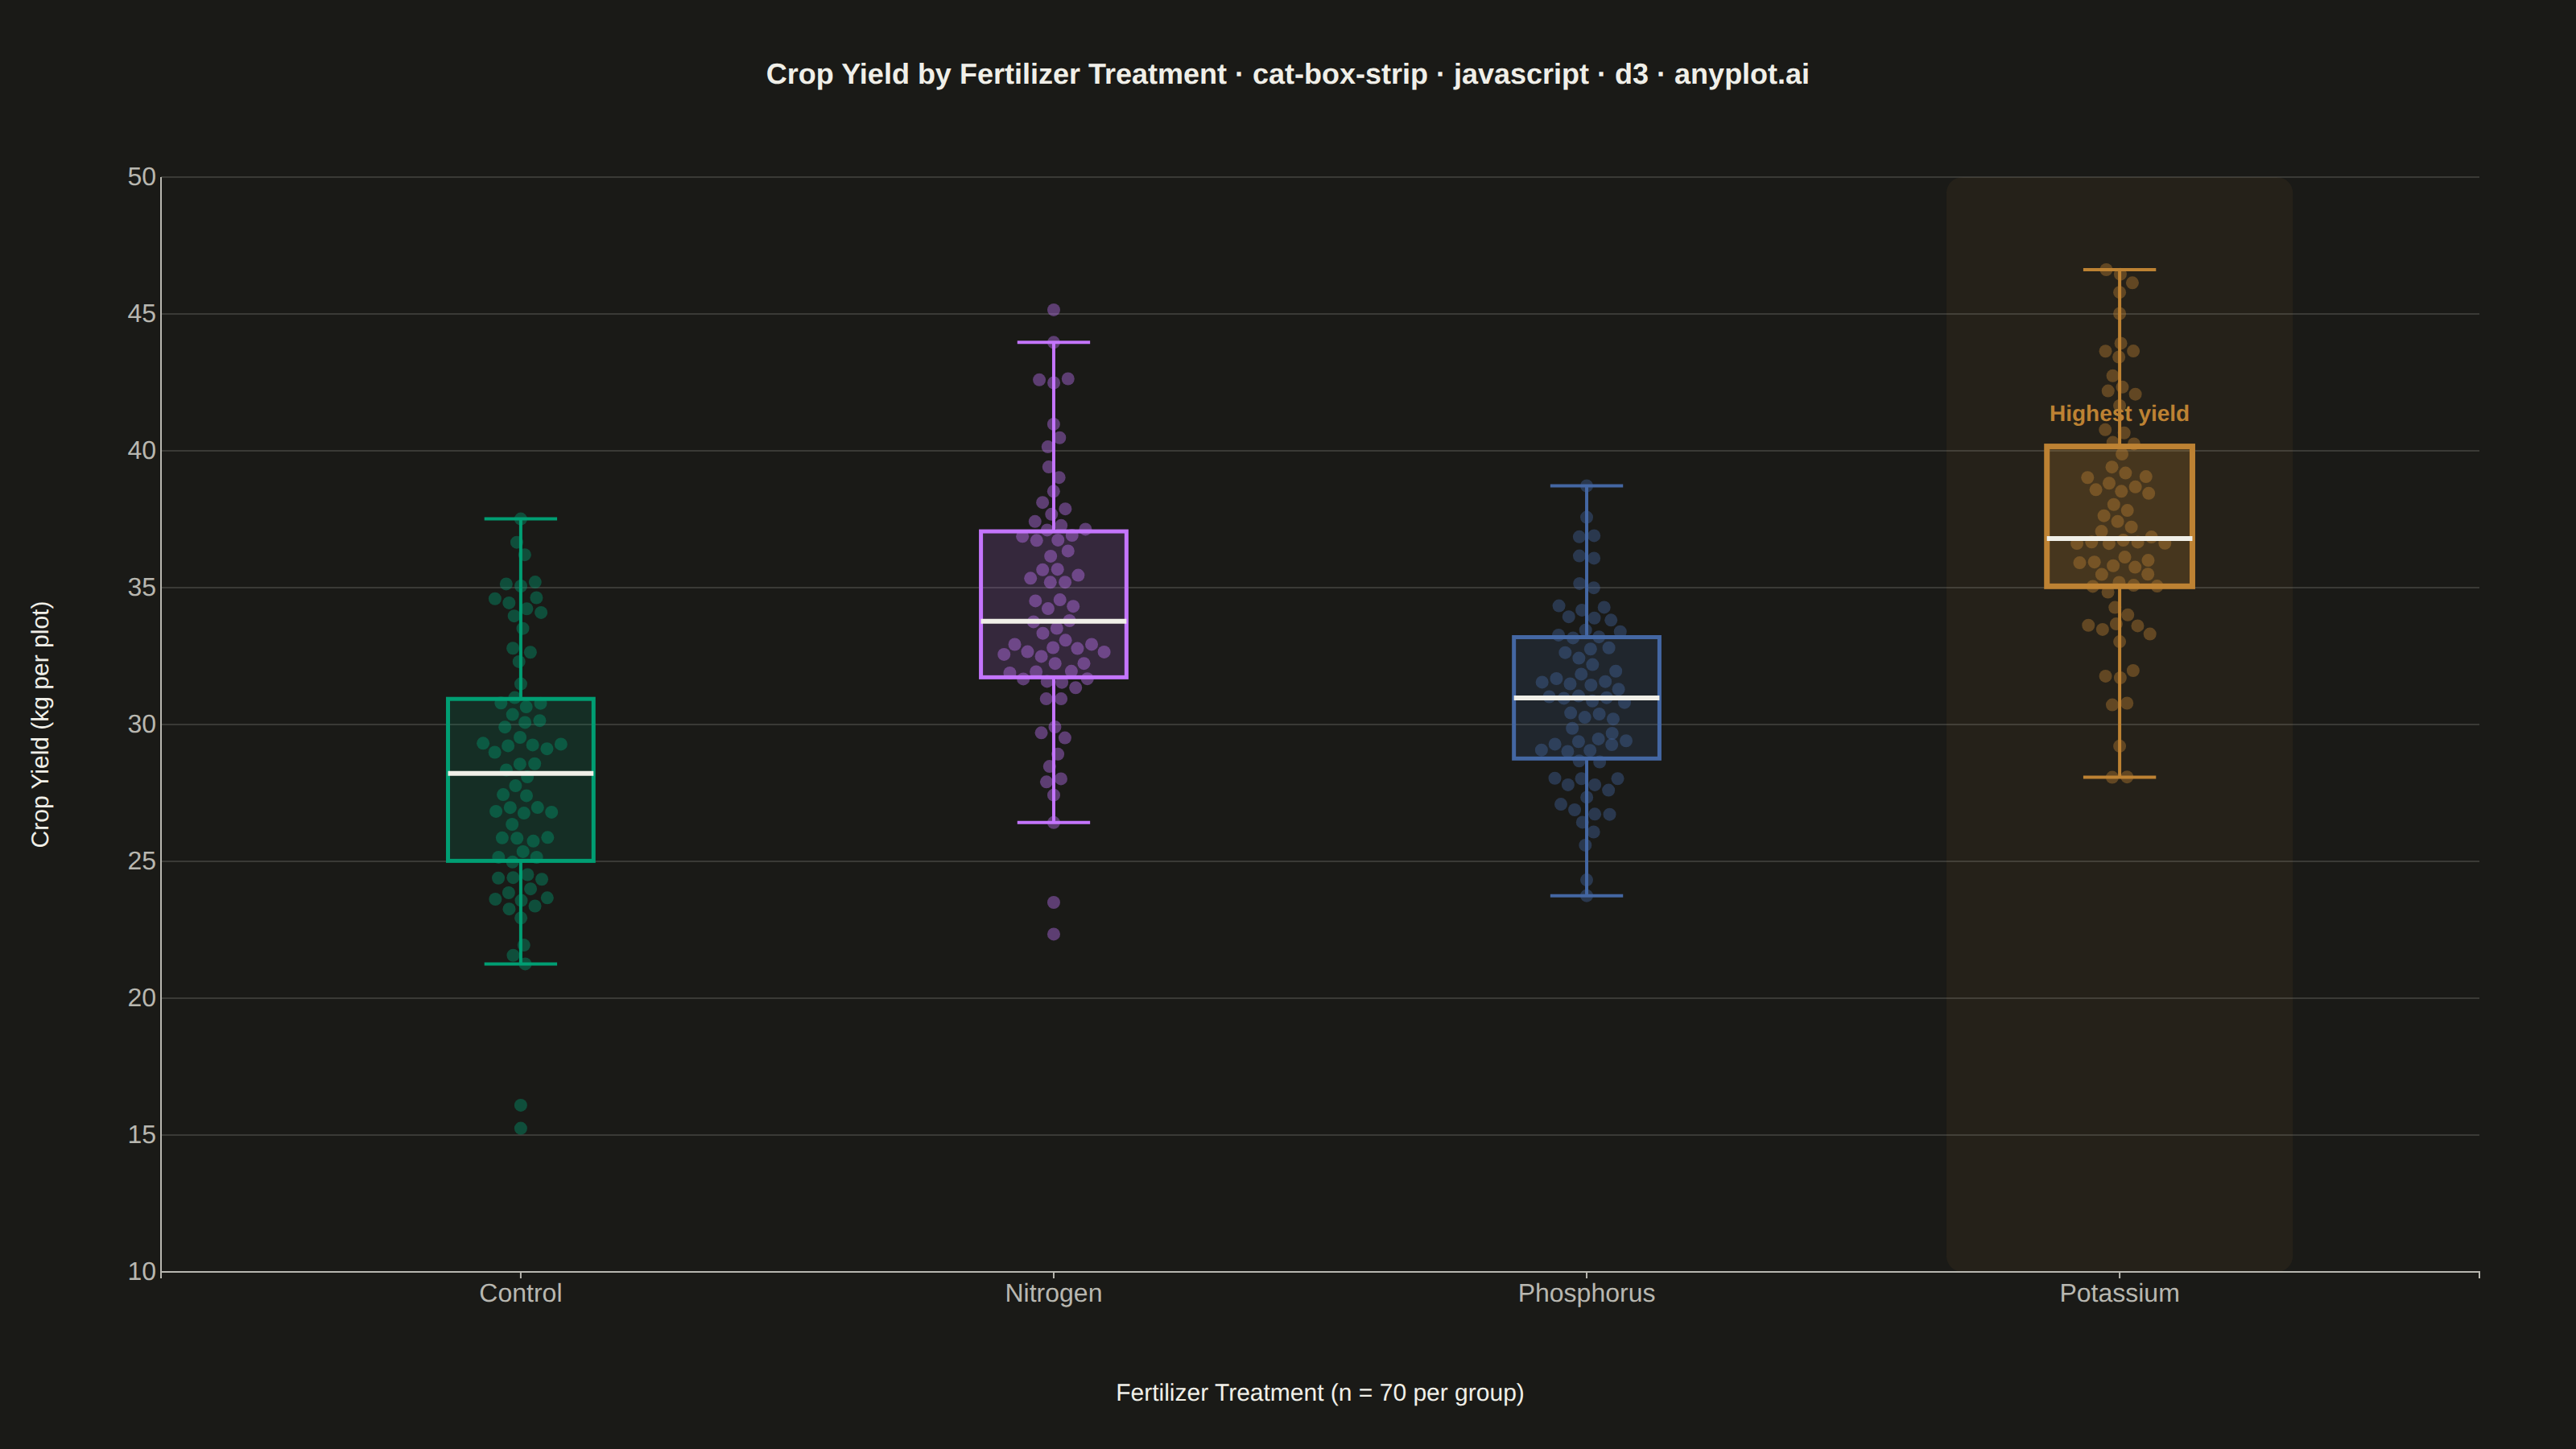
A combined visualization that overlays individual data points (strip plot) on top of a box plot. This provides both summary statistics (median, quartiles, whiskers) and visibility of the actual data distribution.
// anyplot.ai
// cat-box-strip: Box Plot with Strip Overlay
// Library: d3 7.9.0 | JavaScript 22.23.2
// Quality: 92/100 | Created: 2026-09-02

//# anyplot-orientation: landscape

const t = window.ANYPLOT_TOKENS;
const { width, height } = window.ANYPLOT_SIZE;

// --- Deterministic PRNG (LCG) + Box-Muller normal ---------------------------
let seed = 42;
function rand() {
  seed = (seed * 1103515245 + 12345) & 0x7fffffff;
  return seed / 0x7fffffff;
}
function randNormal(mean, std) {
  const u1 = Math.max(rand(), 1e-9);
  const u2 = rand();
  const z = Math.sqrt(-2 * Math.log(u1)) * Math.cos(2 * Math.PI * u2);
  return mean + z * std;
}

// --- Data: crop yield (kg per plot) under four fertilizer treatments --------
const groups = [
  { category: "Control", mean: 28, std: 4.2 },
  { category: "Nitrogen", mean: 34, std: 4.6 },
  { category: "Phosphorus", mean: 31, std: 3.6 },
  { category: "Potassium", mean: 36.5, std: 5.1 },
];
const sampleSize = 70;
const data = groups.flatMap((g) =>
  Array.from({ length: sampleSize }, () => ({
    category: g.category,
    value: Math.max(10, randNormal(g.mean, g.std)),
  }))
);

// --- Layout -------------------------------------------------------------
const margin = { top: 110, right: 60, bottom: 110, left: 100 };
const iw = width - margin.left - margin.right;
const ih = height - margin.top - margin.bottom;

const categories = groups.map((g) => g.category);
const color = d3.scaleOrdinal().domain(categories).range(t.palette);

const x = d3.scaleBand().domain(categories).range([0, iw]).padding(0.35);
const yExtent = d3.extent(data, (d) => d.value);
const y = d3
  .scaleLinear()
  .domain([yExtent[0] * 0.92, yExtent[1] * 1.05])
  .nice()
  .range([ih, 0]);

// --- Box stats per category ------------------------------------------------
const boxWidth = x.bandwidth() * 0.42;

const stats = categories.map((category) => {
  const values = data
    .filter((d) => d.category === category)
    .map((d) => d.value)
    .sort(d3.ascending);
  const q1 = d3.quantile(values, 0.25);
  const median = d3.quantile(values, 0.5);
  const q3 = d3.quantile(values, 0.75);
  const iqr = q3 - q1;
  const lowFence = q1 - 1.5 * iqr;
  const highFence = q3 + 1.5 * iqr;
  const whiskerLow = d3.min(values.filter((v) => v >= lowFence));
  const whiskerHigh = d3.max(values.filter((v) => v <= highFence));
  return { category, q1, median, q3, whiskerLow, whiskerHigh };
});

// Highest-yield group carries the story of this chart; give it a focal point.
const winner = stats.reduce((best, s) => (s.median > best.median ? s : best), stats[0]).category;

// --- SVG mount ----------------------------------------------------------
const svg = d3.select("#container").append("svg").attr("width", width).attr("height", height);
const g = svg.append("g").attr("transform", `translate(${margin.left},${margin.top})`);

// --- Winner spotlight band (drawn first, sits behind everything) ------------
g.append("rect")
  .attr("x", x(winner))
  .attr("y", 0)
  .attr("width", x.bandwidth())
  .attr("height", ih)
  .attr("rx", 10)
  .attr("fill", color(winner))
  .attr("fill-opacity", 0.07);

// --- Y gridlines (subtle, horizontal only) -------------------------------
g.append("g")
  .attr("class", "grid")
  .call(d3.axisLeft(y).ticks(6).tickSize(-iw).tickFormat(""))
  .call((sel) => sel.select(".domain").remove())
  .selectAll("line")
  .attr("stroke", t.grid);

// --- Strip points (deterministic beeswarm via force simulation, drawn beneath the box) --
const pointRadius = 4;
const swarmWidth = x.bandwidth() * 0.82;
const points = categories.flatMap((category) => {
  const cx = x(category) + x.bandwidth() / 2;
  const nodes = data
    .filter((d) => d.category === category)
    .map((d) => ({
      category: d.category,
      value: d.value,
      x: cx + (rand() - 0.5) * 4,
      y: y(d.value),
      fy: y(d.value),
    }));
  const sim = d3
    .forceSimulation(nodes)
    .force("x", d3.forceX(cx).strength(0.08))
    .force("collide", d3.forceCollide(pointRadius + 0.6))
    .stop();
  for (let i = 0; i < 200; i++) sim.tick();
  const lo = cx - swarmWidth / 2;
  const hi = cx + swarmWidth / 2;
  for (const n of nodes) n.x = Math.min(hi, Math.max(lo, n.x));
  return nodes;
});
g.selectAll("circle")
  .data(points)
  .join("circle")
  .attr("cx", (d) => d.x)
  .attr("cy", (d) => d.fy)
  .attr("r", pointRadius)
  .attr("fill", (d) => color(d.category))
  .attr("fill-opacity", 0.4)
  .attr("stroke", "none");

// --- Whiskers ----------------------------------------------------------
const whiskerGroup = g.selectAll(".whisker").data(stats).join("g").attr("class", "whisker");
const capWidth = boxWidth * 0.5;
whiskerGroup
  .append("line")
  .attr("x1", (d) => x(d.category) + x.bandwidth() / 2)
  .attr("x2", (d) => x(d.category) + x.bandwidth() / 2)
  .attr("y1", (d) => y(d.whiskerLow))
  .attr("y2", (d) => y(d.q1))
  .attr("stroke", (d) => color(d.category))
  .attr("stroke-width", 2);
whiskerGroup
  .append("line")
  .attr("x1", (d) => x(d.category) + x.bandwidth() / 2)
  .attr("x2", (d) => x(d.category) + x.bandwidth() / 2)
  .attr("y1", (d) => y(d.q3))
  .attr("y2", (d) => y(d.whiskerHigh))
  .attr("stroke", (d) => color(d.category))
  .attr("stroke-width", 2);
for (const key of ["whiskerLow", "whiskerHigh"]) {
  whiskerGroup
    .append("line")
    .attr("x1", (d) => x(d.category) + x.bandwidth() / 2 - capWidth / 2)
    .attr("x2", (d) => x(d.category) + x.bandwidth() / 2 + capWidth / 2)
    .attr("y1", (d) => y(d[key]))
    .attr("y2", (d) => y(d[key]))
    .attr("stroke", (d) => color(d.category))
    .attr("stroke-width", 2);
}

// --- Boxes (translucent so strip points show through) -----------------
g.selectAll(".box")
  .data(stats)
  .join("rect")
  .attr("class", "box")
  .attr("x", (d) => x(d.category) + x.bandwidth() / 2 - boxWidth / 2)
  .attr("y", (d) => y(d.q3))
  .attr("width", boxWidth)
  .attr("height", (d) => y(d.q1) - y(d.q3))
  .attr("fill", (d) => color(d.category))
  .attr("fill-opacity", (d) => (d.category === winner ? 0.22 : 0.16))
  .attr("stroke", (d) => color(d.category))
  .attr("stroke-width", (d) => (d.category === winner ? 3.5 : 2.5));

// --- Winner annotation (points the eye at the highest-yield group) ---------
const winnerStats = stats.find((d) => d.category === winner);
const winnerCx = x(winner) + x.bandwidth() / 2;
g.append("text")
  .attr("x", winnerCx)
  .attr("y", y(winnerStats.q3) - 16)
  .attr("text-anchor", "middle")
  .attr("fill", color(winner))
  .style("font-size", "14px")
  .style("font-weight", "600")
  .text("Highest yield");

// --- Median lines --------------------------------------------------------
g.selectAll(".median")
  .data(stats)
  .join("line")
  .attr("class", "median")
  .attr("x1", (d) => x(d.category) + x.bandwidth() / 2 - boxWidth / 2)
  .attr("x2", (d) => x(d.category) + x.bandwidth() / 2 + boxWidth / 2)
  .attr("y1", (d) => y(d.median))
  .attr("y2", (d) => y(d.median))
  .attr("stroke", t.ink)
  .attr("stroke-width", 3);

// --- Axes ------------------------------------------------------------------
// y ticks drop their stub (tickSize 0) since the gridlines already mark them;
// x keeps a short stub since it has no gridline counterpart.
const xAxis = g
  .append("g")
  .attr("transform", `translate(0,${ih})`)
  .call(d3.axisBottom(x).tickSize(4));
const yAxis = g.append("g").call(d3.axisLeft(y).ticks(6).tickSize(0));
for (const ax of [xAxis, yAxis]) {
  ax.selectAll("text").attr("fill", t.inkSoft).style("font-size", "16px");
  ax.selectAll("line").attr("stroke", t.inkSoft);
  ax.select(".domain").attr("stroke", t.inkSoft).attr("stroke-width", 1);
}

// --- Axis labels -------------------------------------------------------------
// Sized below the 18px title so the bold title reads as clearly dominant.
g.append("text")
  .attr("x", iw / 2)
  .attr("y", ih + 80)
  .attr("text-anchor", "middle")
  .attr("fill", t.ink)
  .style("font-size", "15px")
  .text("Fertilizer Treatment (n = 70 per group)");

g.append("text")
  .attr("transform", "rotate(-90)")
  .attr("x", -ih / 2)
  .attr("y", -70)
  .attr("text-anchor", "middle")
  .attr("fill", t.ink)
  .style("font-size", "15px")
  .text("Crop Yield (kg per plot)");

// --- Title -----------------------------------------------------------------
// title = "Crop Yield by Fertilizer Treatment · cat-box-strip · javascript · d3 · anyplot.ai" (81 chars)
// fontsize = round(22 * 67/81) = 18px, per plot-generator.md title-length scaling formula
svg
  .append("text")
  .attr("x", width / 2)
  .attr("y", 52)
  .attr("text-anchor", "middle")
  .attr("fill", t.ink)
  .style("font-size", "18px")
  .style("font-weight", "600")
  .text("Crop Yield by Fertilizer Treatment · cat-box-strip · javascript · d3 · anyplot.ai");
Runnable source as JSON, for any HTTP client: https://api.anyplot.ai/specs/cat-box-strip/d3/code. Any spec id and library id listed in llms-full.txt fit the same URL shape; every URL below is complete and callable.
{
  "spec_id": "cat-box-strip",
  "language": "javascript",
  "library": "d3",
  "page": "https://anyplot.ai/cat-box-strip/javascript/d3",
  "hub": "https://anyplot.ai/cat-box-strip",
  "code_json": "https://api.anyplot.ai/specs/cat-box-strip/d3/code",
  "spec_json": "https://api.anyplot.ai/specs/cat-box-strip",
  "render_light_png": "https://storage.googleapis.com/anyplot-images/plots/cat-box-strip/javascript/d3/plot-light.png",
  "render_dark_png": "https://storage.googleapis.com/anyplot-images/plots/cat-box-strip/javascript/d3/plot-dark.png",
  "interactive_light_html": "https://storage.googleapis.com/anyplot-images/plots/cat-box-strip/javascript/d3/plot-light.html",
  "interactive_dark_html": "https://storage.googleapis.com/anyplot-images/plots/cat-box-strip/javascript/d3/plot-dark.html",
  "quality_score": 92.0,
  "license": "MIT",
  "guide": "https://anyplot.ai/llms.txt"
}
Part of Box Plot with Strip Overlay on anyplot.ai.