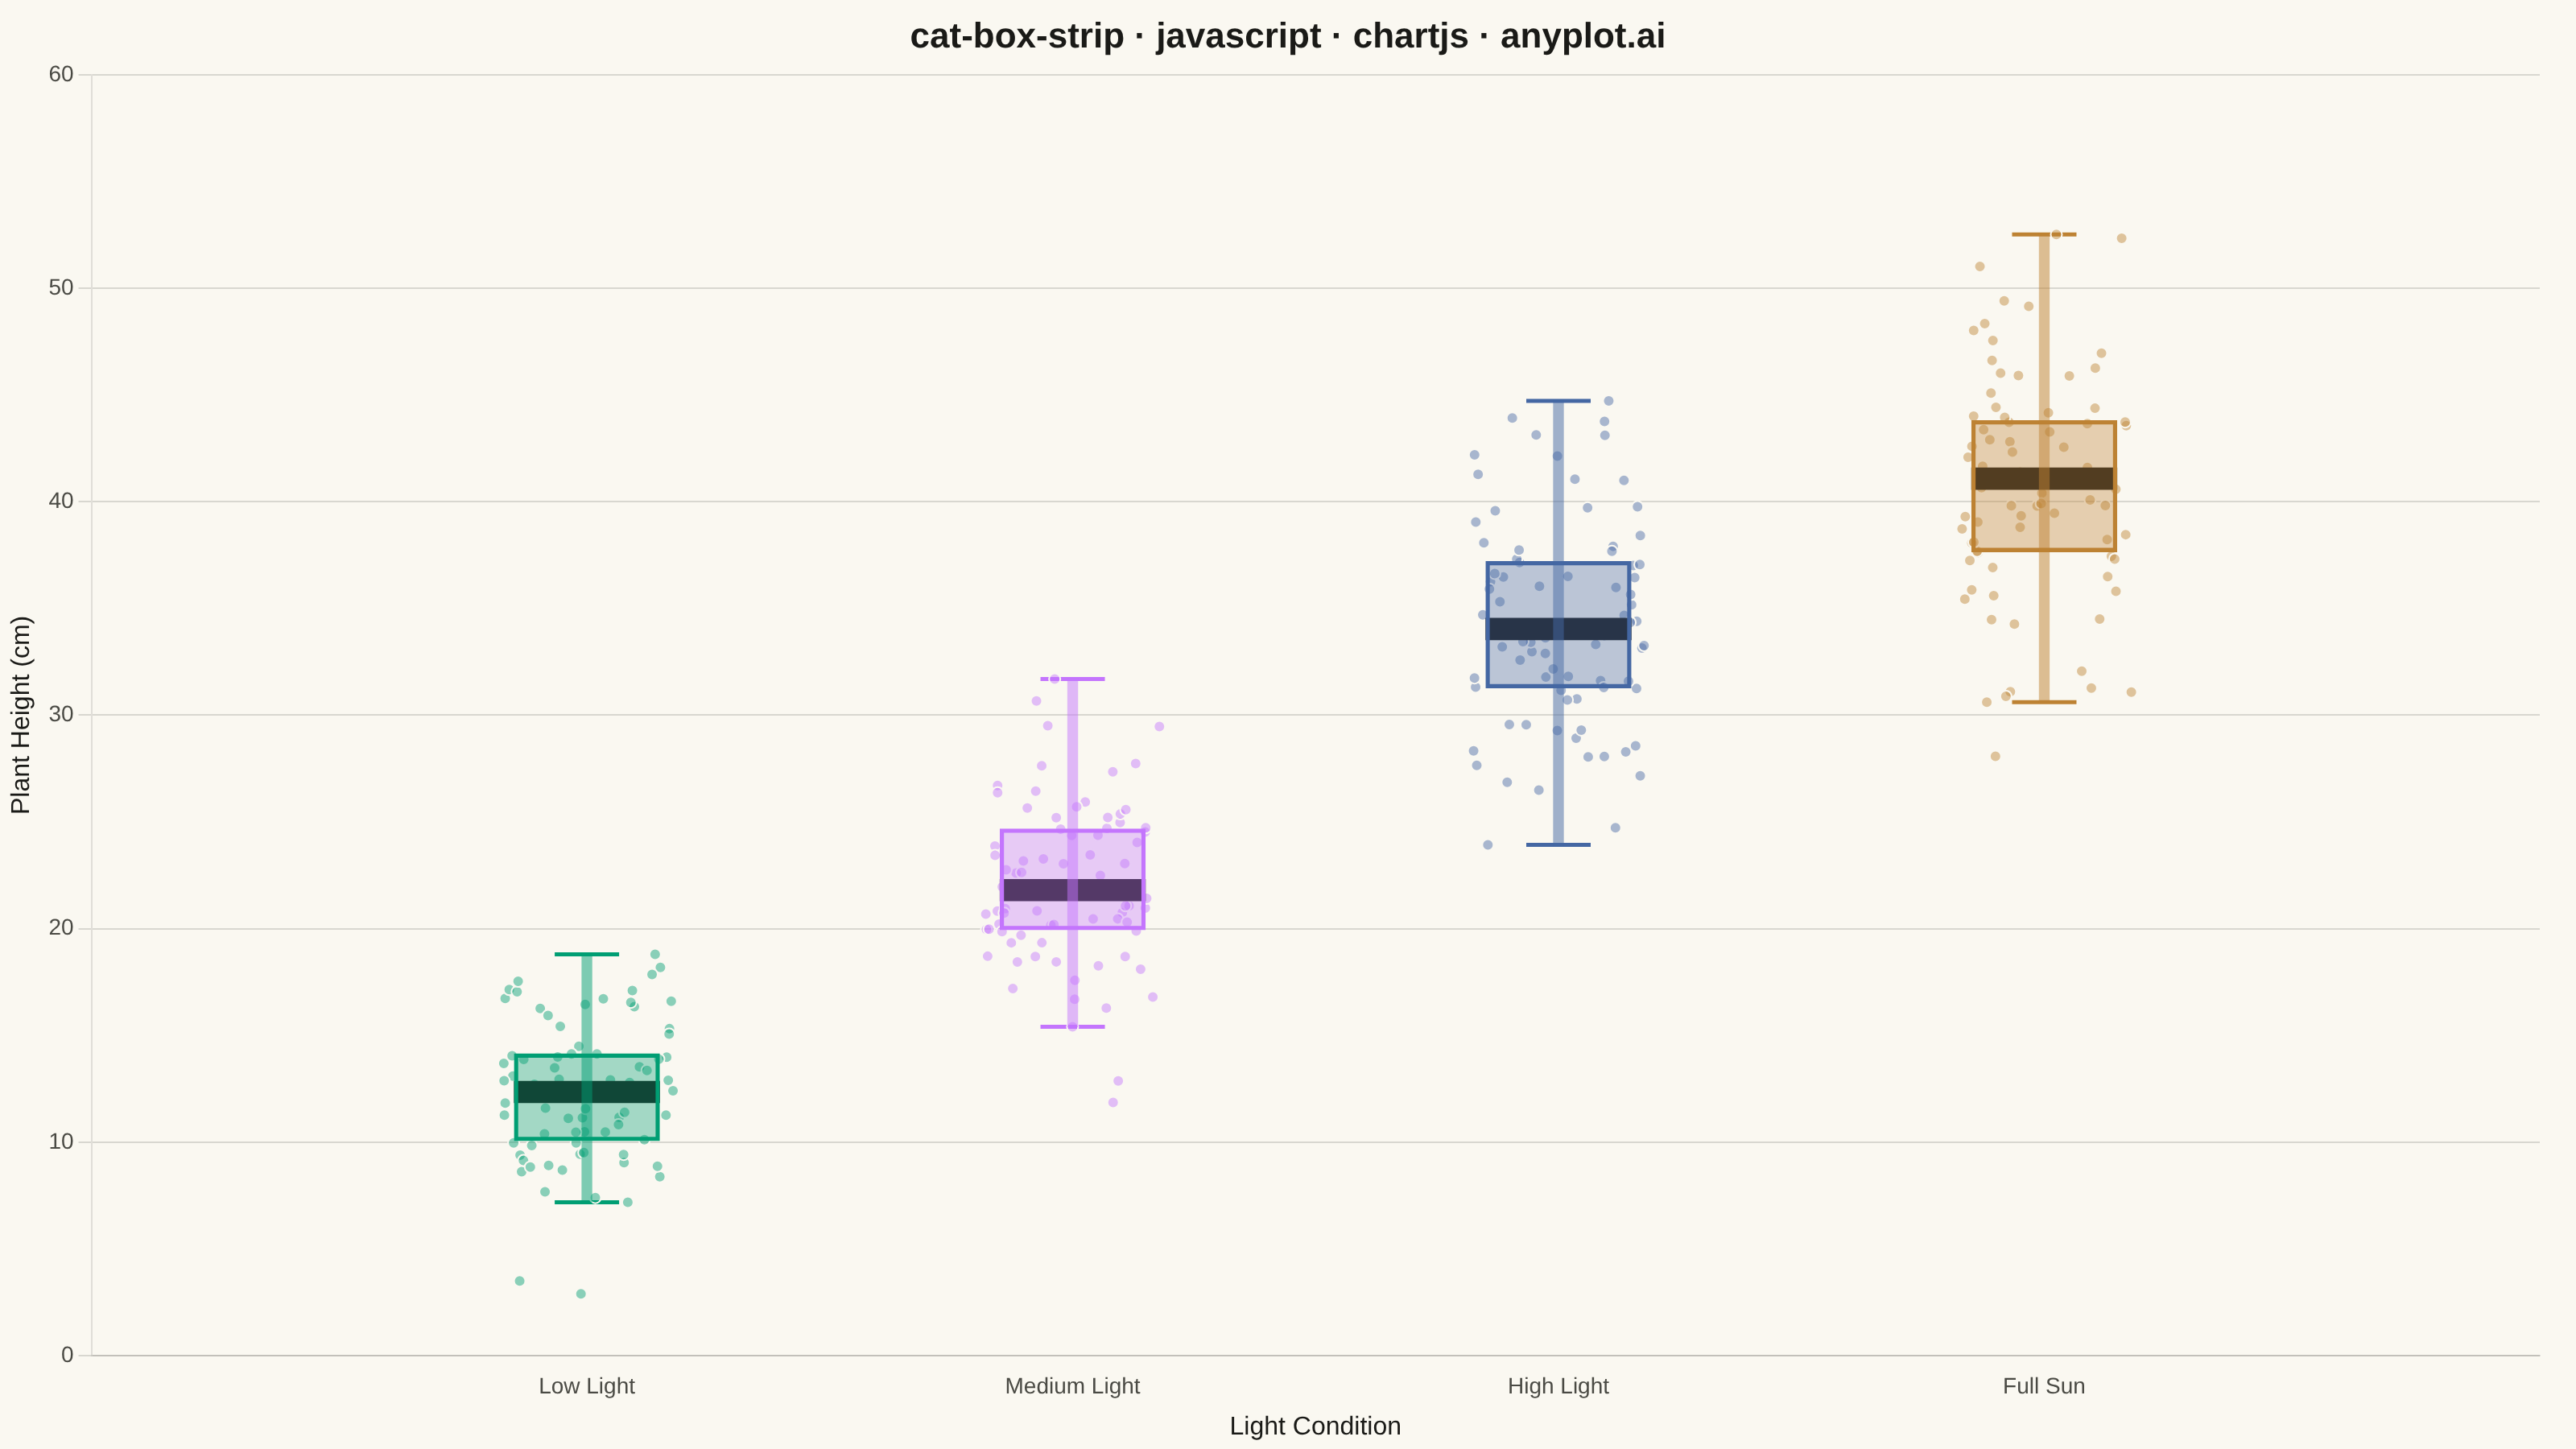
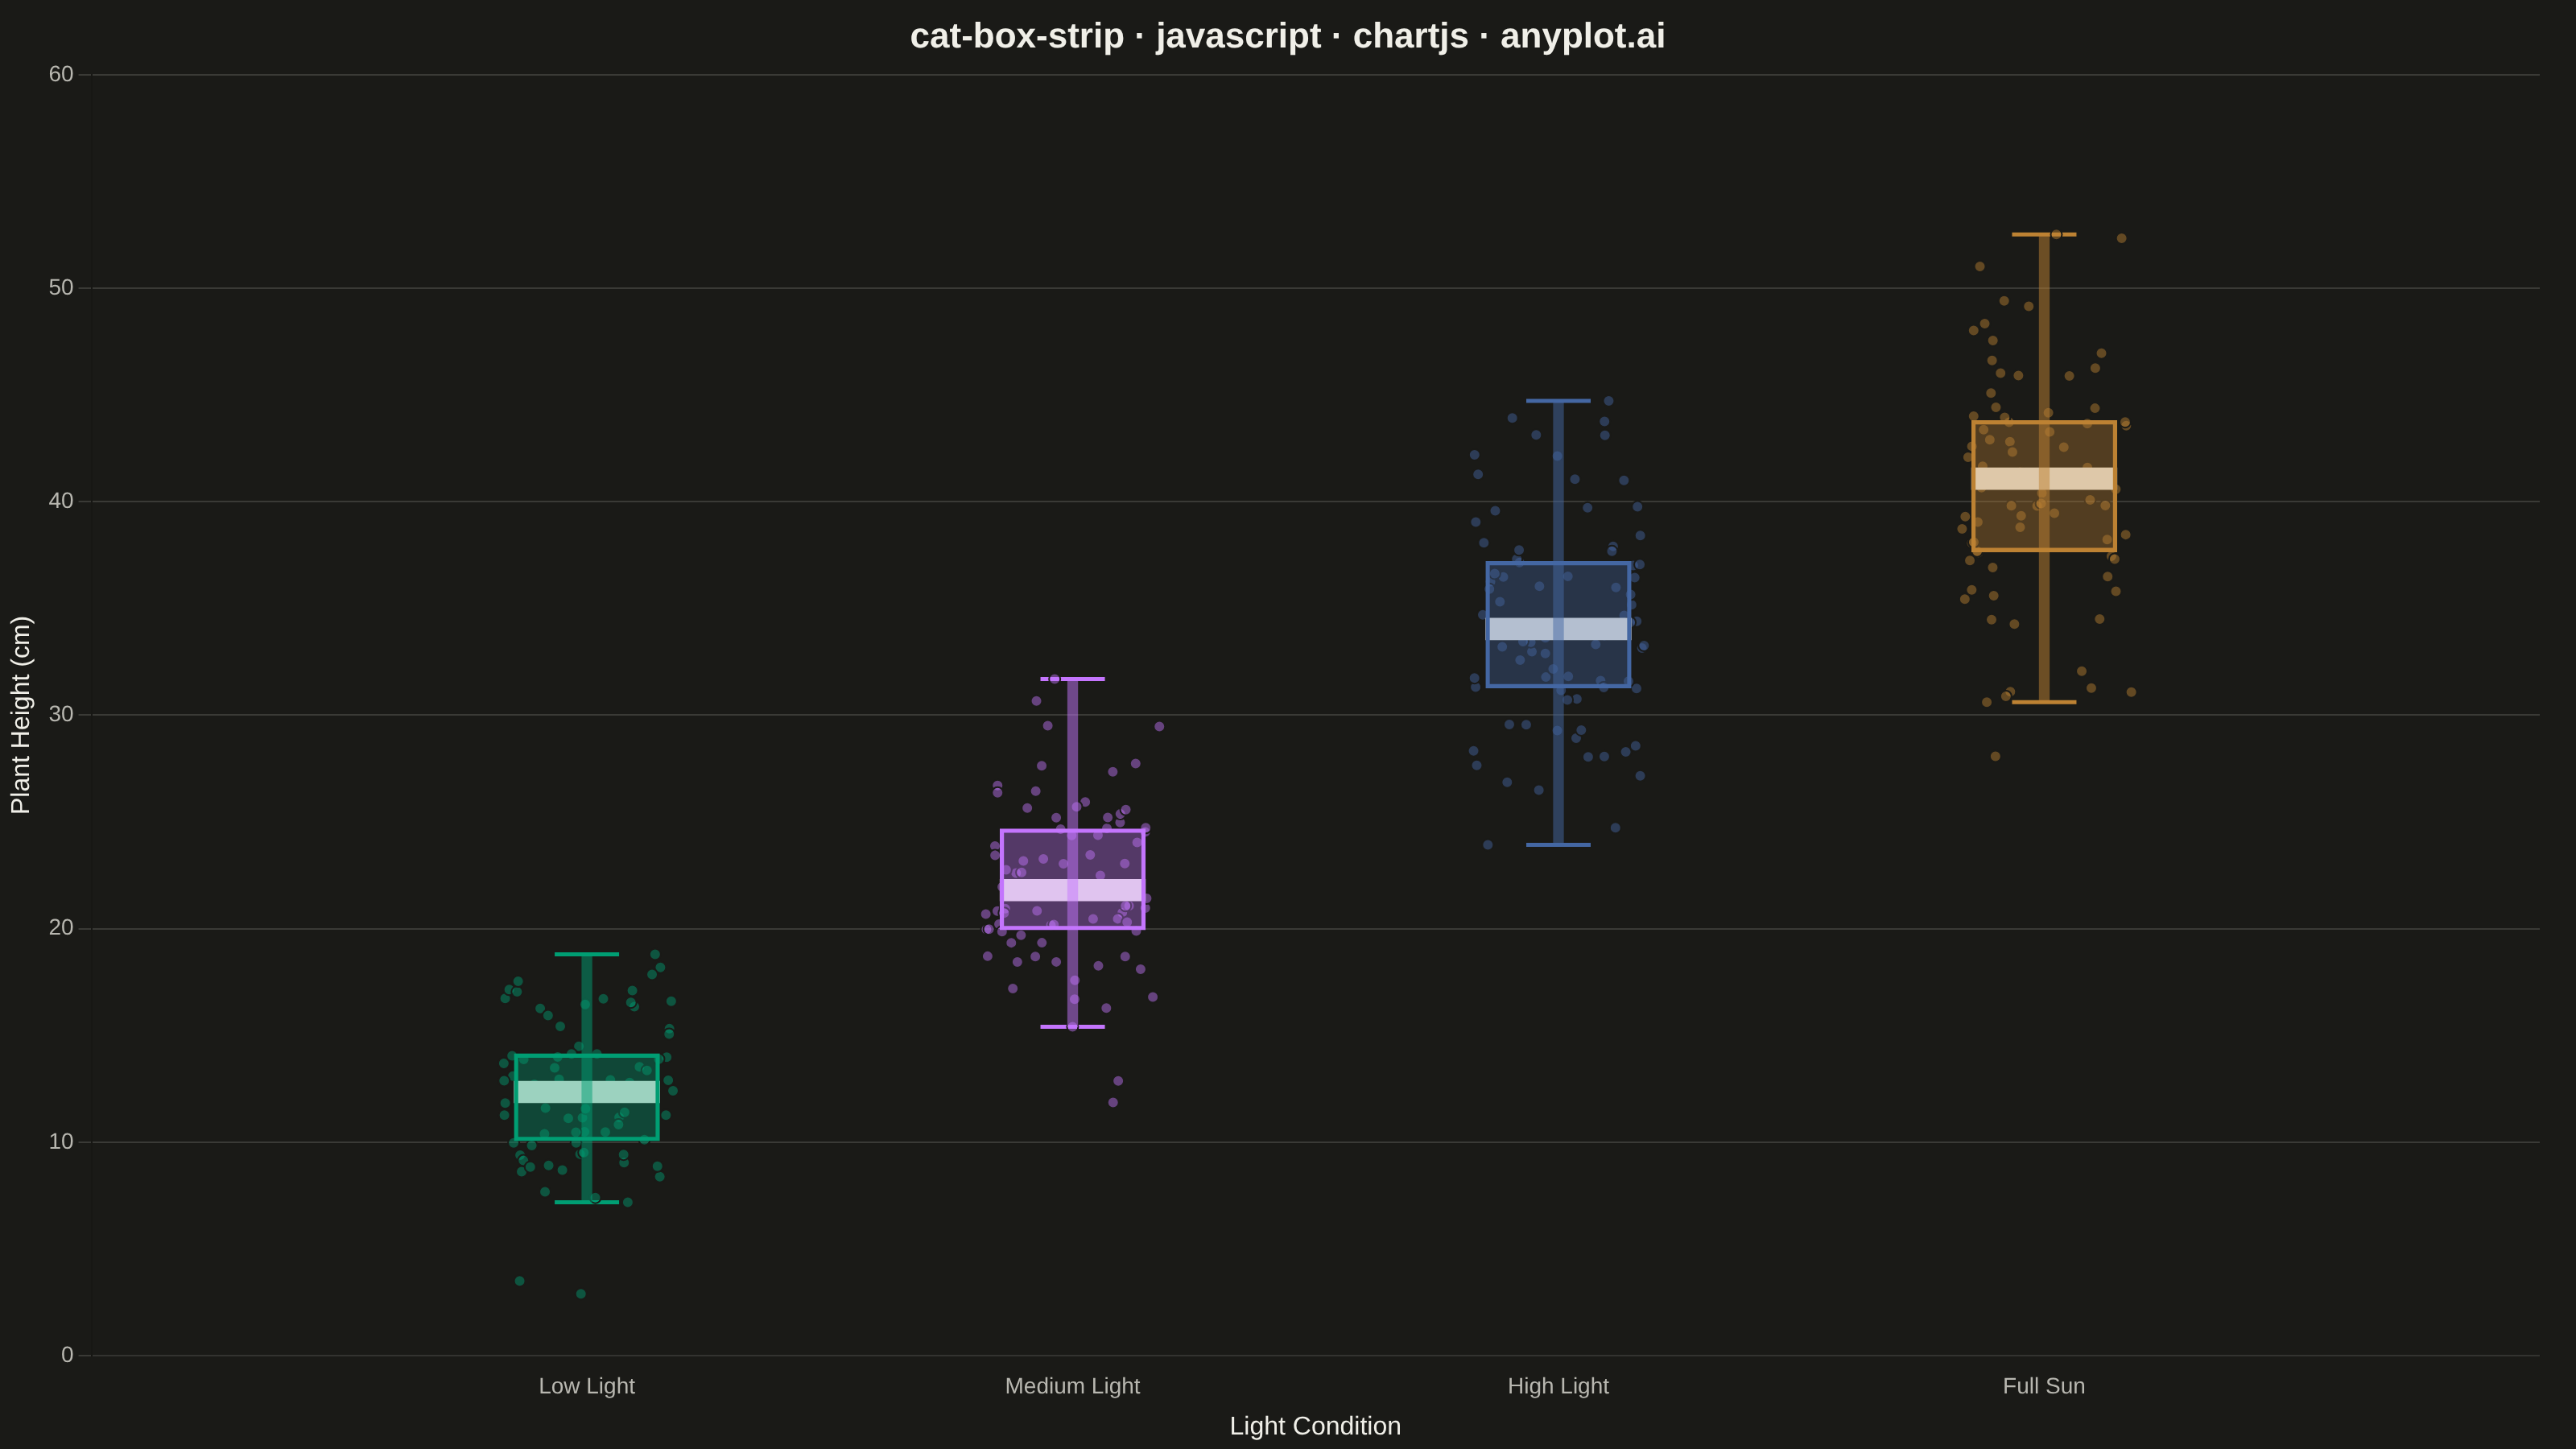
The same plot in 14 other libraries — JavaScript: D3.js, Apache ECharts, Highcharts, MUI X Charts; Python: Altair, Bokeh, lets-plot, Matplotlib, Plotly, plotnine, Pygal, Seaborn; R: ggplot2; Julia: Makie.jl. Compare all 15 side by side: Box Plot with Strip Overlay in Python, R, Julia and JavaScript.
A combined visualization that overlays individual data points (strip plot) on top of a box plot. This provides both summary statistics (median, quartiles, whiskers) and visibility of the actual data distribution.
// anyplot.ai
// cat-box-strip: Box Plot with Strip Overlay
// Library: chartjs 4.4.7 | JavaScript 22.23.2
// Quality: 88/100 | Created: 2026-09-02

const t = window.ANYPLOT_TOKENS;

// --- Data (in-memory, deterministic LCG + Box-Muller) -----------------------
let lcgState = 42;
function nextRandom() {
  lcgState = (lcgState * 1103515245 + 12345) % 2147483648;
  return lcgState / 2147483648;
}
function nextGaussian() {
  const u1 = Math.max(nextRandom(), 1e-9);
  const u2 = nextRandom();
  return Math.sqrt(-2 * Math.log(u1)) * Math.cos(2 * Math.PI * u2);
}
function hexToRgba(hex, alpha) {
  const r = parseInt(hex.slice(1, 3), 16);
  const g = parseInt(hex.slice(3, 5), 16);
  const b = parseInt(hex.slice(5, 7), 16);
  return `rgba(${r}, ${g}, ${b}, ${alpha})`;
}
function quantile(sortedValues, p) {
  const idx = p * (sortedValues.length - 1);
  const lower = Math.floor(idx);
  const upper = Math.ceil(idx);
  if (lower === upper) return sortedValues[lower];
  return (
    sortedValues[lower] +
    (sortedValues[upper] - sortedValues[lower]) * (idx - lower)
  );
}

const categories = ["Low Light", "Medium Light", "High Light", "Full Sun"];
const means = [12, 22, 34, 41];
const sds = [3, 4, 5, 6];
const sampleSize = 80;

const groupValues = categories.map((_, i) => {
  const values = [];
  for (let j = 0; j < sampleSize; j++) {
    values.push(Math.max(1, means[i] + sds[i] * nextGaussian()));
  }
  return values;
});

const stats = groupValues.map((values) => {
  const sorted = [...values].sort((a, b) => a - b);
  const q1 = quantile(sorted, 0.25);
  const median = quantile(sorted, 0.5);
  const q3 = quantile(sorted, 0.75);
  const iqr = q3 - q1;
  const lowerFence = q1 - 1.5 * iqr;
  const upperFence = q3 + 1.5 * iqr;
  const withinLower = sorted.filter((v) => v >= lowerFence);
  const withinUpper = sorted.filter((v) => v <= upperFence);
  return {
    q1,
    median,
    q3,
    whiskerMin: withinLower.length ? withinLower[0] : sorted[0],
    whiskerMax: withinUpper.length
      ? withinUpper[withinUpper.length - 1]
      : sorted[sorted.length - 1],
  };
});

const globalMin = Math.min(...groupValues.flat());
const globalMax = Math.max(...groupValues.flat());
const medianEpsilon = (globalMax - globalMin) * 0.01;

// --- Mount -------------------------------------------------------------------
const canvas = document.createElement("canvas");
document.getElementById("container").appendChild(canvas);

// --- Chart (floating bars for box/whisker/median, scatter for strip) --------
const whiskerDataset = {
  type: "bar",
  label: "Whisker range",
  data: stats.map((s, i) => ({ x: i, y: [s.whiskerMin, s.whiskerMax] })),
  backgroundColor: (ctx) =>
    hexToRgba(t.palette[ctx.dataIndex % t.palette.length], 0.5),
  barThickness: 6,
  borderWidth: 0,
  grouped: false,
};

const boxDataset = {
  type: "bar",
  label: "Interquartile range",
  data: stats.map((s, i) => ({ x: i, y: [s.q1, s.q3] })),
  backgroundColor: (ctx) =>
    hexToRgba(t.palette[ctx.dataIndex % t.palette.length], 0.35),
  borderColor: (ctx) => t.palette[ctx.dataIndex % t.palette.length],
  borderWidth: 2,
  borderSkipped: false,
  barThickness: 90,
  grouped: false,
};

const medianDataset = {
  type: "bar",
  label: "Median",
  data: stats.map((s, i) => ({
    x: i,
    y: [s.median - medianEpsilon, s.median + medianEpsilon],
  })),
  backgroundColor: t.ink,
  borderWidth: 0,
  borderSkipped: false,
  barThickness: 90,
  grouped: false,
};

const stripDatasets = categories.map((category, i) => ({
  type: "scatter",
  label: category,
  data: groupValues[i].map((value) => ({
    x: i + (nextRandom() - 0.5) * 0.36,
    y: value,
  })),
  backgroundColor: hexToRgba(t.palette[i % t.palette.length], 0.45),
  pointRadius: 3.5,
  pointHoverRadius: 3.5,
  pointBorderWidth: 1,
  pointBorderColor: t.pageBg,
}));

// Whisker end caps: short horizontal strokes at whiskerMin/whiskerMax so the
// range reads unambiguously as a box-plot whisker rather than a plain bar.
const capDataset = {
  type: "scatter",
  label: "Whisker caps",
  data: stats.flatMap((s, i) => [
    { x: i, y: s.whiskerMin },
    { x: i, y: s.whiskerMax },
  ]),
  pointStyle: "line",
  pointRotation: 0,
  pointRadius: 20,
  pointBorderColor: (ctx) =>
    t.palette[Math.floor(ctx.dataIndex / 2) % t.palette.length],
  pointBorderWidth: 2.5,
  showLine: false,
};

new Chart(canvas, {
  type: "bar",
  data: {
    datasets: [
      whiskerDataset,
      boxDataset,
      medianDataset,
      ...stripDatasets,
      capDataset,
    ],
  },
  options: {
    responsive: true,
    maintainAspectRatio: false,
    animation: false,
    plugins: {
      title: {
        display: true,
        text: "cat-box-strip · javascript · chartjs · anyplot.ai",
        color: t.ink,
        font: { size: 22 },
      },
      legend: { display: false },
    },
    scales: {
      x: {
        type: "linear",
        min: -0.6,
        max: categories.length - 1 + 0.6,
        ticks: {
          stepSize: 1,
          color: t.inkSoft,
          font: { size: 14 },
          callback: (value) =>
            categories[value] !== undefined ? categories[value] : "",
        },
        grid: { display: false },
        title: {
          display: true,
          text: "Light Condition",
          color: t.ink,
          font: { size: 16 },
        },
      },
      y: {
        ticks: { color: t.inkSoft, font: { size: 14 } },
        grid: { color: t.grid },
        title: {
          display: true,
          text: "Plant Height (cm)",
          color: t.ink,
          font: { size: 16 },
        },
      },
    },
  },
});
Runnable source as JSON, for any HTTP client: https://api.anyplot.ai/specs/cat-box-strip/chartjs/code. Any spec id and library id listed in llms-full.txt fit the same URL shape; every URL below is complete and callable.
{
  "spec_id": "cat-box-strip",
  "language": "javascript",
  "library": "chartjs",
  "page": "https://anyplot.ai/cat-box-strip/javascript/chartjs",
  "hub": "https://anyplot.ai/cat-box-strip",
  "code_json": "https://api.anyplot.ai/specs/cat-box-strip/chartjs/code",
  "spec_json": "https://api.anyplot.ai/specs/cat-box-strip",
  "render_light_png": "https://storage.googleapis.com/anyplot-images/plots/cat-box-strip/javascript/chartjs/plot-light.png",
  "render_dark_png": "https://storage.googleapis.com/anyplot-images/plots/cat-box-strip/javascript/chartjs/plot-dark.png",
  "interactive_light_html": "https://storage.googleapis.com/anyplot-images/plots/cat-box-strip/javascript/chartjs/plot-light.html",
  "interactive_dark_html": "https://storage.googleapis.com/anyplot-images/plots/cat-box-strip/javascript/chartjs/plot-dark.html",
  "quality_score": 88.0,
  "license": "MIT",
  "guide": "https://anyplot.ai/llms.txt"
}
Part of Box Plot with Strip Overlay on anyplot.ai.