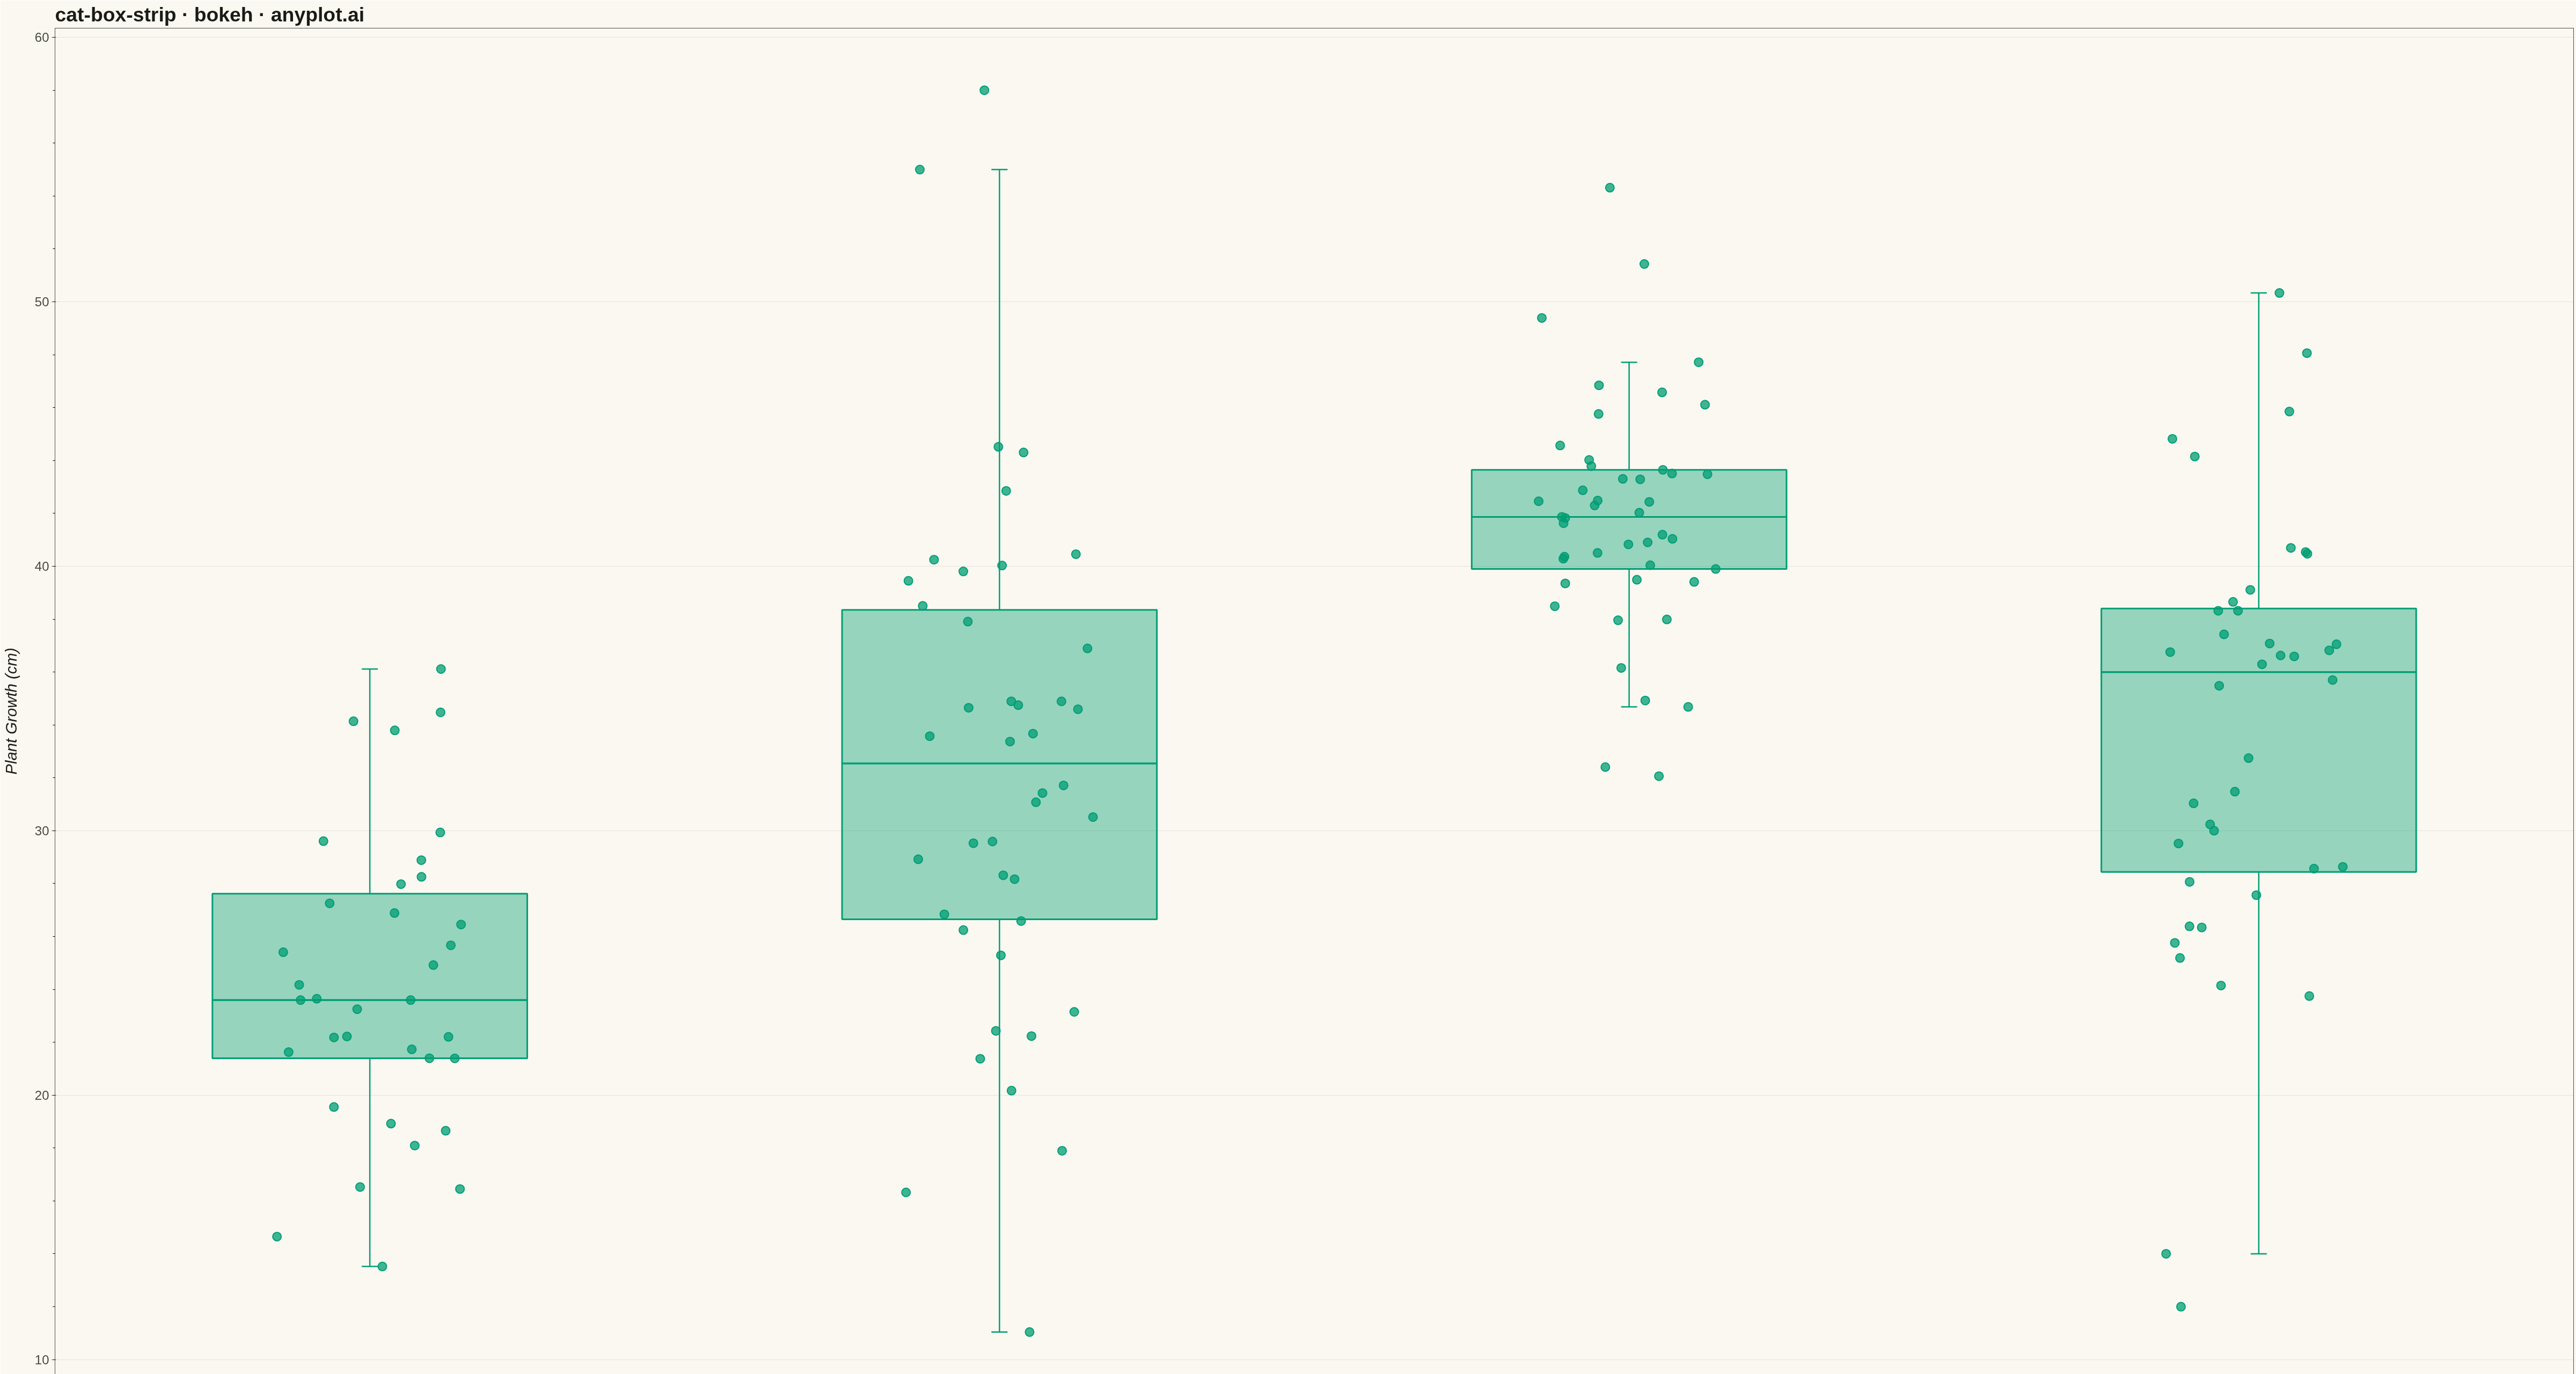
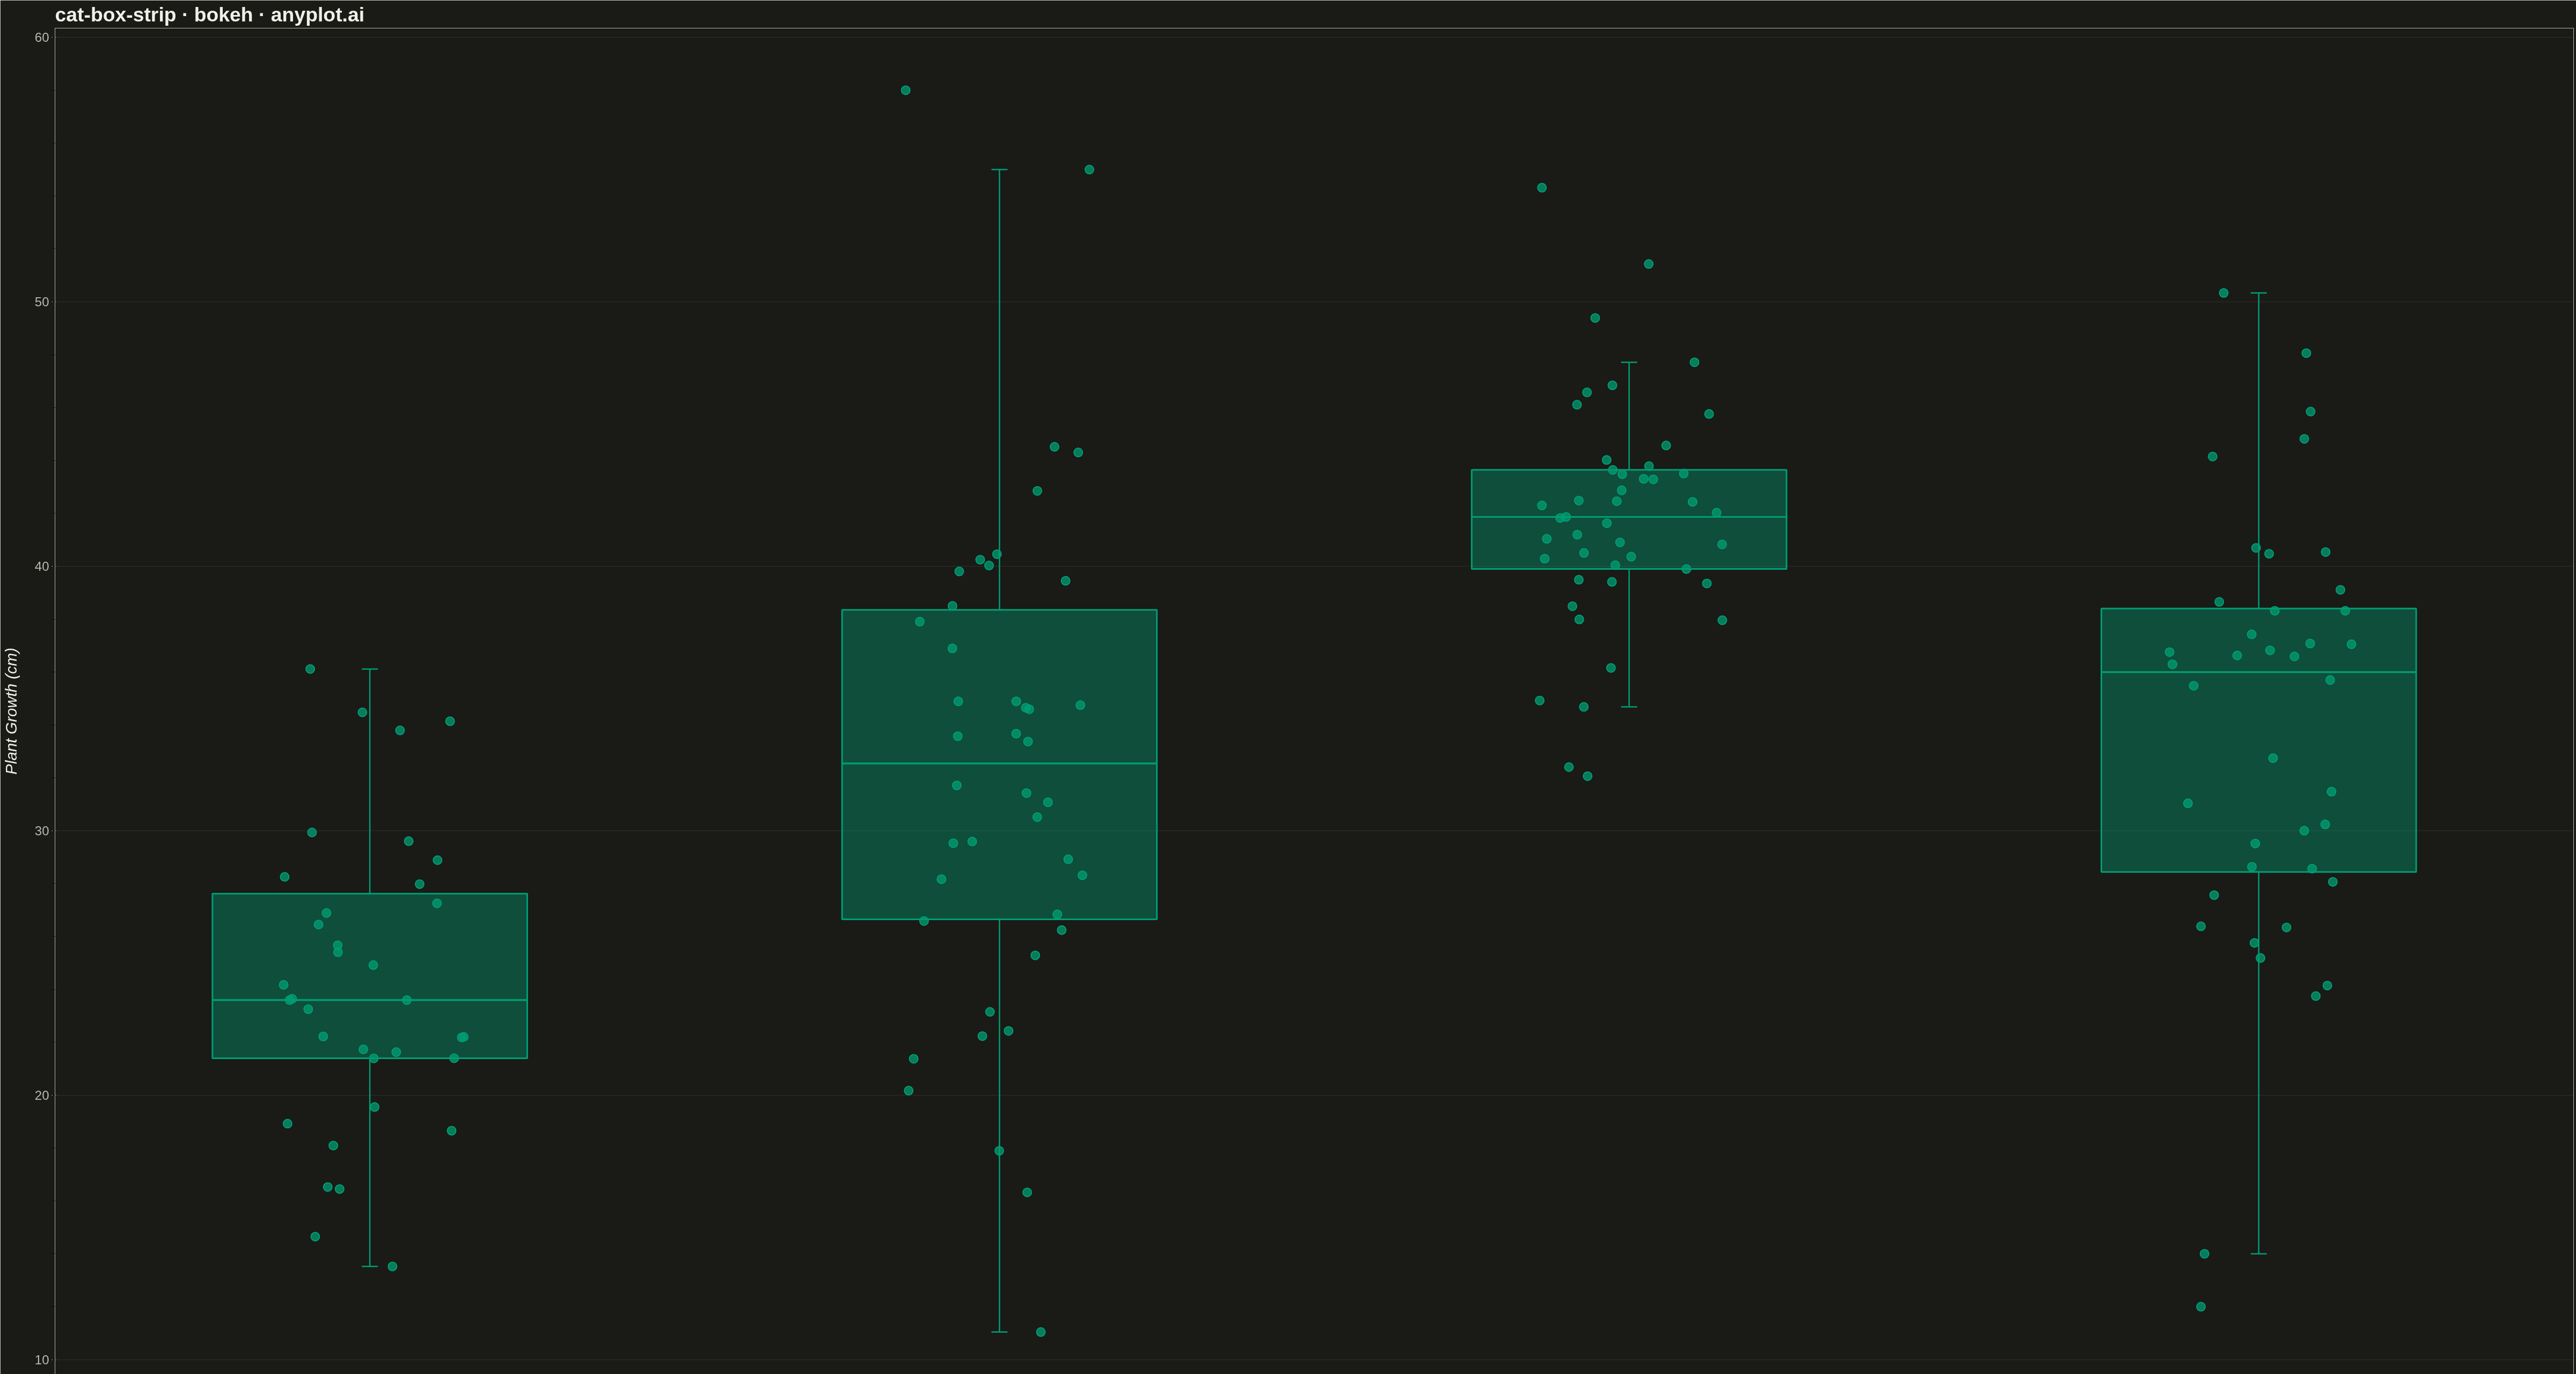
A combined visualization that overlays individual data points (strip plot) on top of a box plot. This provides both summary statistics (median, quartiles, whiskers) and visibility of the actual data distribution.
""" anyplot.ai
cat-box-strip: Box Plot with Strip Overlay
Library: bokeh 3.9.0 | Python 3.13.13
Quality: 82/100 | Updated: 2026-05-13
"""

import numpy as np
import pandas as pd
from bokeh.io import export_png, output_file, save
from bokeh.models import ColumnDataSource, Whisker
from bokeh.plotting import figure
from bokeh.transform import jitter


# Data - Plant growth measurements across different soil types
np.random.seed(42)

categories = ["Sandy", "Clay", "Loamy", "Silty"]
n_per_group = [35, 40, 45, 38]

# Generate data with different distributions per group
data = []
for cat, n in zip(categories, n_per_group, strict=True):
    if cat == "Sandy":
        values = np.random.normal(25, 6, n)  # Lower growth, moderate variance
    elif cat == "Clay":
        values = np.random.normal(32, 8, n)  # Medium growth, high variance
        values = np.append(values, [55, 58])  # Add outliers
    elif cat == "Loamy":
        values = np.random.normal(42, 5, n)  # High growth, low variance
    else:  # Silty
        values = np.random.normal(35, 7, n)  # Medium-high growth
        values = np.append(values, [12, 14])  # Add low outliers

    for v in values:
        data.append({"category": cat, "value": v})

df = pd.DataFrame(data)

# Calculate box plot statistics for each category
box_data = {"category": [], "q1": [], "q2": [], "q3": [], "upper": [], "lower": []}

for cat in categories:
    group = df[df["category"] == cat]["value"]
    q1 = group.quantile(0.25)
    q2 = group.quantile(0.50)
    q3 = group.quantile(0.75)
    iqr = q3 - q1
    upper_whisker = group[group <= q3 + 1.5 * iqr].max()
    lower_whisker = group[group >= q1 - 1.5 * iqr].min()

    box_data["category"].append(cat)
    box_data["q1"].append(q1)
    box_data["q2"].append(q2)
    box_data["q3"].append(q3)
    box_data["upper"].append(upper_whisker)
    box_data["lower"].append(lower_whisker)

box_source = ColumnDataSource(data=box_data)

# Create figure with categorical x-axis
p = figure(
    width=4800,
    height=2700,
    x_range=categories,
    title="cat-box-strip · bokeh · pyplots.ai",
    x_axis_label="Soil Type",
    y_axis_label="Plant Growth (cm)",
    tools="",
    toolbar_location=None,
)

# Styling - scaled for 4800x2700 canvas
p.title.text_font_size = "36pt"
p.xaxis.axis_label_text_font_size = "28pt"
p.yaxis.axis_label_text_font_size = "28pt"
p.xaxis.major_label_text_font_size = "24pt"
p.yaxis.major_label_text_font_size = "22pt"
p.xaxis.axis_label_standoff = 25
p.yaxis.axis_label_standoff = 25

# Grid styling
p.grid.grid_line_alpha = 0.3
p.grid.grid_line_dash = [6, 4]
p.xgrid.grid_line_color = None

# Background
p.background_fill_color = "#fafafa"

# Draw whiskers using the Whisker annotation
upper_whisker = Whisker(
    source=box_source, base="category", upper="upper", lower="q3", line_color="#306998", line_width=2.5
)
upper_whisker.upper_head.size = 30
upper_whisker.upper_head.line_color = "#306998"
upper_whisker.upper_head.line_width = 2.5
upper_whisker.lower_head.size = 0
p.add_layout(upper_whisker)

lower_whisker = Whisker(
    source=box_source, base="category", upper="q1", lower="lower", line_color="#306998", line_width=2.5
)
lower_whisker.lower_head.size = 30
lower_whisker.lower_head.line_color = "#306998"
lower_whisker.lower_head.line_width = 2.5
lower_whisker.upper_head.size = 0
p.add_layout(lower_whisker)

# Draw boxes (IQR range) - upper half
p.vbar(
    x="category",
    top="q3",
    bottom="q2",
    width=0.5,
    source=box_source,
    fill_color="#306998",
    fill_alpha=0.4,
    line_color="#306998",
    line_width=3,
)

# Draw boxes (IQR range) - lower half
p.vbar(
    x="category",
    top="q2",
    bottom="q1",
    width=0.5,
    source=box_source,
    fill_color="#306998",
    fill_alpha=0.4,
    line_color="#306998",
    line_width=3,
)

# Median line (horizontal segment across the box)
p.segment(x0="category", x1="category", y0="q2", y1="q2", source=box_source, line_color="#1a3d5c", line_width=4)

# Strip plot overlay with jitter
strip_source = ColumnDataSource(data={"category": df["category"], "value": df["value"]})

p.scatter(
    x=jitter("category", width=0.3, range=p.x_range),
    y="value",
    source=strip_source,
    size=16,
    fill_color="#FFD43B",
    fill_alpha=0.75,
    line_color="#b8860b",
    line_width=2,
)

# Save PNG
export_png(p, filename="plot.png")

# Save HTML for interactive version
output_file("plot.html")
save(p)
Runnable source as JSON, for any HTTP client: https://api.anyplot.ai/specs/cat-box-strip/bokeh/code. Any spec id and library id listed in llms-full.txt fit the same URL shape; every URL below is complete and callable.
{
  "spec_id": "cat-box-strip",
  "language": "python",
  "library": "bokeh",
  "page": "https://anyplot.ai/cat-box-strip/python/bokeh",
  "hub": "https://anyplot.ai/cat-box-strip",
  "code_json": "https://api.anyplot.ai/specs/cat-box-strip/bokeh/code",
  "spec_json": "https://api.anyplot.ai/specs/cat-box-strip",
  "render_light_png": "https://storage.googleapis.com/anyplot-images/plots/cat-box-strip/python/bokeh/plot-light.png",
  "render_dark_png": "https://storage.googleapis.com/anyplot-images/plots/cat-box-strip/python/bokeh/plot-dark.png",
  "interactive_light_html": "https://storage.googleapis.com/anyplot-images/plots/cat-box-strip/python/bokeh/plot-light.html",
  "interactive_dark_html": "https://storage.googleapis.com/anyplot-images/plots/cat-box-strip/python/bokeh/plot-dark.html",
  "quality_score": 82.0,
  "license": "MIT",
  "guide": "https://anyplot.ai/llms.txt"
}
Part of Box Plot with Strip Overlay on anyplot.ai.