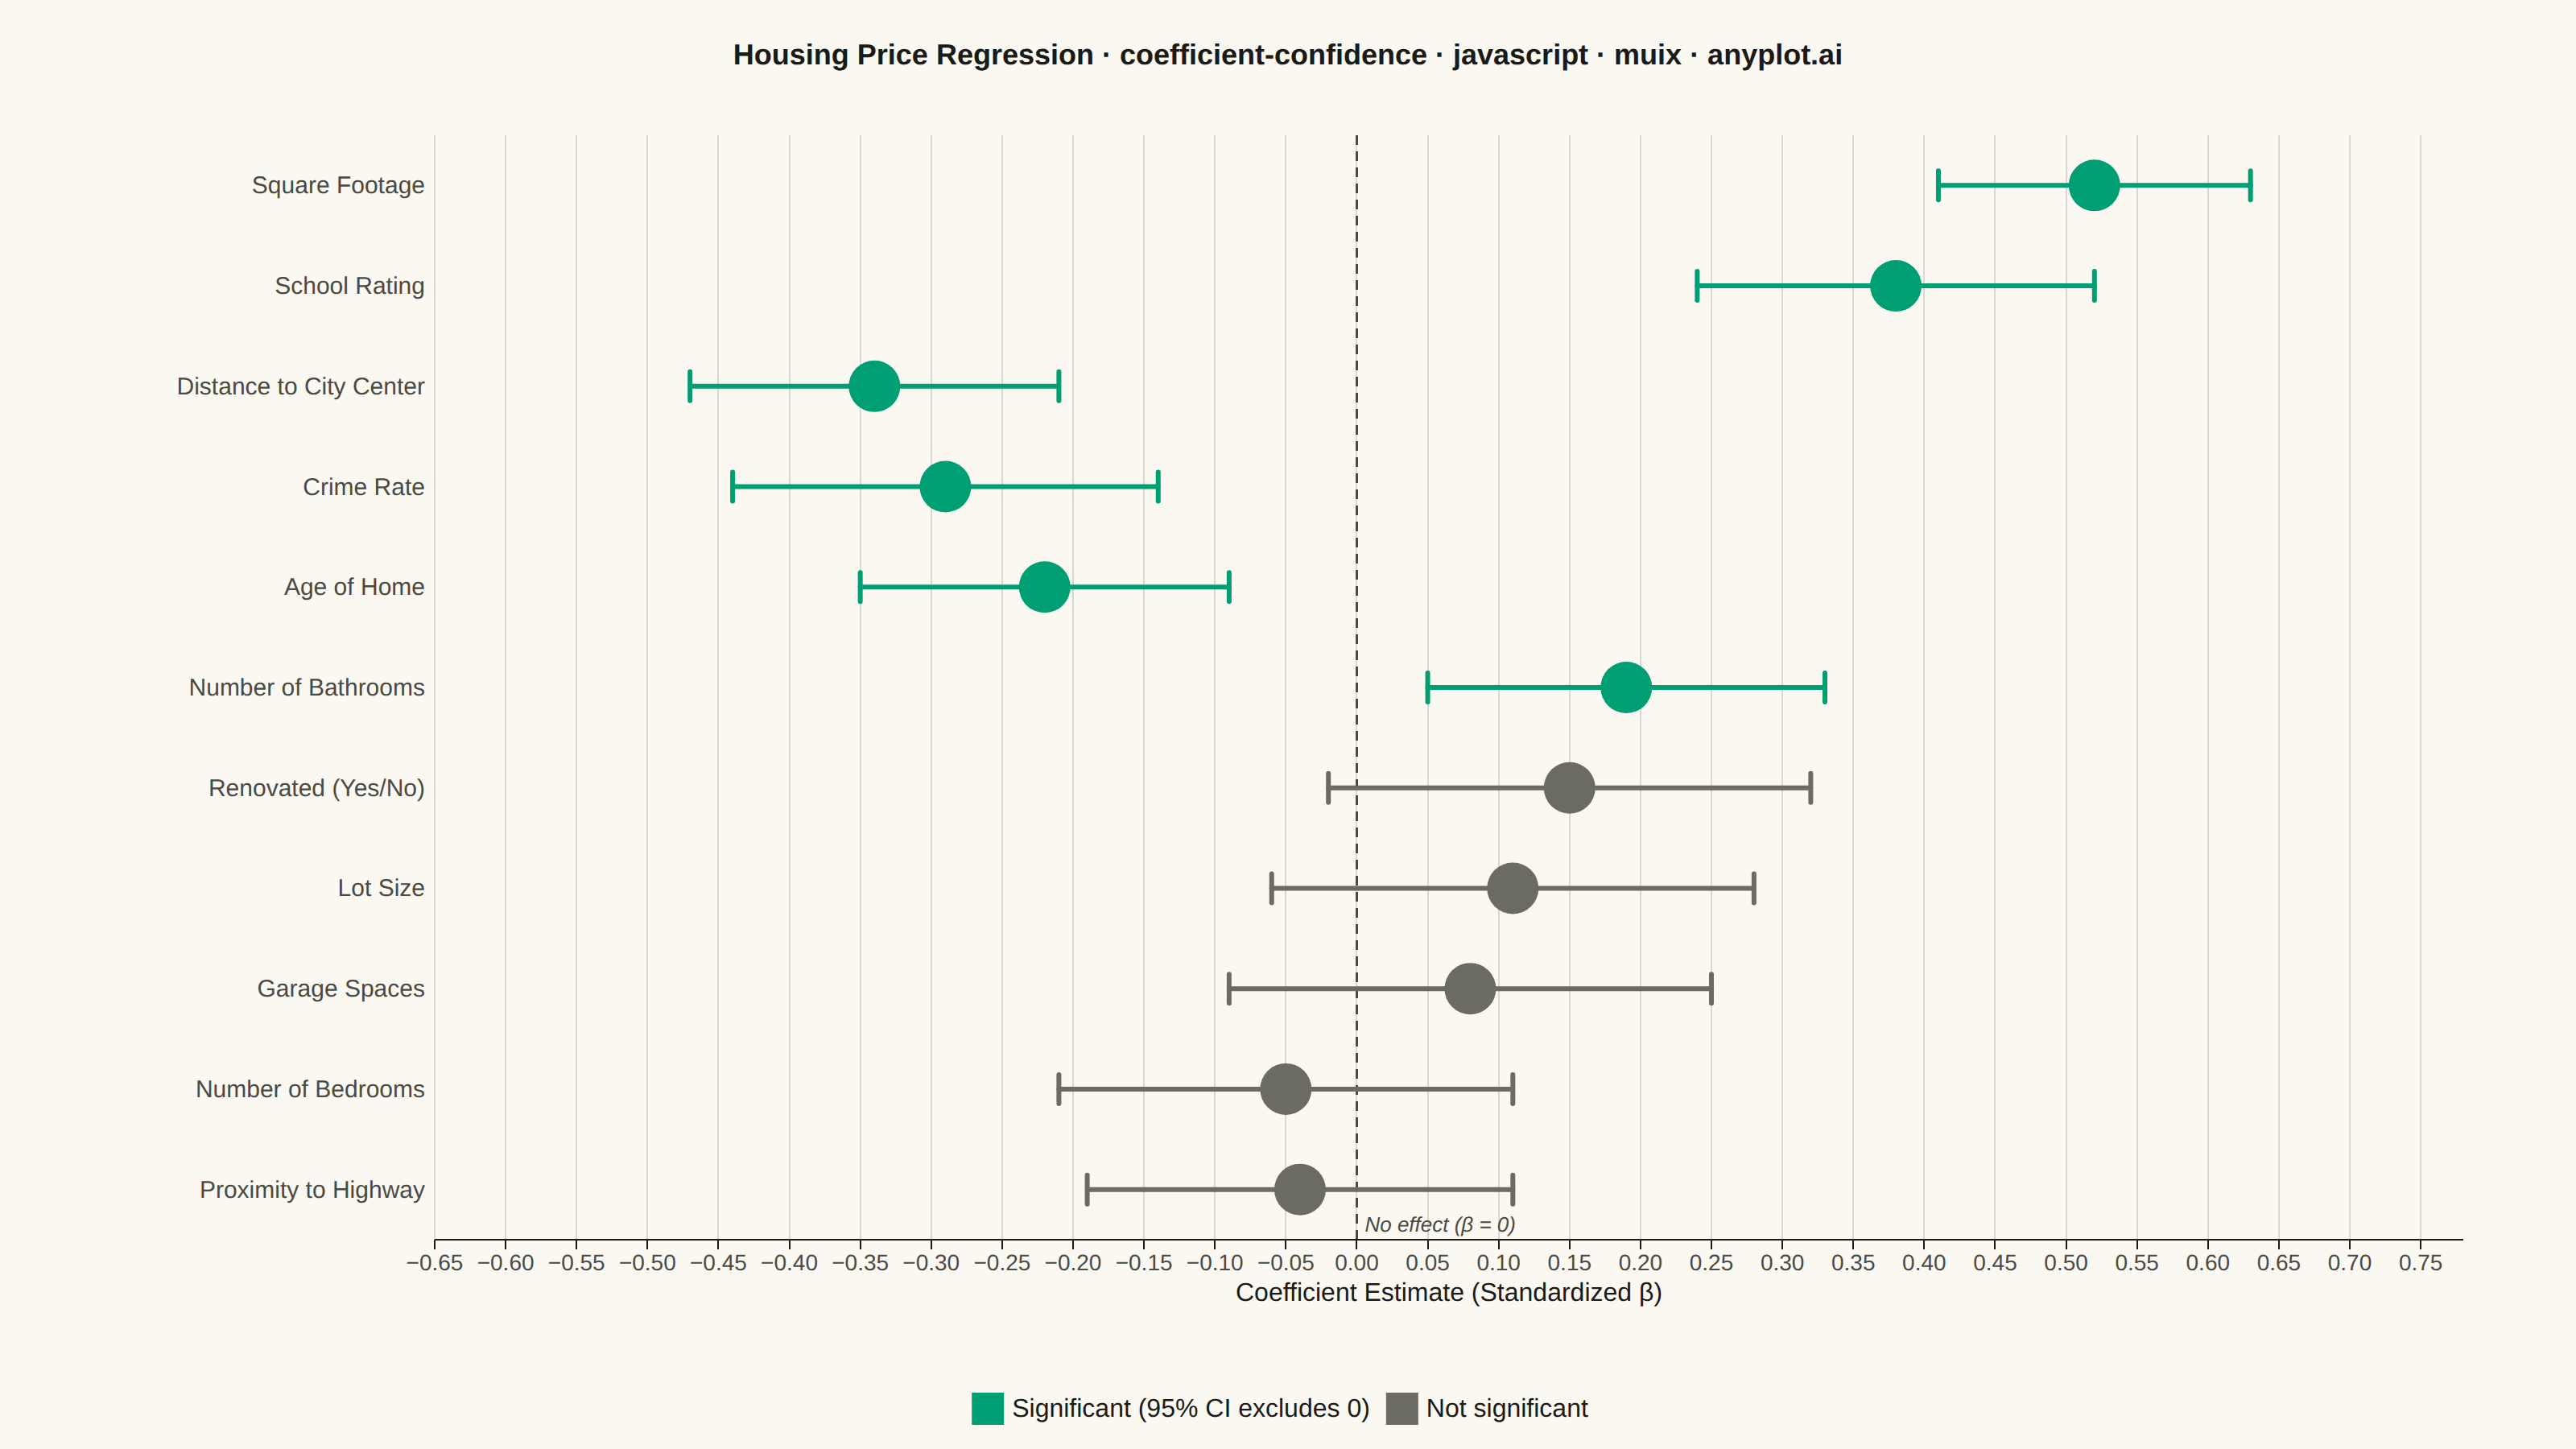
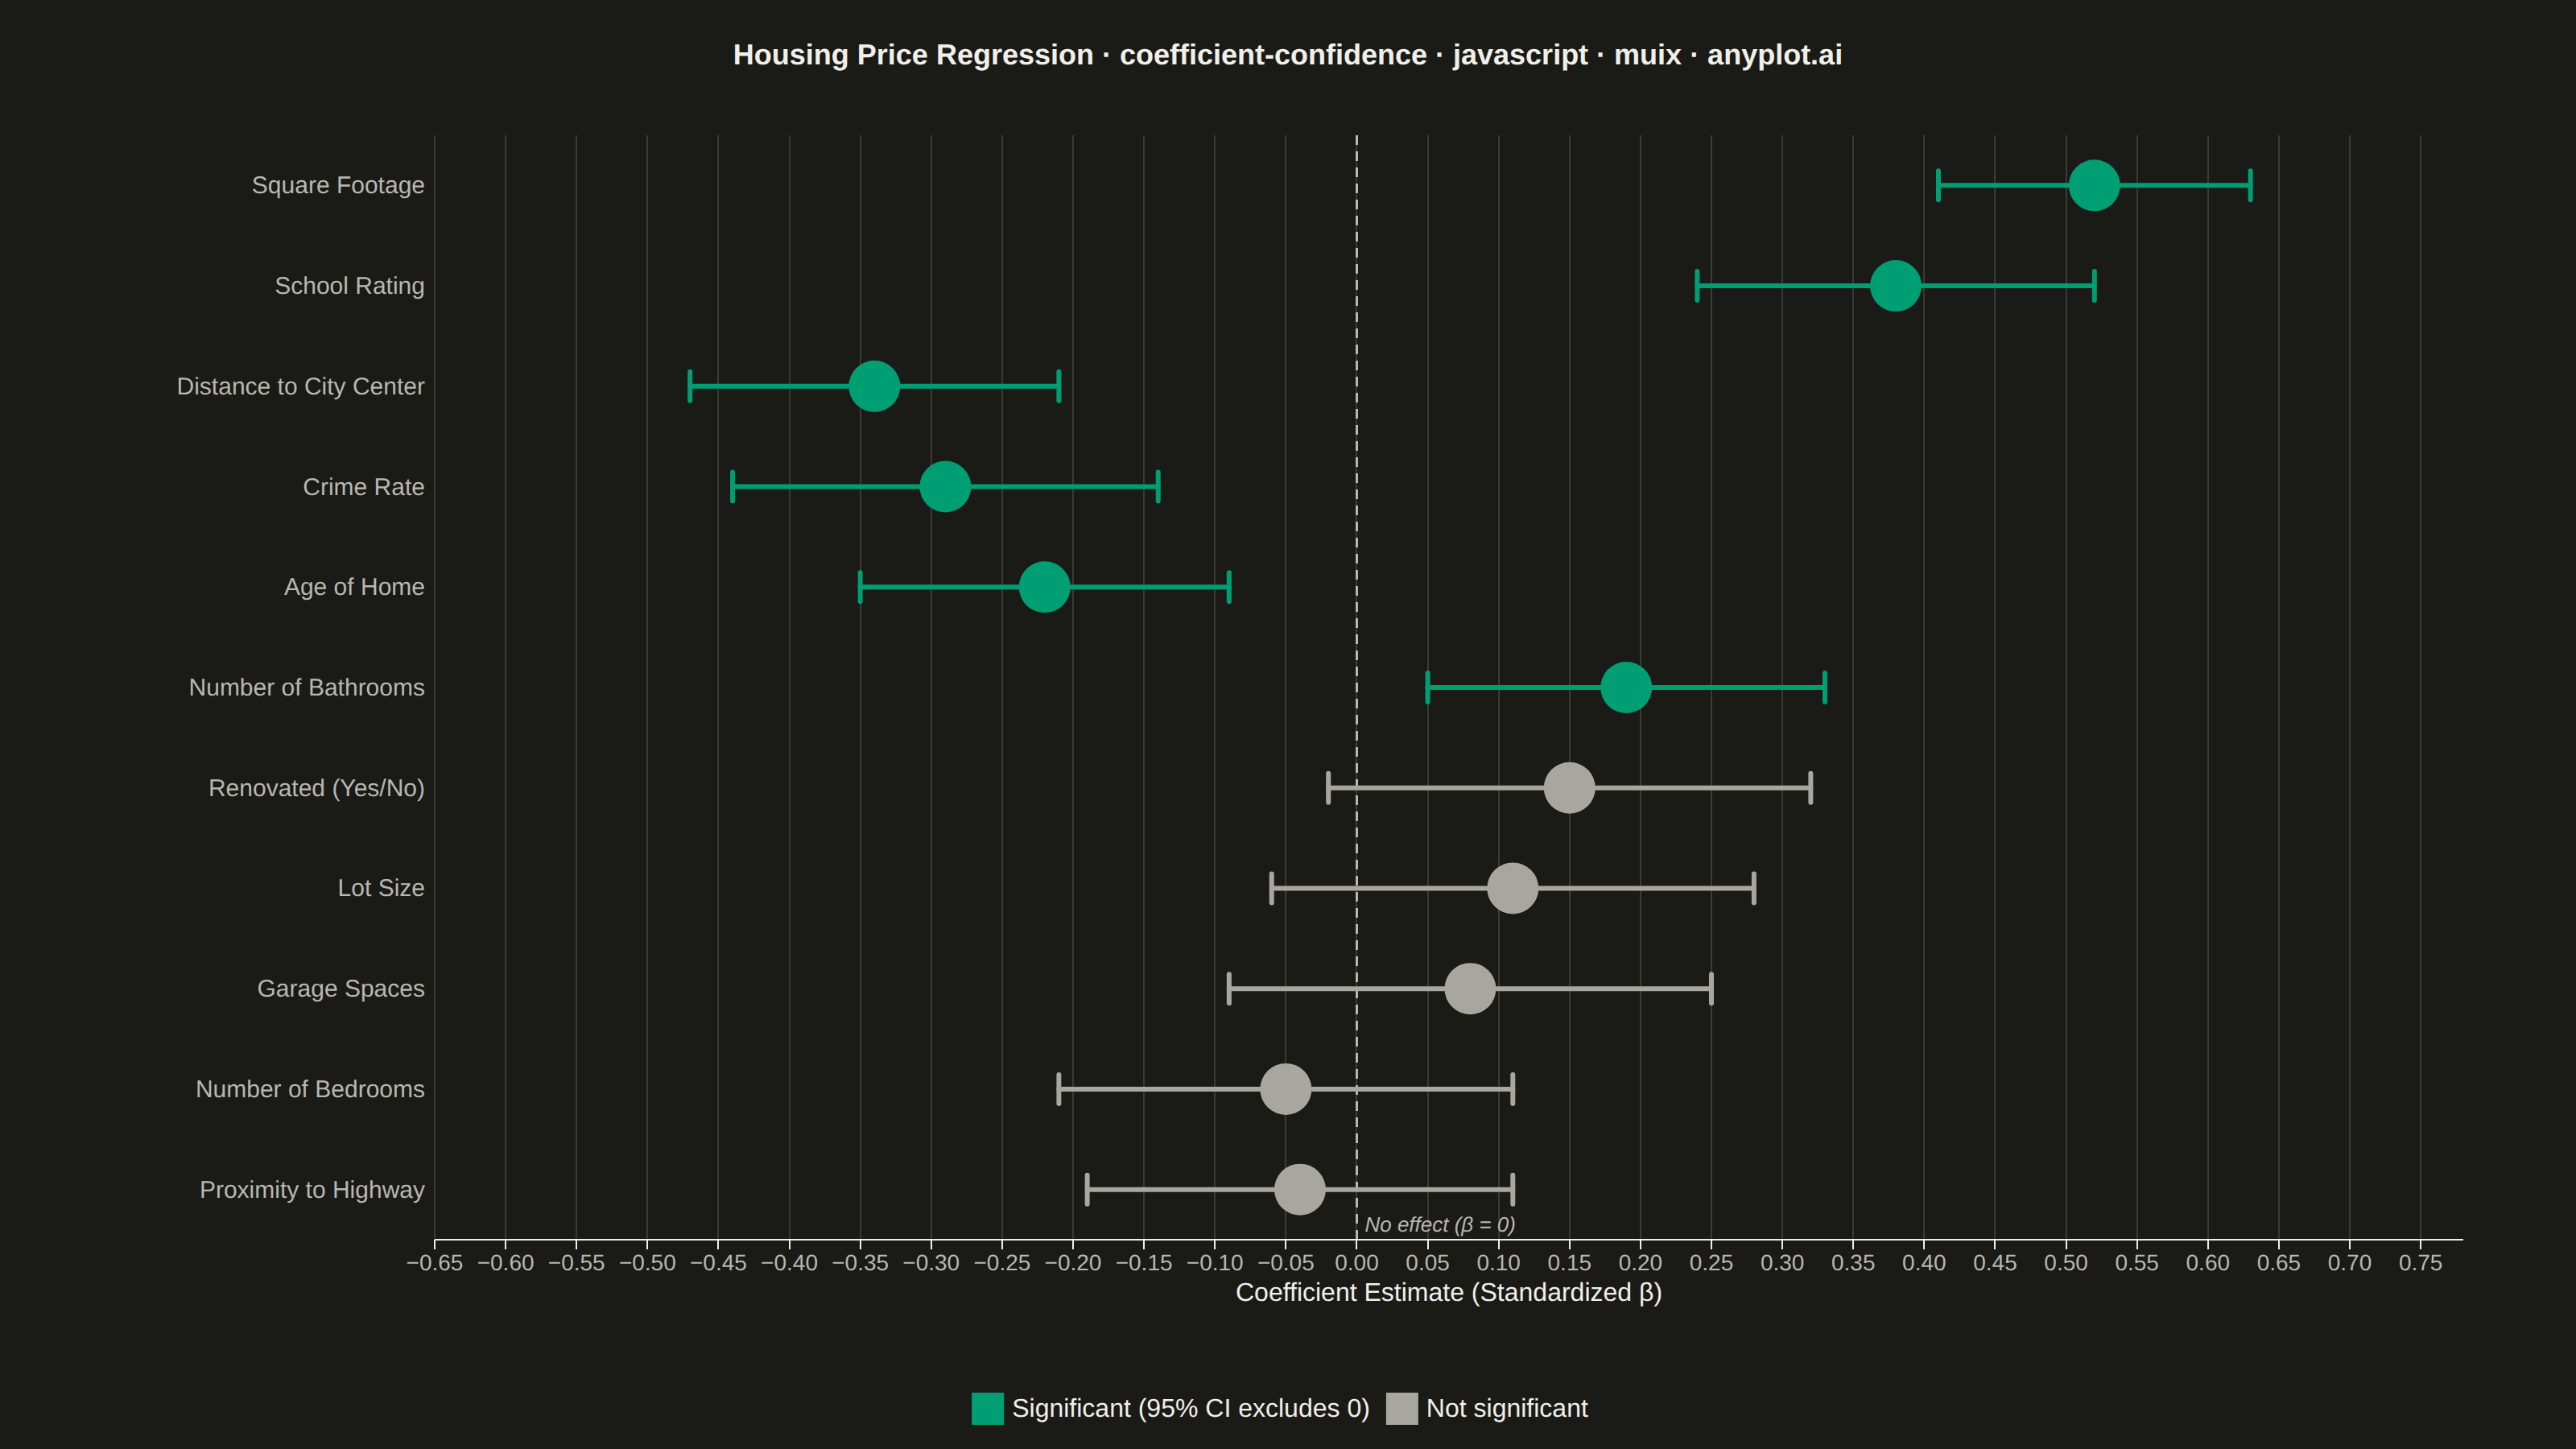
A coefficient plot displays regression coefficients as points positioned along a horizontal axis, with horizontal error bars showing confidence intervals. This visualization makes it easy to assess effect sizes and statistical significance - coefficients whose confidence intervals cross zero are not statistically significant. Typically used to summarize results from linear, logistic, or other regression models in a clear, publication-ready format.
Preview render from the MUI X Charts implementation.