The same plot in 14 other libraries — JavaScript: Chart.js, Apache ECharts, Highcharts, MUI X Charts; Python: Altair, Bokeh, lets-plot, Matplotlib, Plotly, plotnine, Pygal, Seaborn; R: ggplot2; Julia: Makie.jl. Compare all 15 side by side: Coefficient Plot with Confidence Intervals in Python, R, Julia and JavaScript.
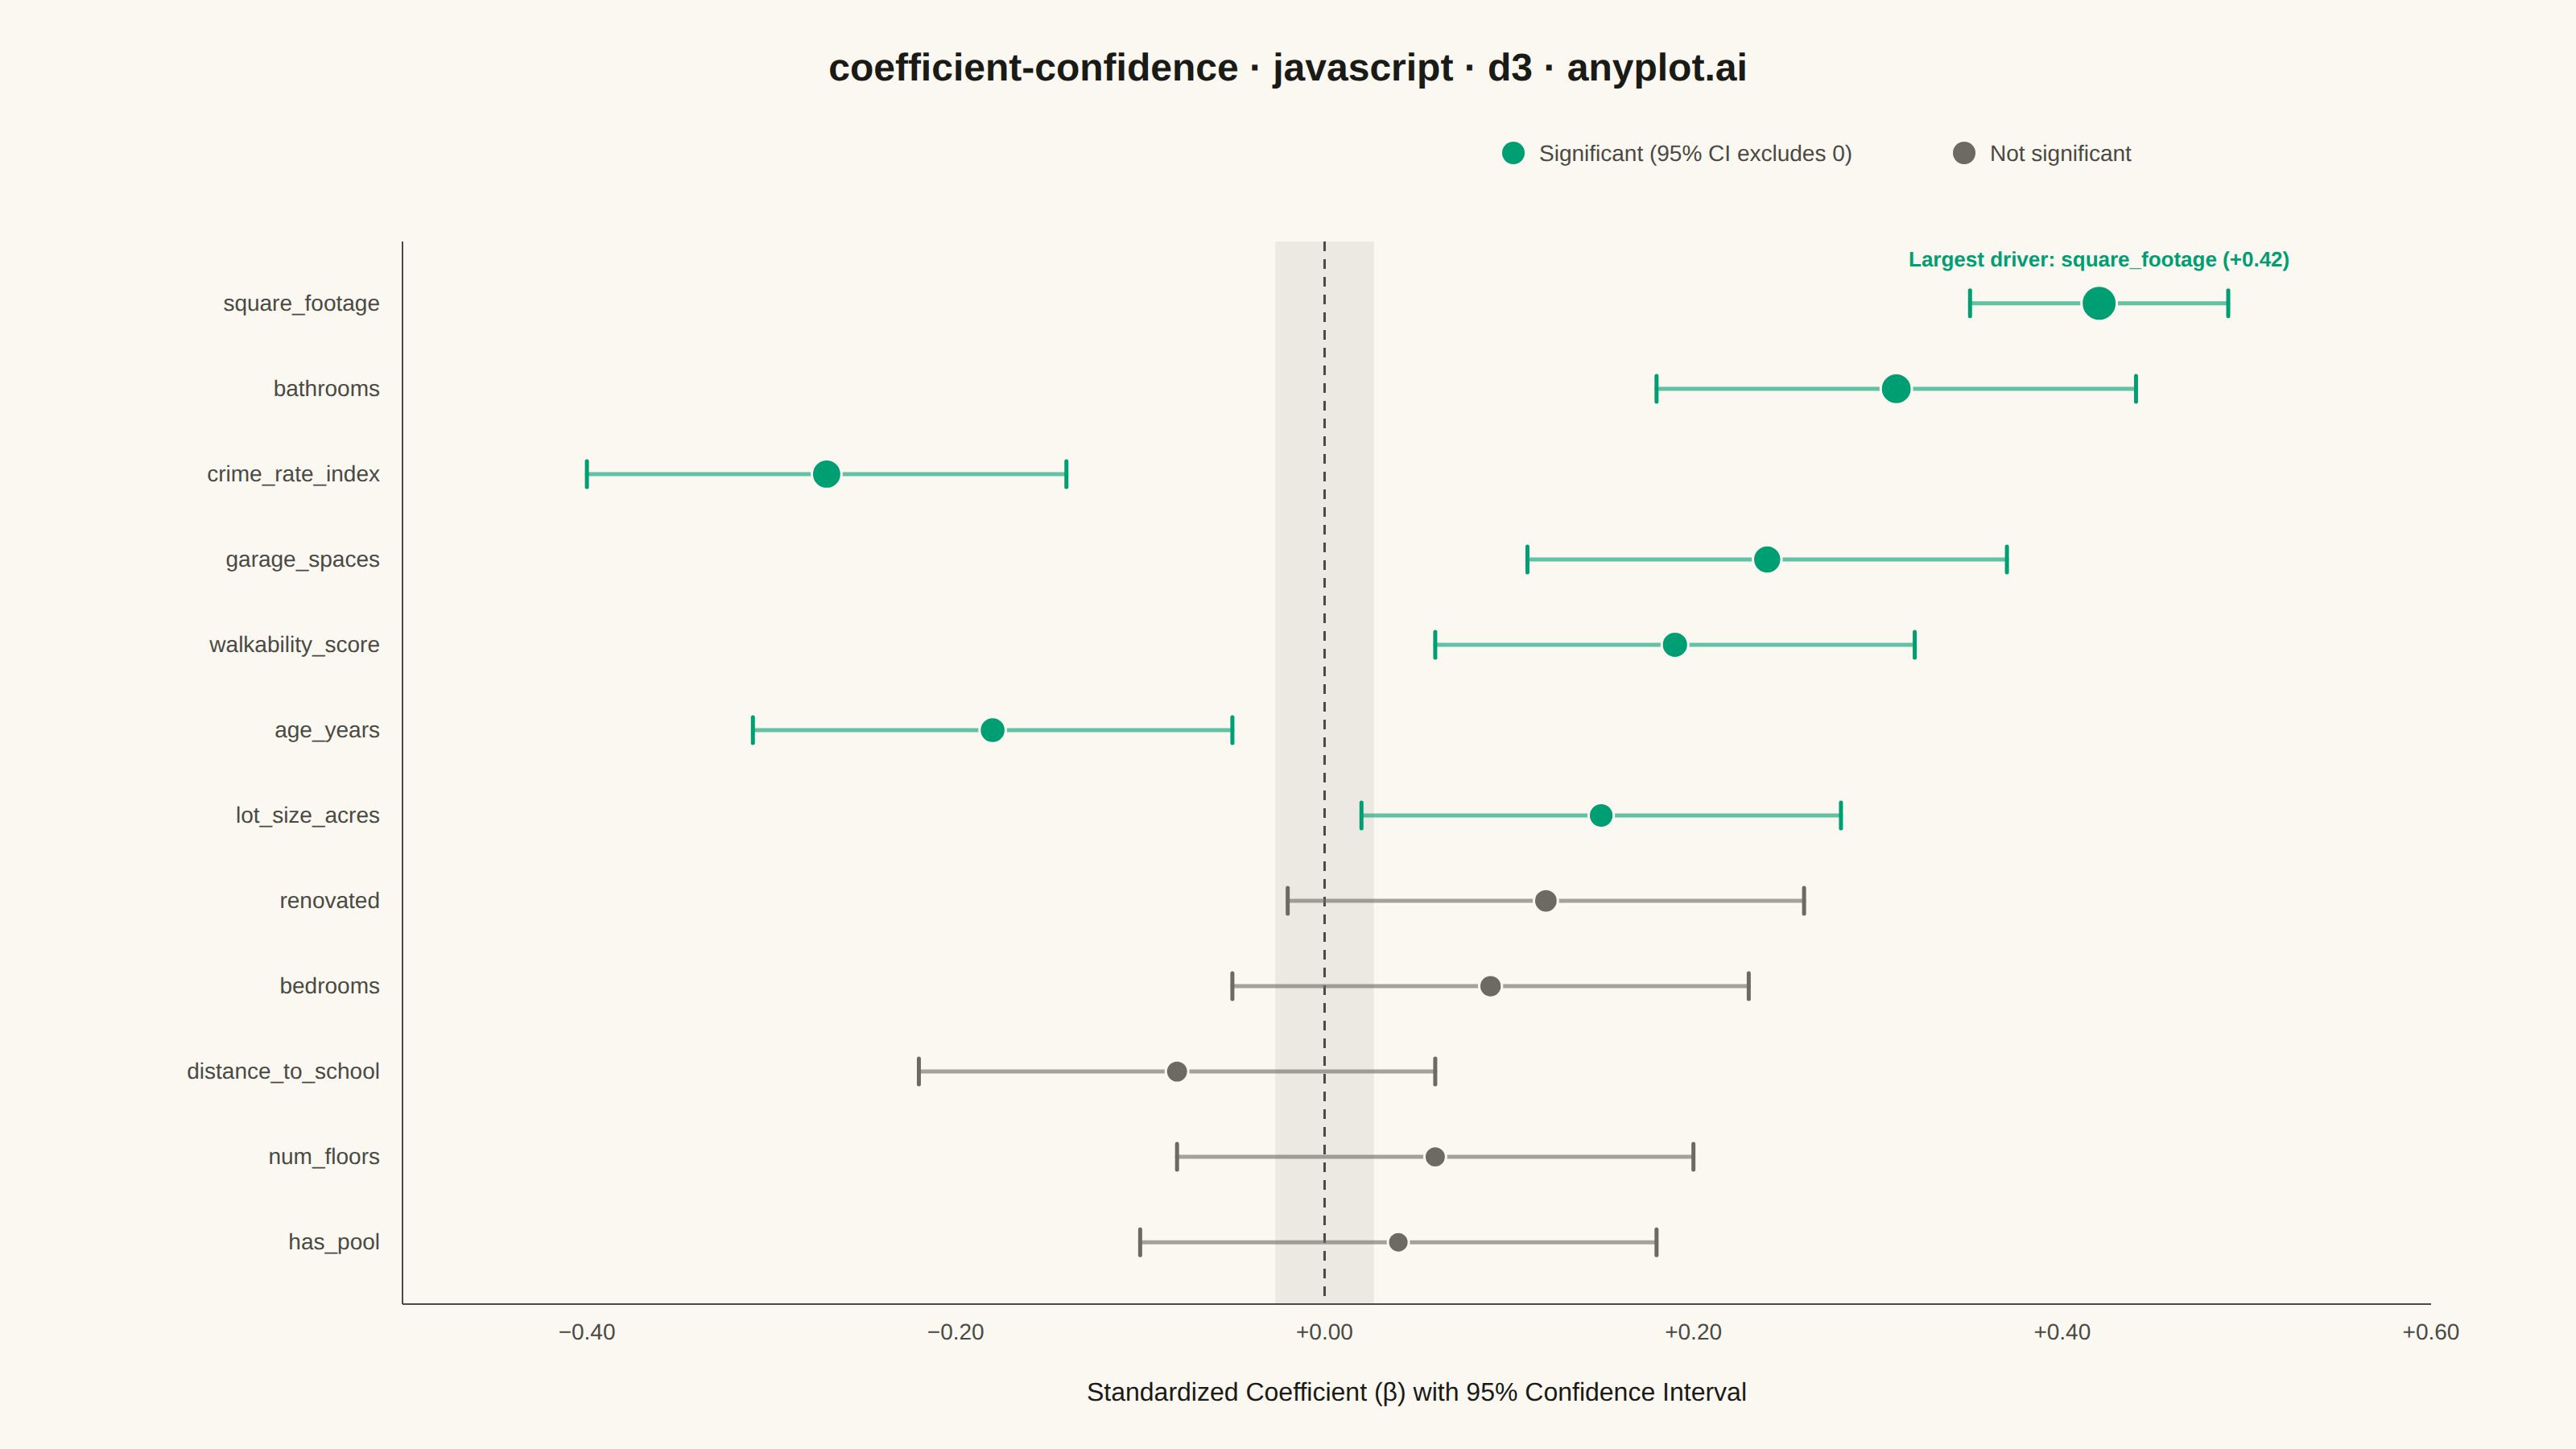
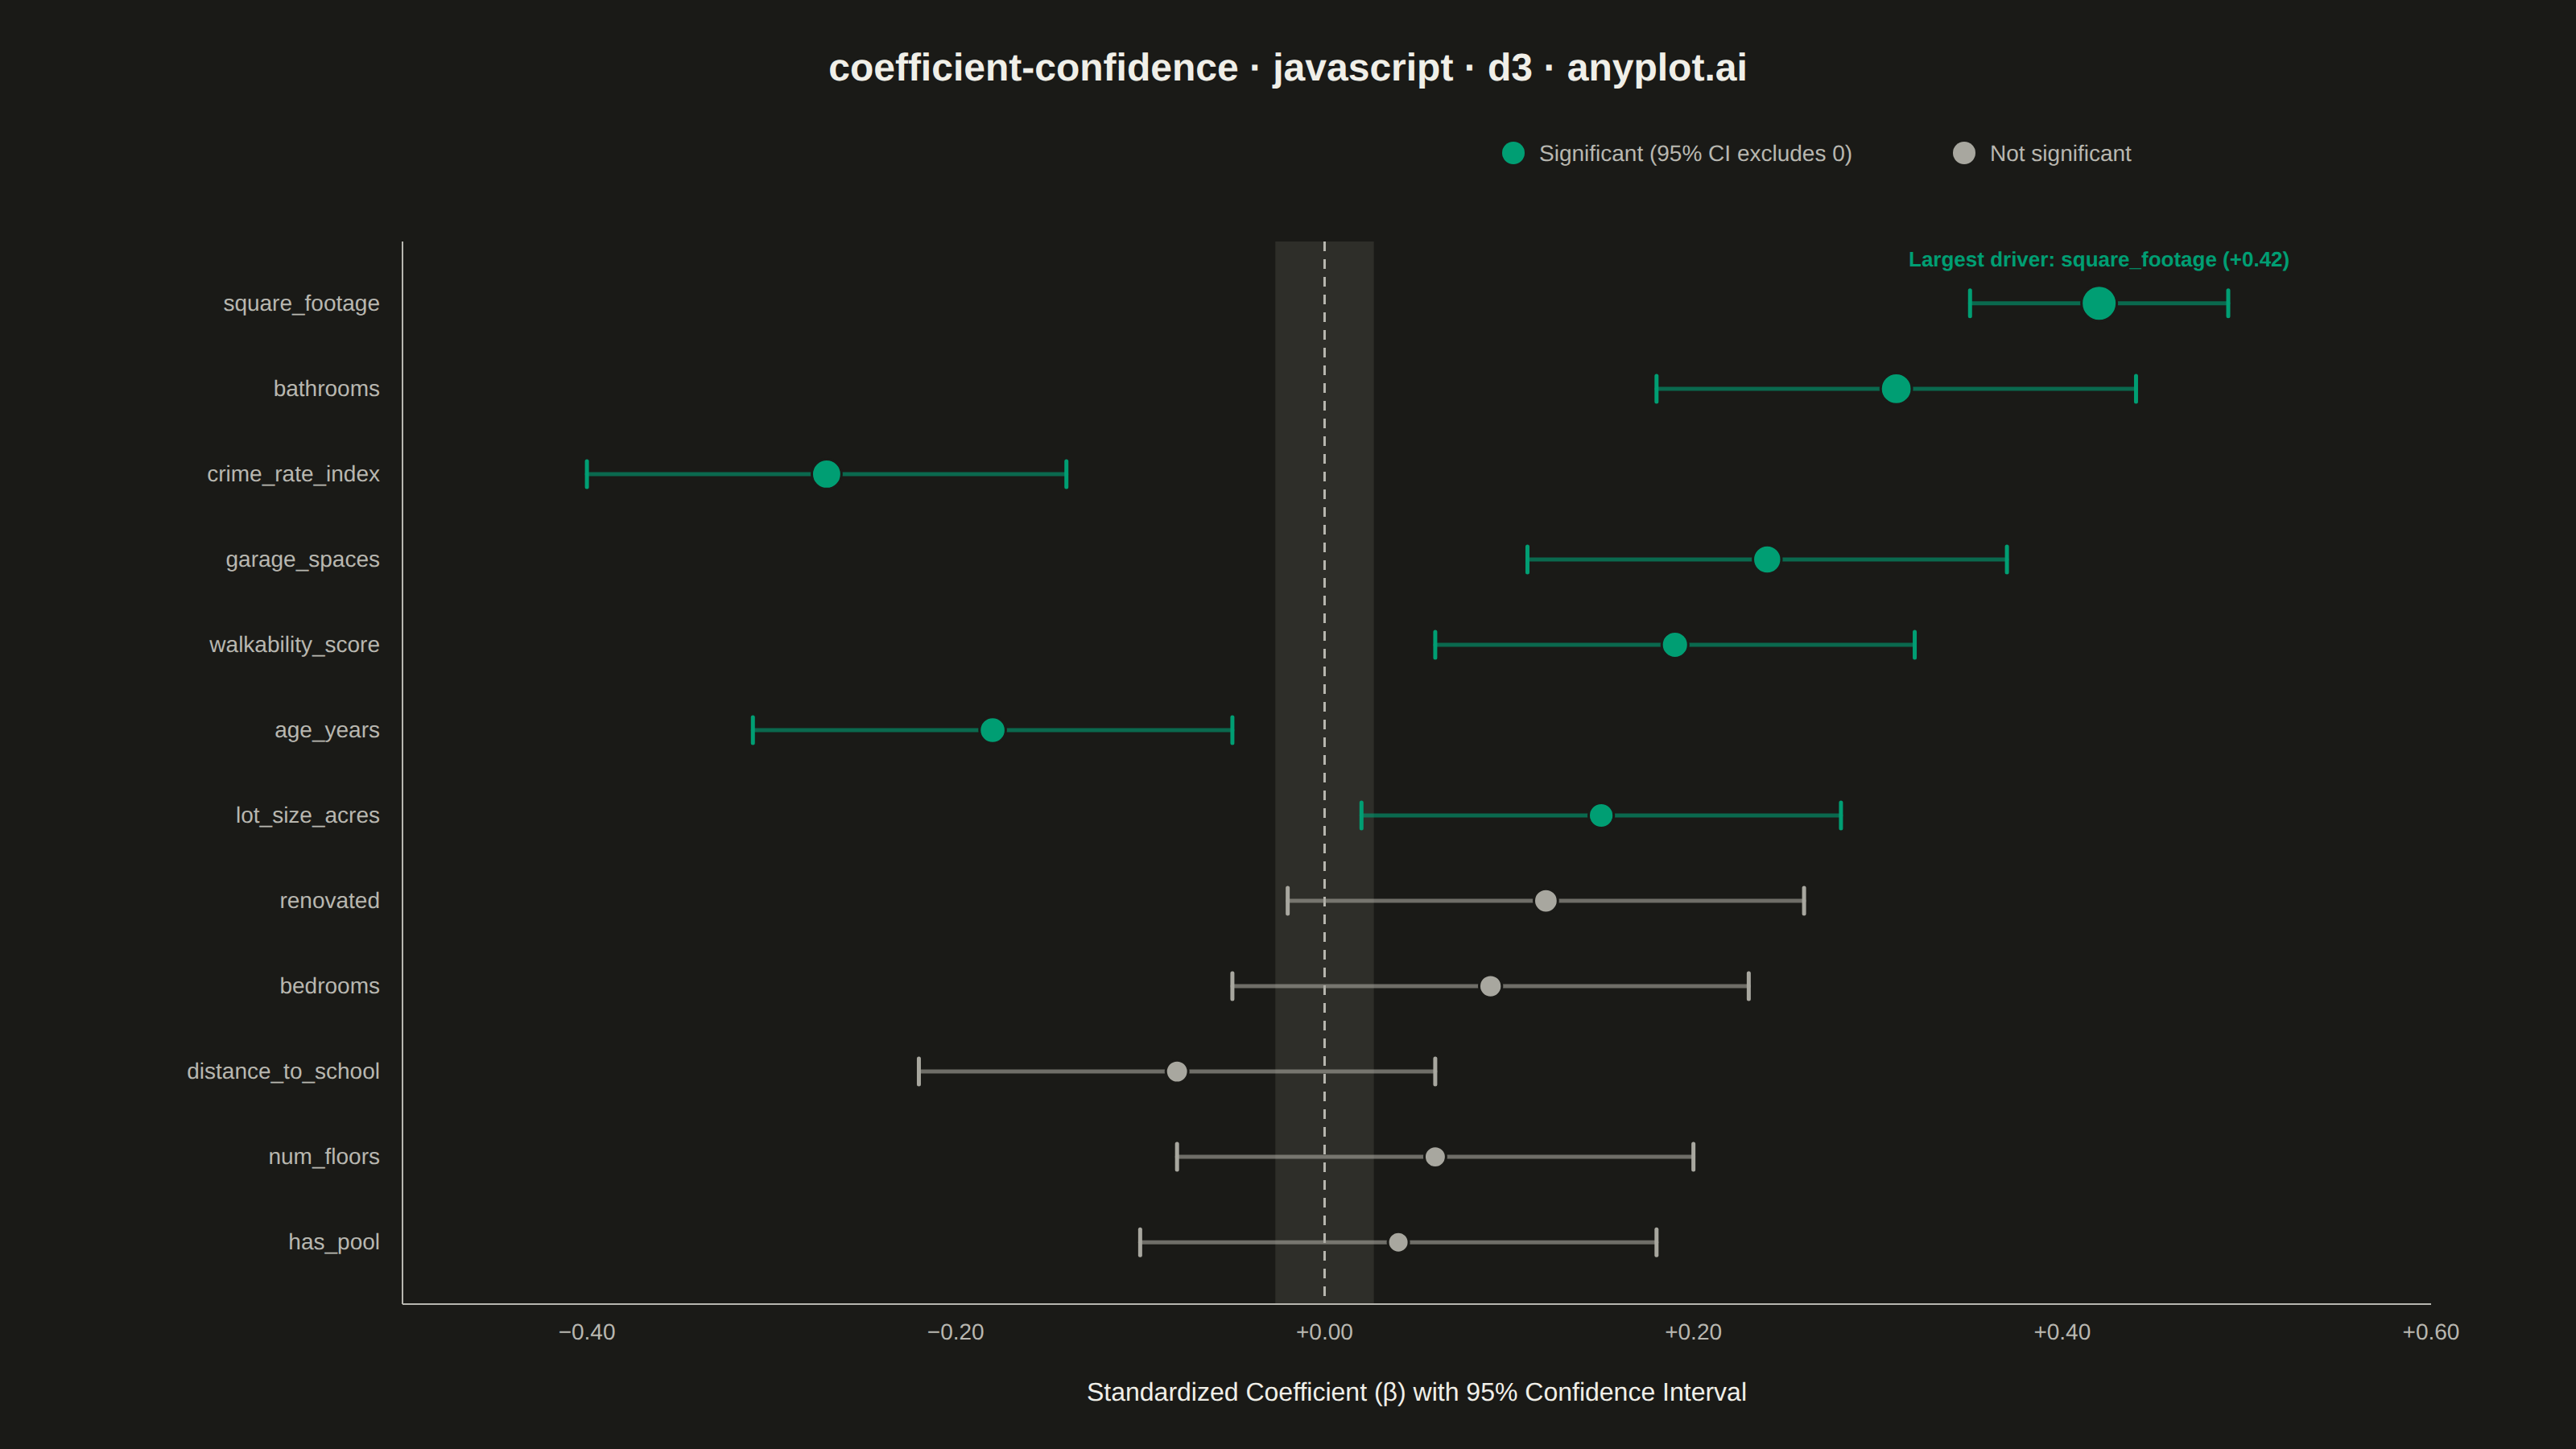
A coefficient plot displays regression coefficients as points positioned along a horizontal axis, with horizontal error bars showing confidence intervals. This visualization makes it easy to assess effect sizes and statistical significance - coefficients whose confidence intervals cross zero are not statistically significant. Typically used to summarize results from linear, logistic, or other regression models in a clear, publication-ready format.
// anyplot.ai
// coefficient-confidence: Coefficient Plot with Confidence Intervals
// Library: d3 7.9.0 | JavaScript 22.23.2
// Quality: 91/100 | Created: 2026-09-01

const t = window.ANYPLOT_TOKENS;
const isLight = window.ANYPLOT_THEME !== "dark";
const muted = isLight ? "#6B6A63" : "#A8A79F"; // theme-adaptive "other/rest" anchor
const { width, height } = window.ANYPLOT_SIZE;

// --- Data: standardized coefficients from a linear regression predicting ---
// --- house sale price, ordered by |coefficient| descending -----------------
const data = [
  { variable: "square_footage", coefficient: 0.42, ciLower: 0.35, ciUpper: 0.49, significant: true },
  { variable: "bathrooms", coefficient: 0.31, ciLower: 0.18, ciUpper: 0.44, significant: true },
  { variable: "crime_rate_index", coefficient: -0.27, ciLower: -0.4, ciUpper: -0.14, significant: true },
  { variable: "garage_spaces", coefficient: 0.24, ciLower: 0.11, ciUpper: 0.37, significant: true },
  { variable: "walkability_score", coefficient: 0.19, ciLower: 0.06, ciUpper: 0.32, significant: true },
  { variable: "age_years", coefficient: -0.18, ciLower: -0.31, ciUpper: -0.05, significant: true },
  { variable: "lot_size_acres", coefficient: 0.15, ciLower: 0.02, ciUpper: 0.28, significant: true },
  { variable: "renovated", coefficient: 0.12, ciLower: -0.02, ciUpper: 0.26, significant: false },
  { variable: "bedrooms", coefficient: 0.09, ciLower: -0.05, ciUpper: 0.23, significant: false },
  { variable: "distance_to_school", coefficient: -0.08, ciLower: -0.22, ciUpper: 0.06, significant: false },
  { variable: "num_floors", coefficient: 0.06, ciLower: -0.08, ciUpper: 0.2, significant: false },
  { variable: "has_pool", coefficient: 0.04, ciLower: -0.1, ciUpper: 0.18, significant: false },
];

// --- SVG mount ---------------------------------------------------------------
const svg = d3.select("#container").append("svg").attr("width", width).attr("height", height);

const margin = { top: 150, right: 90, bottom: 90, left: 250 };
const iw = width - margin.left - margin.right;
const ih = height - margin.top - margin.bottom;
const g = svg.append("g").attr("transform", `translate(${margin.left},${margin.top})`);

// --- Scales -------------------------------------------------------------------
const xMin = d3.min(data, (d) => d.ciLower);
const xMax = d3.max(data, (d) => d.ciUpper);
const xPad = (xMax - xMin) * 0.1;
const x = d3.scaleLinear().domain([xMin - xPad, xMax + xPad]).nice().range([0, iw]);
const y = d3.scaleBand().domain(data.map((d) => d.variable)).range([0, ih]).padding(0.45);
// Marker radius scales with |coefficient|, giving the strongest effects visual weight.
const r = d3.scaleLinear().domain(d3.extent(data, (d) => Math.abs(d.coefficient))).range([6.5, 11]);

// --- "Practically negligible" zone band around zero -----------------------------
const negligible = (xMax - xMin) * 0.03;
g.append("rect")
  .attr("x", x(-negligible)).attr("width", x(negligible) - x(-negligible))
  .attr("y", 0).attr("height", ih)
  .attr("fill", muted).attr("opacity", isLight ? 0.1 : 0.14);

// --- Zero reference line -------------------------------------------------------
g.append("line")
  .attr("x1", x(0)).attr("x2", x(0))
  .attr("y1", 0).attr("y2", ih)
  .attr("stroke", t.inkSoft)
  .attr("stroke-width", 1.5)
  .attr("stroke-dasharray", "6,5");

// --- Error bars (CI) + point estimates -----------------------------------------
const rows = g.selectAll(".coef-row").data(data).join("g").attr("class", "coef-row");
const capHalf = 8;

rows.append("line")
  .attr("x1", (d) => x(d.ciLower)).attr("x2", (d) => x(d.ciUpper))
  .attr("y1", (d) => y(d.variable) + y.bandwidth() / 2)
  .attr("y2", (d) => y(d.variable) + y.bandwidth() / 2)
  .attr("stroke", (d) => (d.significant ? t.palette[0] : muted))
  .attr("stroke-width", 2.5)
  .attr("stroke-linecap", "round")
  .attr("opacity", 0.6);

for (const bound of ["ciLower", "ciUpper"]) {
  rows.append("line")
    .attr("x1", (d) => x(d[bound])).attr("x2", (d) => x(d[bound]))
    .attr("y1", (d) => y(d.variable) + y.bandwidth() / 2 - capHalf)
    .attr("y2", (d) => y(d.variable) + y.bandwidth() / 2 + capHalf)
    .attr("stroke", (d) => (d.significant ? t.palette[0] : muted))
    .attr("stroke-width", 2.5)
    .attr("stroke-linecap", "round");
}

rows.append("circle")
  .attr("cx", (d) => x(d.coefficient))
  .attr("cy", (d) => y(d.variable) + y.bandwidth() / 2)
  .attr("r", (d) => r(Math.abs(d.coefficient)))
  .attr("fill", (d) => (d.significant ? t.palette[0] : muted))
  .attr("stroke", t.pageBg)
  .attr("stroke-width", 1.5);

// --- Axes -----------------------------------------------------------------------
const xAxis = g.append("g")
  .attr("transform", `translate(0,${ih})`)
  .call(d3.axisBottom(x).ticks(7).tickFormat(d3.format("+.2f")).tickSize(0).tickPadding(12));
xAxis.selectAll("text").attr("fill", t.inkSoft).style("font-size", "14px");
xAxis.select(".domain").attr("stroke", t.inkSoft);

const yAxis = g.append("g").call(d3.axisLeft(y).tickSize(0).tickPadding(14));
yAxis.selectAll("text").attr("fill", t.inkSoft).style("font-size", "14px");
yAxis.select(".domain").attr("stroke", t.inkSoft);

// --- Axis label -------------------------------------------------------------------
svg.append("text")
  .attr("x", margin.left + iw / 2).attr("y", height - 30)
  .attr("text-anchor", "middle")
  .attr("fill", t.ink).style("font-size", "16px")
  .text("Standardized Coefficient (β) with 95% Confidence Interval");

// --- Title ----------------------------------------------------------------------
svg.append("text")
  .attr("x", width / 2).attr("y", 50)
  .attr("text-anchor", "middle")
  .attr("fill", t.ink).style("font-size", "24px").style("font-weight", "600")
  .text("coefficient-confidence · javascript · d3 · anyplot.ai");

// --- Legend (significant vs. not significant) ------------------------------------
const legend = svg.append("g").attr("transform", `translate(${width - 660},100)`);
const legendItems = [
  { label: "Significant (95% CI excludes 0)", color: t.palette[0] },
  { label: "Not significant", color: muted },
];
legendItems.forEach((item, i) => {
  const row = legend.append("g").attr("transform", `translate(${i * 280},0)`);
  row.append("circle").attr("r", 7).attr("cy", -5).attr("fill", item.color);
  row.append("text")
    .attr("x", 16).attr("y", 0)
    .attr("fill", t.inkSoft).style("font-size", "14px")
    .text(item.label);
});

// --- Callout: highlight the single largest driver --------------------------------
const top = data[0];
const topCy = y(top.variable) + y.bandwidth() / 2;
const topCx = x(top.coefficient);
g.append("text")
  .attr("x", topCx).attr("y", topCy - r(Math.abs(top.coefficient)) - 12)
  .attr("text-anchor", "middle")
  .attr("fill", t.palette[0]).style("font-size", "13px").style("font-weight", "600")
  .text(`Largest driver: ${top.variable} (+${top.coefficient.toFixed(2)})`);
Runnable source as JSON, for any HTTP client: https://api.anyplot.ai/specs/coefficient-confidence/d3/code. Any spec id and library id listed in llms-full.txt fit the same URL shape; every URL below is complete and callable.
{
  "spec_id": "coefficient-confidence",
  "language": "javascript",
  "library": "d3",
  "page": "https://anyplot.ai/coefficient-confidence/javascript/d3",
  "hub": "https://anyplot.ai/coefficient-confidence",
  "code_json": "https://api.anyplot.ai/specs/coefficient-confidence/d3/code",
  "spec_json": "https://api.anyplot.ai/specs/coefficient-confidence",
  "render_light_png": "https://storage.googleapis.com/anyplot-images/plots/coefficient-confidence/javascript/d3/plot-light.png",
  "render_dark_png": "https://storage.googleapis.com/anyplot-images/plots/coefficient-confidence/javascript/d3/plot-dark.png",
  "interactive_light_html": "https://storage.googleapis.com/anyplot-images/plots/coefficient-confidence/javascript/d3/plot-light.html",
  "interactive_dark_html": "https://storage.googleapis.com/anyplot-images/plots/coefficient-confidence/javascript/d3/plot-dark.html",
  "quality_score": 91.0,
  "license": "MIT",
  "guide": "https://anyplot.ai/llms.txt"
}
Part of Coefficient Plot with Confidence Intervals on anyplot.ai.