The same plot in 14 other libraries — JavaScript: Chart.js, D3.js, Apache ECharts, Highcharts; Python: Altair, Bokeh, lets-plot, Matplotlib, Plotly, plotnine, Pygal, Seaborn; R: ggplot2; Julia: Makie.jl. Compare all 15 side by side: Coefficient Plot with Confidence Intervals in Python, R, Julia and JavaScript.
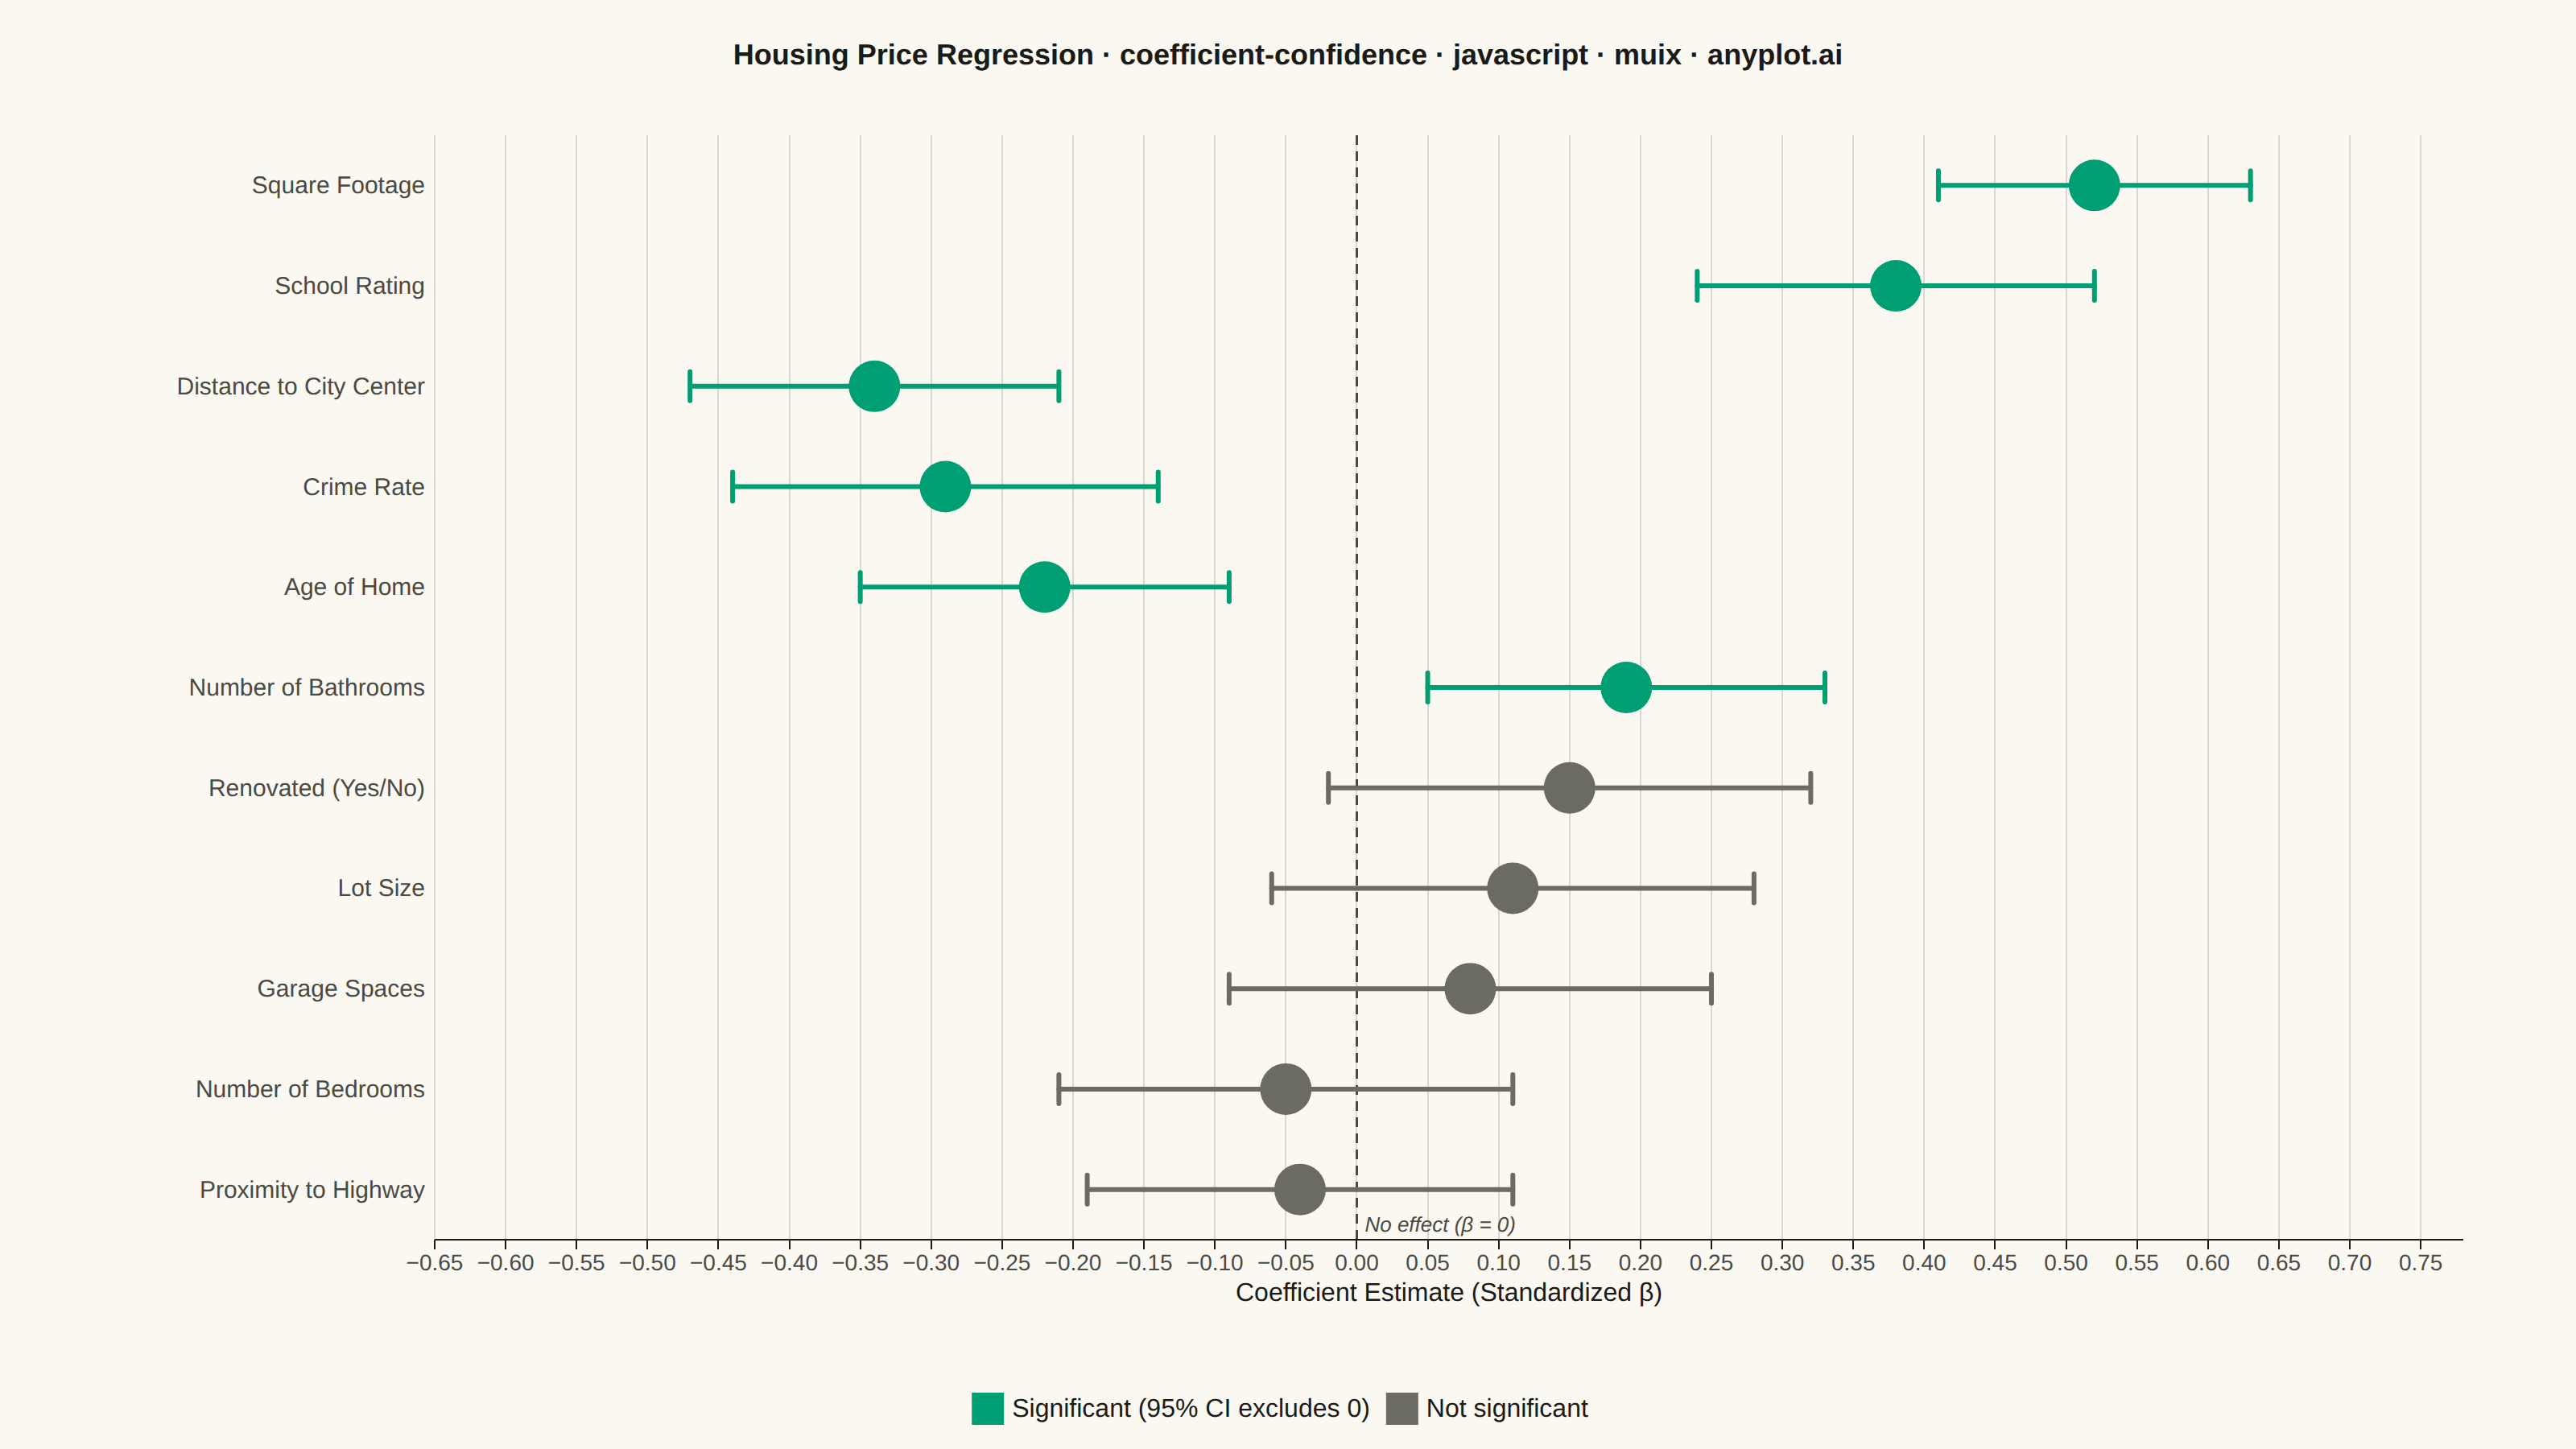
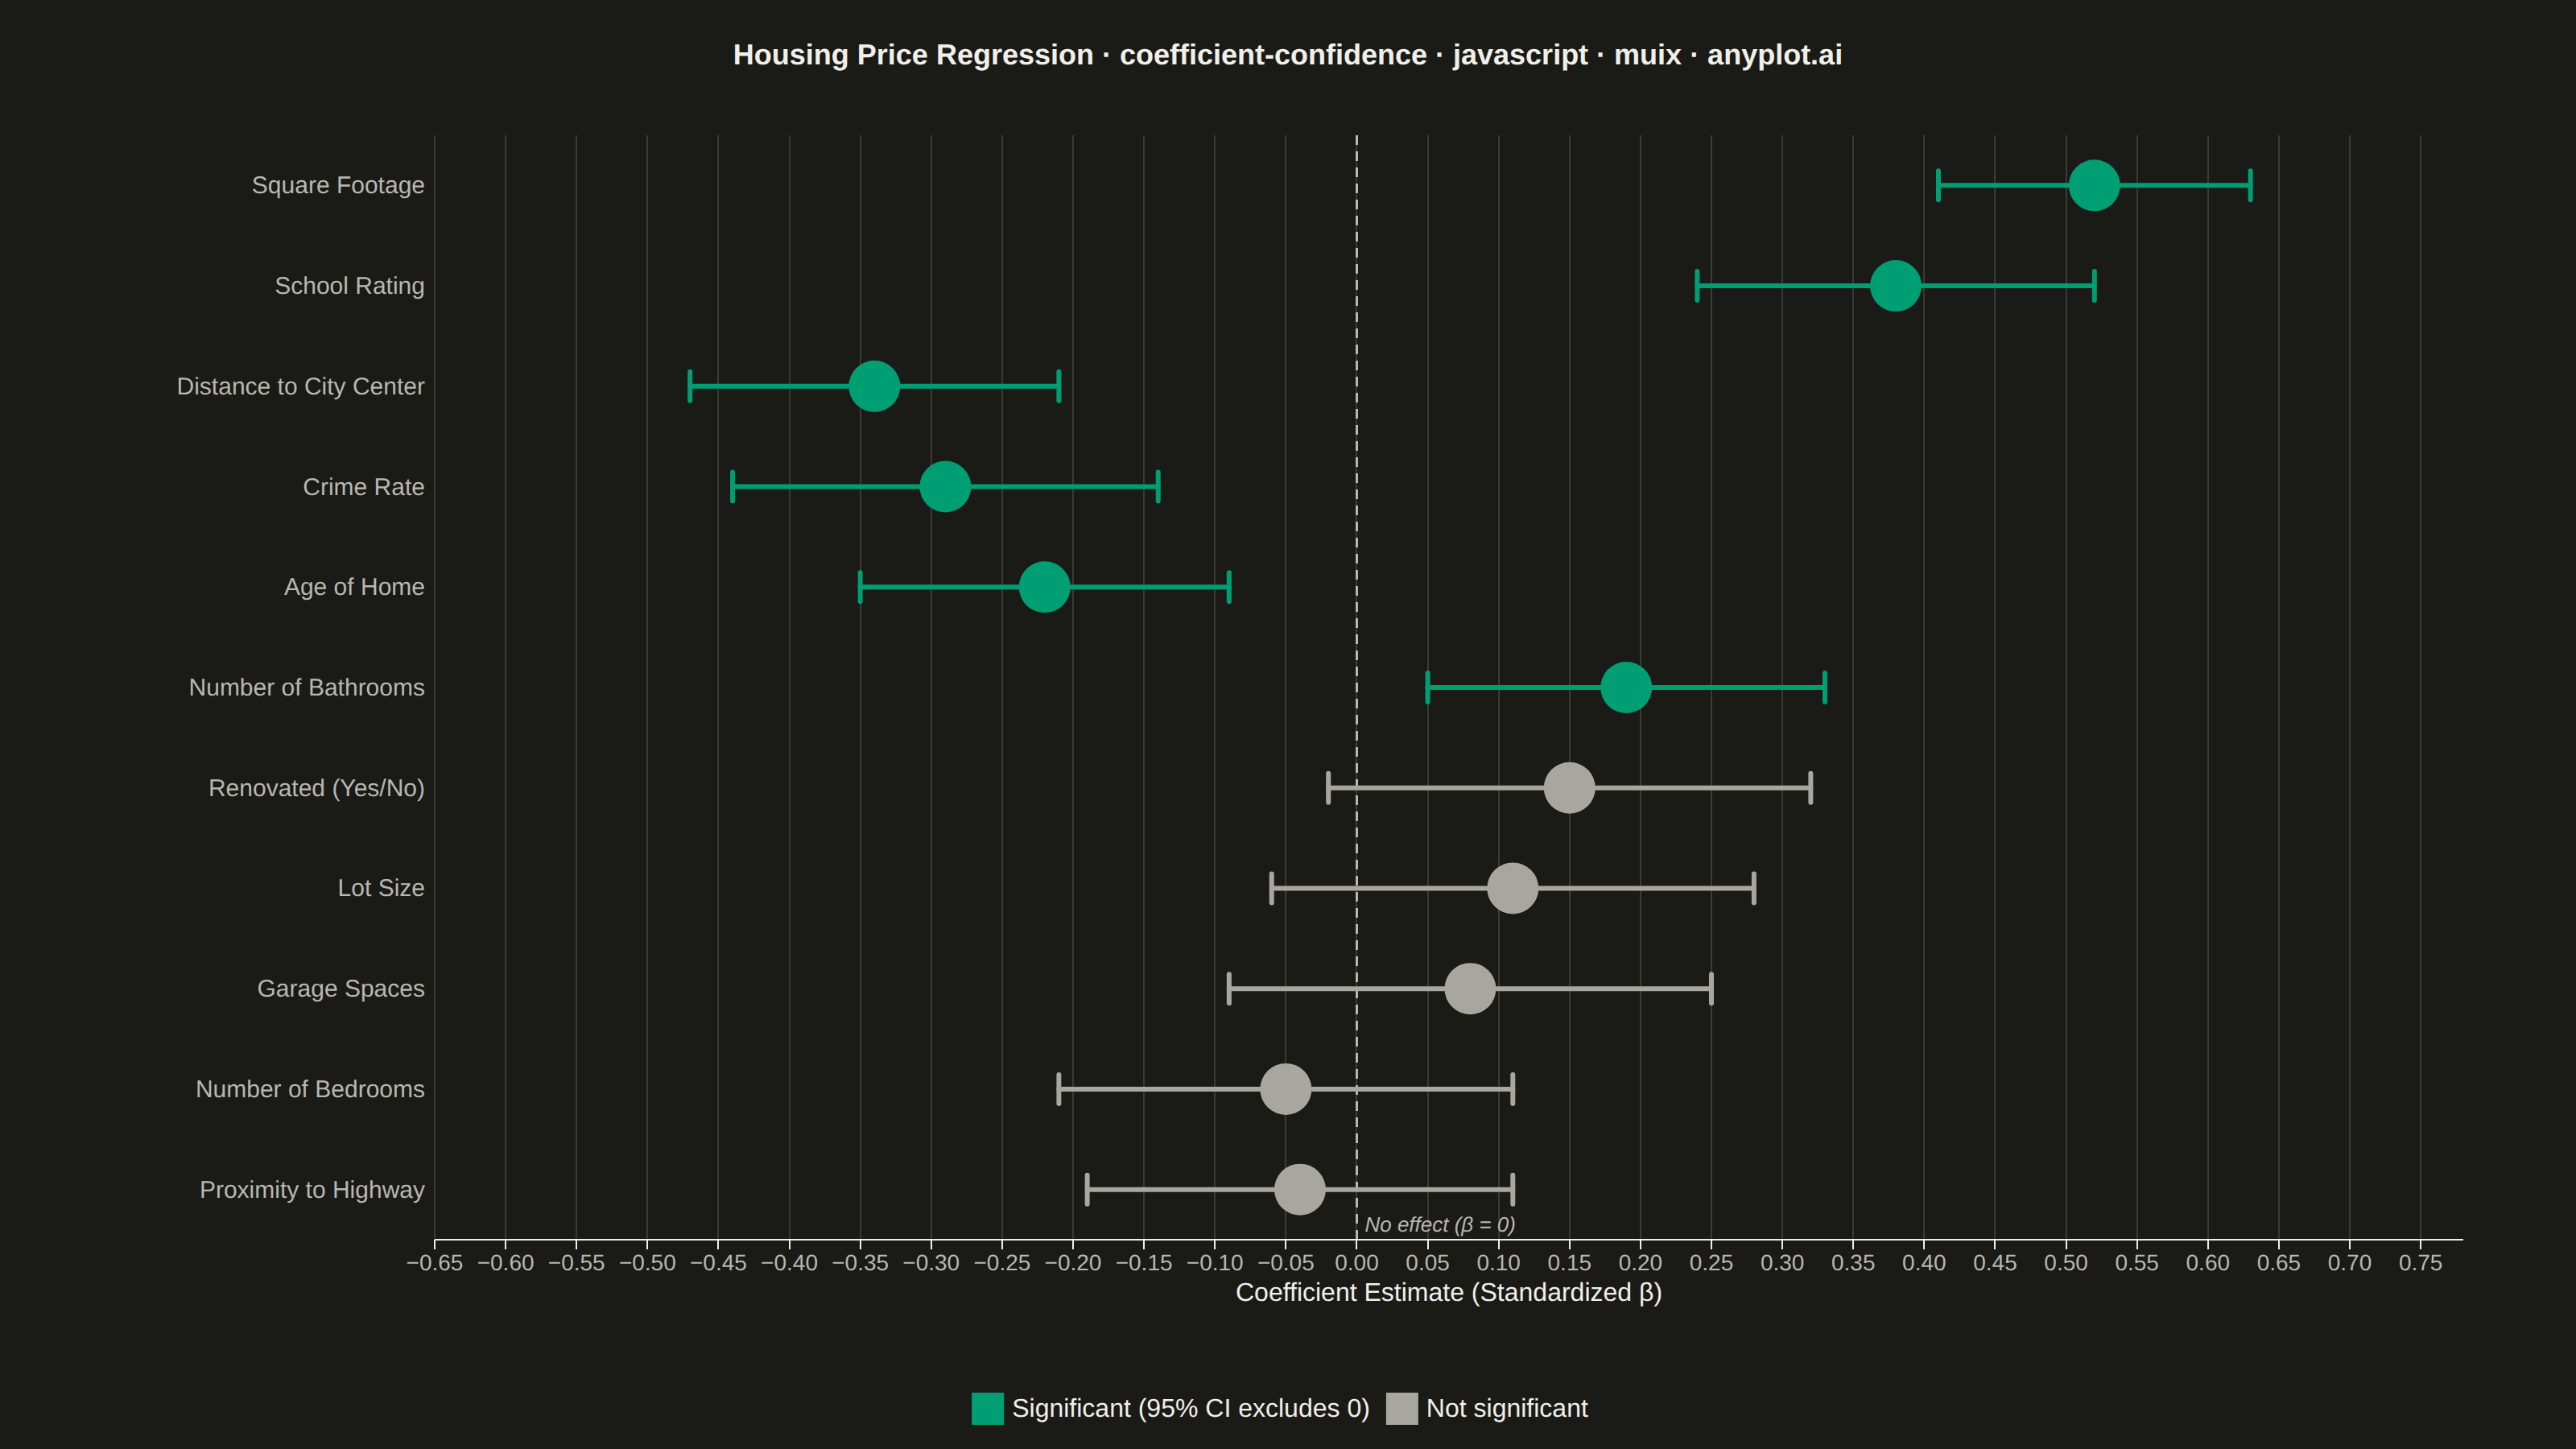
A coefficient plot displays regression coefficients as points positioned along a horizontal axis, with horizontal error bars showing confidence intervals. This visualization makes it easy to assess effect sizes and statistical significance - coefficients whose confidence intervals cross zero are not statistically significant. Typically used to summarize results from linear, logistic, or other regression models in a clear, publication-ready format.
// anyplot.ai
// coefficient-confidence: Coefficient Plot with Confidence Intervals
// Library: muix 7.29.1 | JavaScript 22.23.2
// Quality: 95/100 | Created: 2026-09-01
//# anyplot-orientation: landscape
// anyplot.ai
// coefficient-confidence: Coefficient Plot with Confidence Intervals
// Library: MUI X Charts | React | Node 22
// License: @mui/x-charts — MIT (community). Pro/Premium are out of scope.
// Quality: pending | Created: 2026-09-01

import { ChartContainer } from "@mui/x-charts/ChartContainer";
import { ScatterPlot } from "@mui/x-charts/ScatterChart";
import { ChartsXAxis } from "@mui/x-charts/ChartsXAxis";
import { ChartsYAxis } from "@mui/x-charts/ChartsYAxis";
import { ChartsGrid } from "@mui/x-charts/ChartsGrid";
import { ChartsReferenceLine } from "@mui/x-charts/ChartsReferenceLine";
import { ChartsLegend } from "@mui/x-charts/ChartsLegend";
import { ChartsTooltip } from "@mui/x-charts/ChartsTooltip";
import { useXScale, useYScale } from "@mui/x-charts/hooks";

const t = window.ANYPLOT_TOKENS;
const MUTED = t.theme === "dark" ? "#A8A79F" : "#6B6A63"; // muted anchor — "other/rest" role

// Multiple linear regression predicting housing sale price, standardized
// coefficients (β) with 95% confidence intervals. Ordered ascending by
// |coefficient| so the y-axis (min at bottom) renders largest effect on top.
const COEFFICIENTS = [
  { variable: "Proximity to Highway",   coefficient: -0.04, ciLower: -0.19, ciUpper: 0.11 },
  { variable: "Number of Bedrooms",     coefficient: -0.05, ciLower: -0.21, ciUpper: 0.11 },
  { variable: "Garage Spaces",          coefficient: 0.08,  ciLower: -0.09, ciUpper: 0.25 },
  { variable: "Lot Size",               coefficient: 0.11,  ciLower: -0.06, ciUpper: 0.28 },
  { variable: "Renovated (Yes/No)",     coefficient: 0.15,  ciLower: -0.02, ciUpper: 0.32 },
  { variable: "Number of Bathrooms",    coefficient: 0.19,  ciLower: 0.05,  ciUpper: 0.33 },
  { variable: "Age of Home",            coefficient: -0.22, ciLower: -0.35, ciUpper: -0.09 },
  { variable: "Crime Rate",             coefficient: -0.29, ciLower: -0.44, ciUpper: -0.14 },
  { variable: "Distance to City Center", coefficient: -0.34, ciLower: -0.47, ciUpper: -0.21 },
  { variable: "School Rating",          coefficient: 0.38,  ciLower: 0.24,  ciUpper: 0.52 },
  { variable: "Square Footage",         coefficient: 0.52,  ciLower: 0.41,  ciUpper: 0.63 },
];

const VARIABLES = COEFFICIENTS.map((d) => d.variable);
const N = COEFFICIENTS.length;

// Significant when the 95% CI excludes zero.
const isSignificant = (d) => d.ciLower > 0 || d.ciUpper < 0;

const significantPoints = COEFFICIENTS.map((d, i) => ({ ...d, i }))
  .filter((d) => isSignificant(d))
  .map((d) => ({ id: d.i, x: d.coefficient, y: d.i }));
const notSignificantPoints = COEFFICIENTS.map((d, i) => ({ ...d, i }))
  .filter((d) => !isSignificant(d))
  .map((d) => ({ id: d.i, x: d.coefficient, y: d.i }));

// Horizontal 95% CI whiskers, rendered inside ChartContainer so it can reach
// the D3 coordinate scales. Placed before <ScatterPlot /> so lines sit below dots.
function ConfidenceWhiskers() {
  const xScale = useXScale("x");
  const yScale = useYScale("y");

  return (
    <g>
      {COEFFICIENTS.map((d, i) => {
        const x1 = xScale(d.ciLower) ?? 0;
        const x2 = xScale(d.ciUpper) ?? 0;
        const y = yScale(i) ?? 0;
        const color = isSignificant(d) ? t.palette[0] : MUTED;
        const cap = 9;
        return (
          <g key={d.variable}>
            <line x1={x1} y1={y} x2={x2} y2={y} stroke={color} strokeWidth={3} strokeLinecap="round" />
            <line x1={x1} y1={y - cap} x2={x1} y2={y + cap} stroke={color} strokeWidth={3} strokeLinecap="round" />
            <line x1={x2} y1={y - cap} x2={x2} y2={y + cap} stroke={color} strokeWidth={3} strokeLinecap="round" />
          </g>
        );
      })}
    </g>
  );
}

const TITLE = "Housing Price Regression · coefficient-confidence · javascript · muix · anyplot.ai";
const TITLE_SIZE = TITLE.length > 67 ? Math.round(22 * 67 / TITLE.length) : 22;

export default function Chart() {
  const W = window.ANYPLOT_SIZE.width;
  const H = window.ANYPLOT_SIZE.height;

  return (
    <ChartContainer
      width={W}
      height={H}
      skipAnimation
      series={[
        {
          type: "scatter",
          id: "significant",
          label: "Significant (95% CI excludes 0)",
          data: significantPoints,
          color: t.palette[0],
          markerSize: 16,
          xAxisId: "x",
          yAxisId: "y",
        },
        {
          type: "scatter",
          id: "notSignificant",
          label: "Not significant",
          data: notSignificantPoints,
          color: MUTED,
          markerSize: 16,
          xAxisId: "x",
          yAxisId: "y",
        },
      ]}
      xAxis={[{
        id: "x",
        min: -0.65,
        max: 0.78,
        label: "Coefficient Estimate (Standardized β)",
        labelStyle: { fontSize: 16, fill: t.ink },
        tickLabelStyle: { fontSize: 14, fill: t.inkSoft },
      }]}
      yAxis={[{
        id: "y",
        min: -0.5,
        max: N - 0.5,
        tickMinStep: 1,
        valueFormatter: (v) => VARIABLES[Math.round(v)] ?? "",
        tickLabelStyle: { fontSize: 15, fill: t.inkSoft },
      }]}
      margin={{ top: 84, bottom: 130, left: 270, right: 70 }}
    >
      <ChartsGrid vertical />
      <ChartsReferenceLine
        x={0}
        axisId="x"
        label="No effect (β = 0)"
        labelAlign="end"
        lineStyle={{ stroke: t.inkSoft, strokeDasharray: "6 4", strokeWidth: 1.5 }}
        labelStyle={{ fontSize: 13, fill: t.inkSoft, fontStyle: "italic" }}
      />
      <ConfidenceWhiskers />
      <ScatterPlot />
      <ChartsXAxis axisId="x" />
      <ChartsYAxis axisId="y" disableLine disableTicks />
      <ChartsTooltip trigger="item" />
      <ChartsLegend position={{ vertical: "bottom", horizontal: "middle" }} direction="row" />
      <text
        x={W / 2}
        y={40}
        textAnchor="middle"
        fontSize={TITLE_SIZE}
        fontWeight={600}
        fill={t.ink}
        fontFamily="-apple-system, BlinkMacSystemFont, 'Segoe UI', Roboto, Helvetica, Arial, sans-serif"
      >
        {TITLE}
      </text>
    </ChartContainer>
  );
}
Runnable source as JSON, for any HTTP client: https://api.anyplot.ai/specs/coefficient-confidence/muix/code. Any spec id and library id listed in llms-full.txt fit the same URL shape; every URL below is complete and callable.
{
  "spec_id": "coefficient-confidence",
  "language": "javascript",
  "library": "muix",
  "page": "https://anyplot.ai/coefficient-confidence/javascript/muix",
  "hub": "https://anyplot.ai/coefficient-confidence",
  "code_json": "https://api.anyplot.ai/specs/coefficient-confidence/muix/code",
  "spec_json": "https://api.anyplot.ai/specs/coefficient-confidence",
  "render_light_png": "https://storage.googleapis.com/anyplot-images/plots/coefficient-confidence/javascript/muix/plot-light.png",
  "render_dark_png": "https://storage.googleapis.com/anyplot-images/plots/coefficient-confidence/javascript/muix/plot-dark.png",
  "interactive_light_html": "https://storage.googleapis.com/anyplot-images/plots/coefficient-confidence/javascript/muix/plot-light.html",
  "interactive_dark_html": "https://storage.googleapis.com/anyplot-images/plots/coefficient-confidence/javascript/muix/plot-dark.html",
  "quality_score": 95.0,
  "license": "MIT",
  "guide": "https://anyplot.ai/llms.txt"
}
Part of Coefficient Plot with Confidence Intervals on anyplot.ai.