The same plot in 14 other libraries — JavaScript: Chart.js, D3.js, Apache ECharts, MUI X Charts; Python: Altair, Bokeh, lets-plot, Matplotlib, Plotly, plotnine, Pygal, Seaborn; R: ggplot2; Julia: Makie.jl. Compare all 15 side by side: Coefficient Plot with Confidence Intervals in Python, R, Julia and JavaScript.
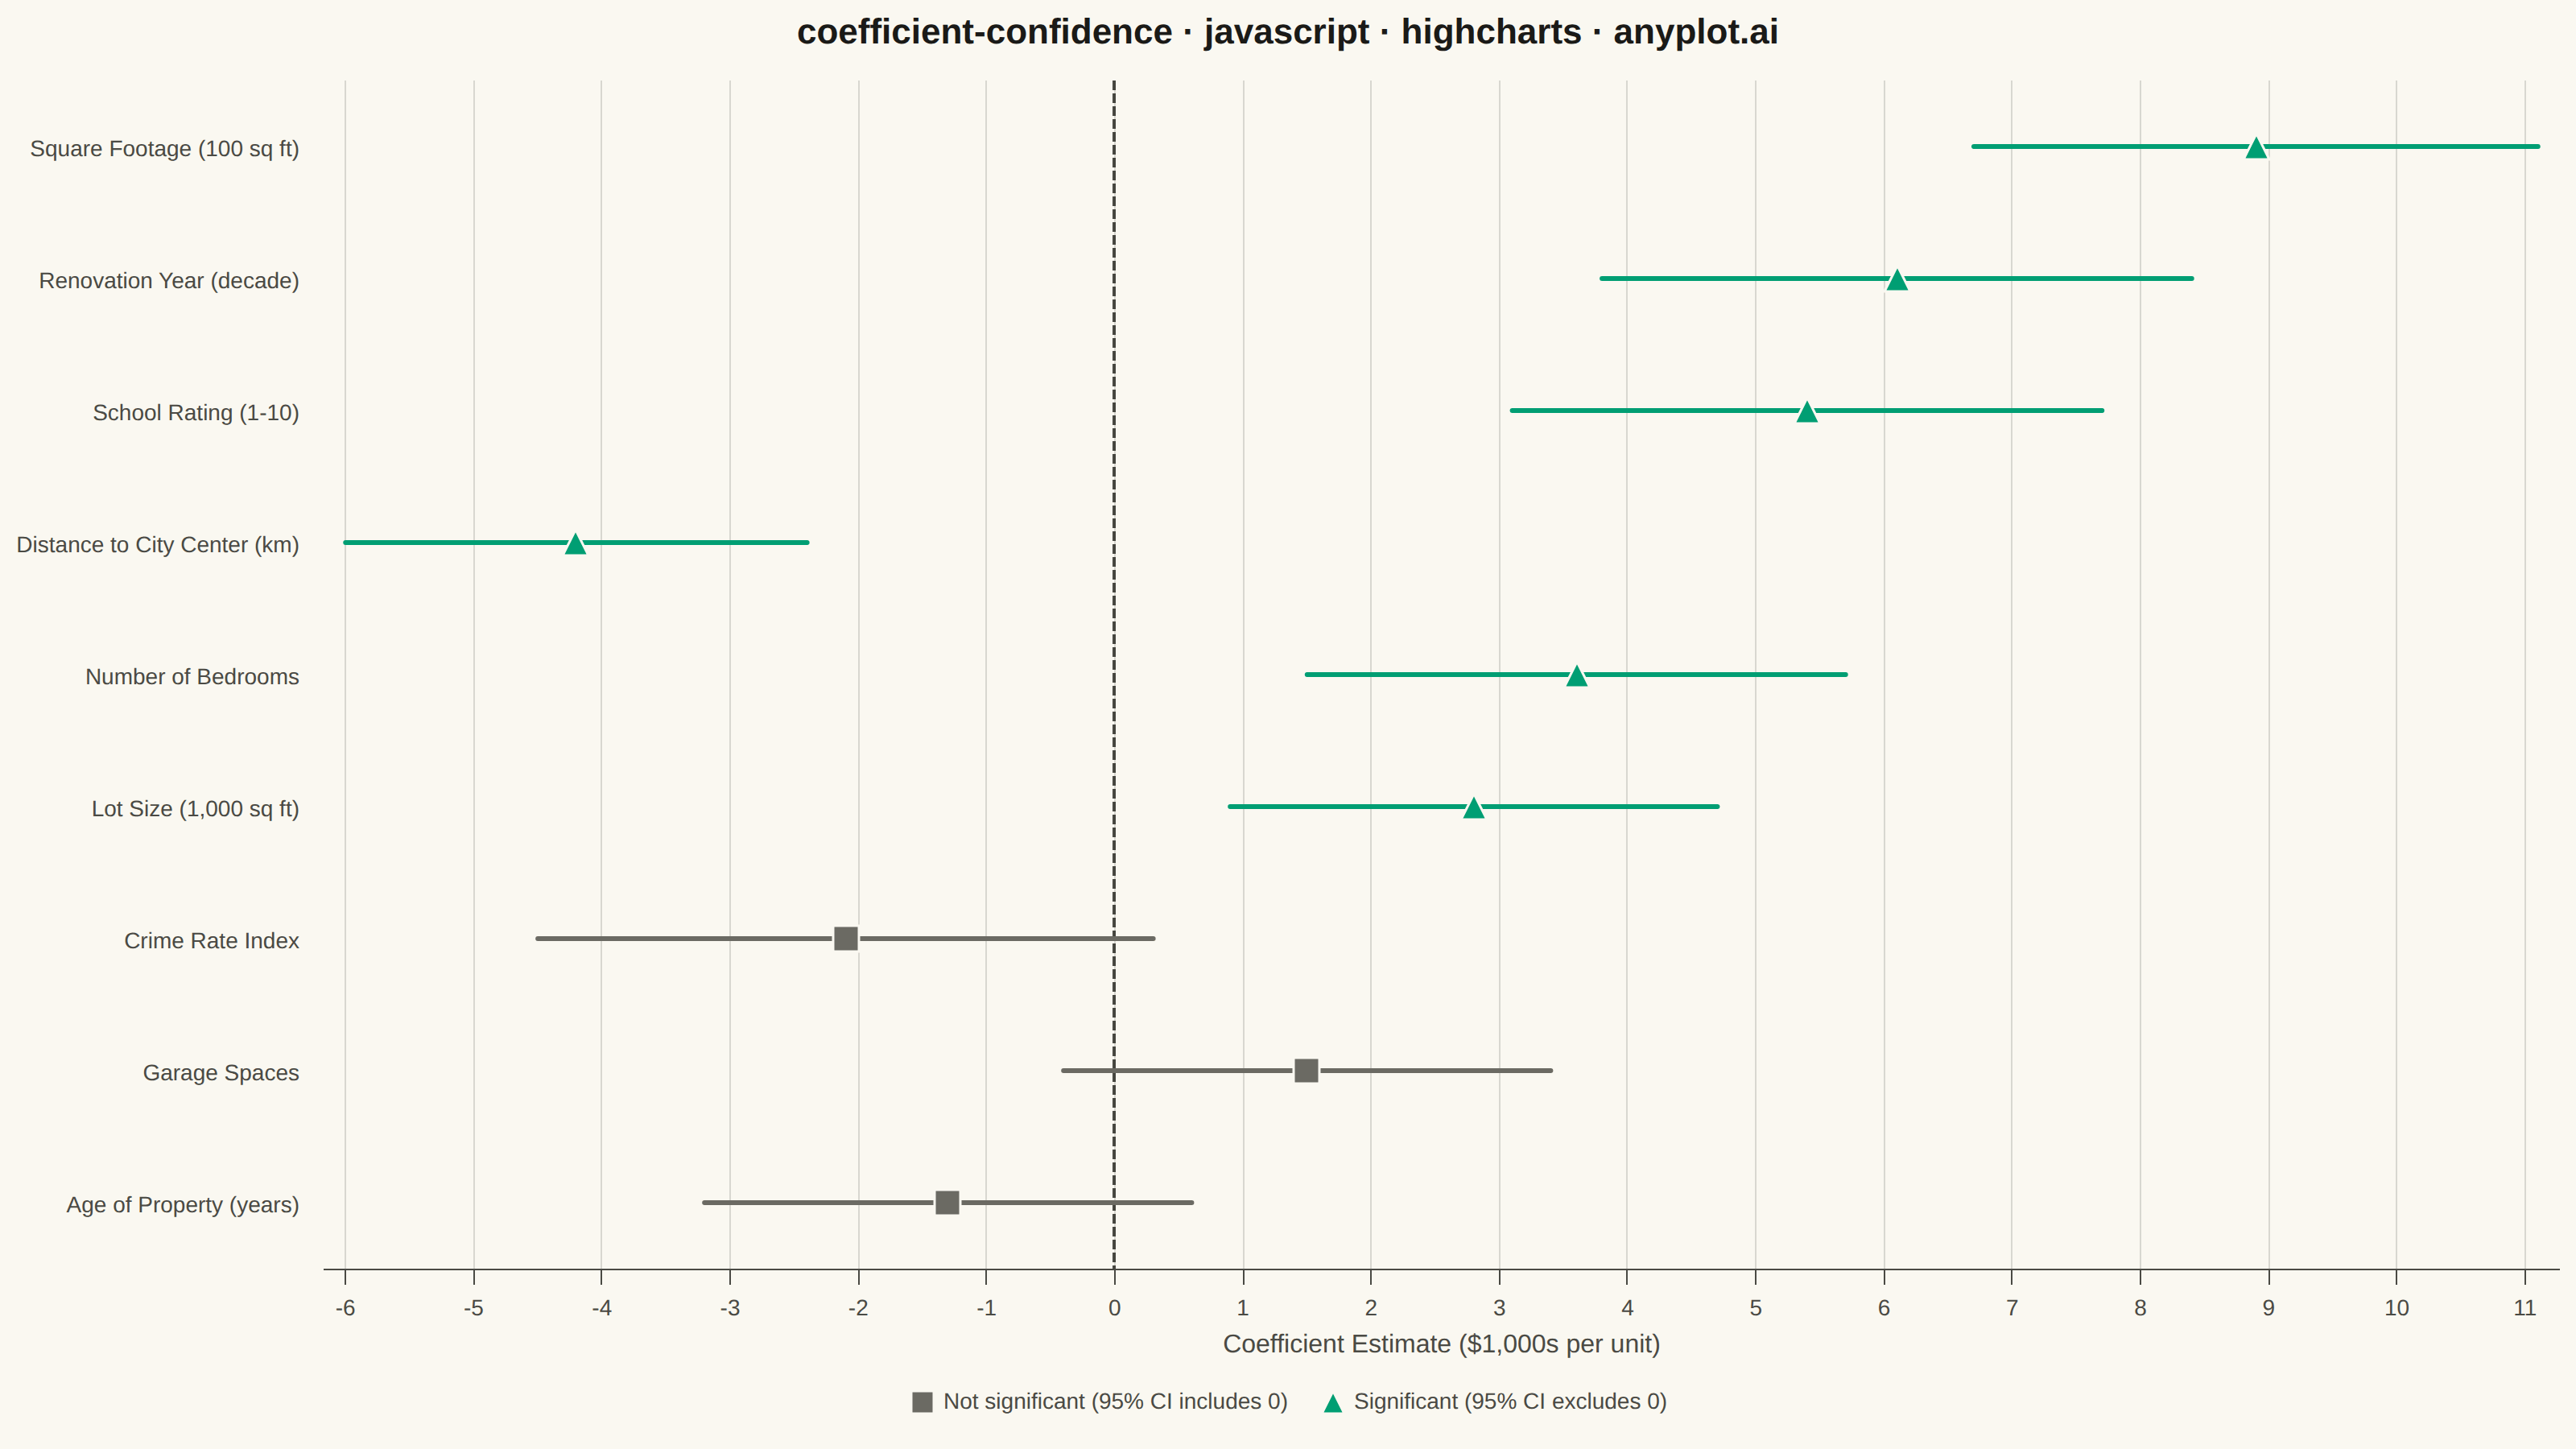
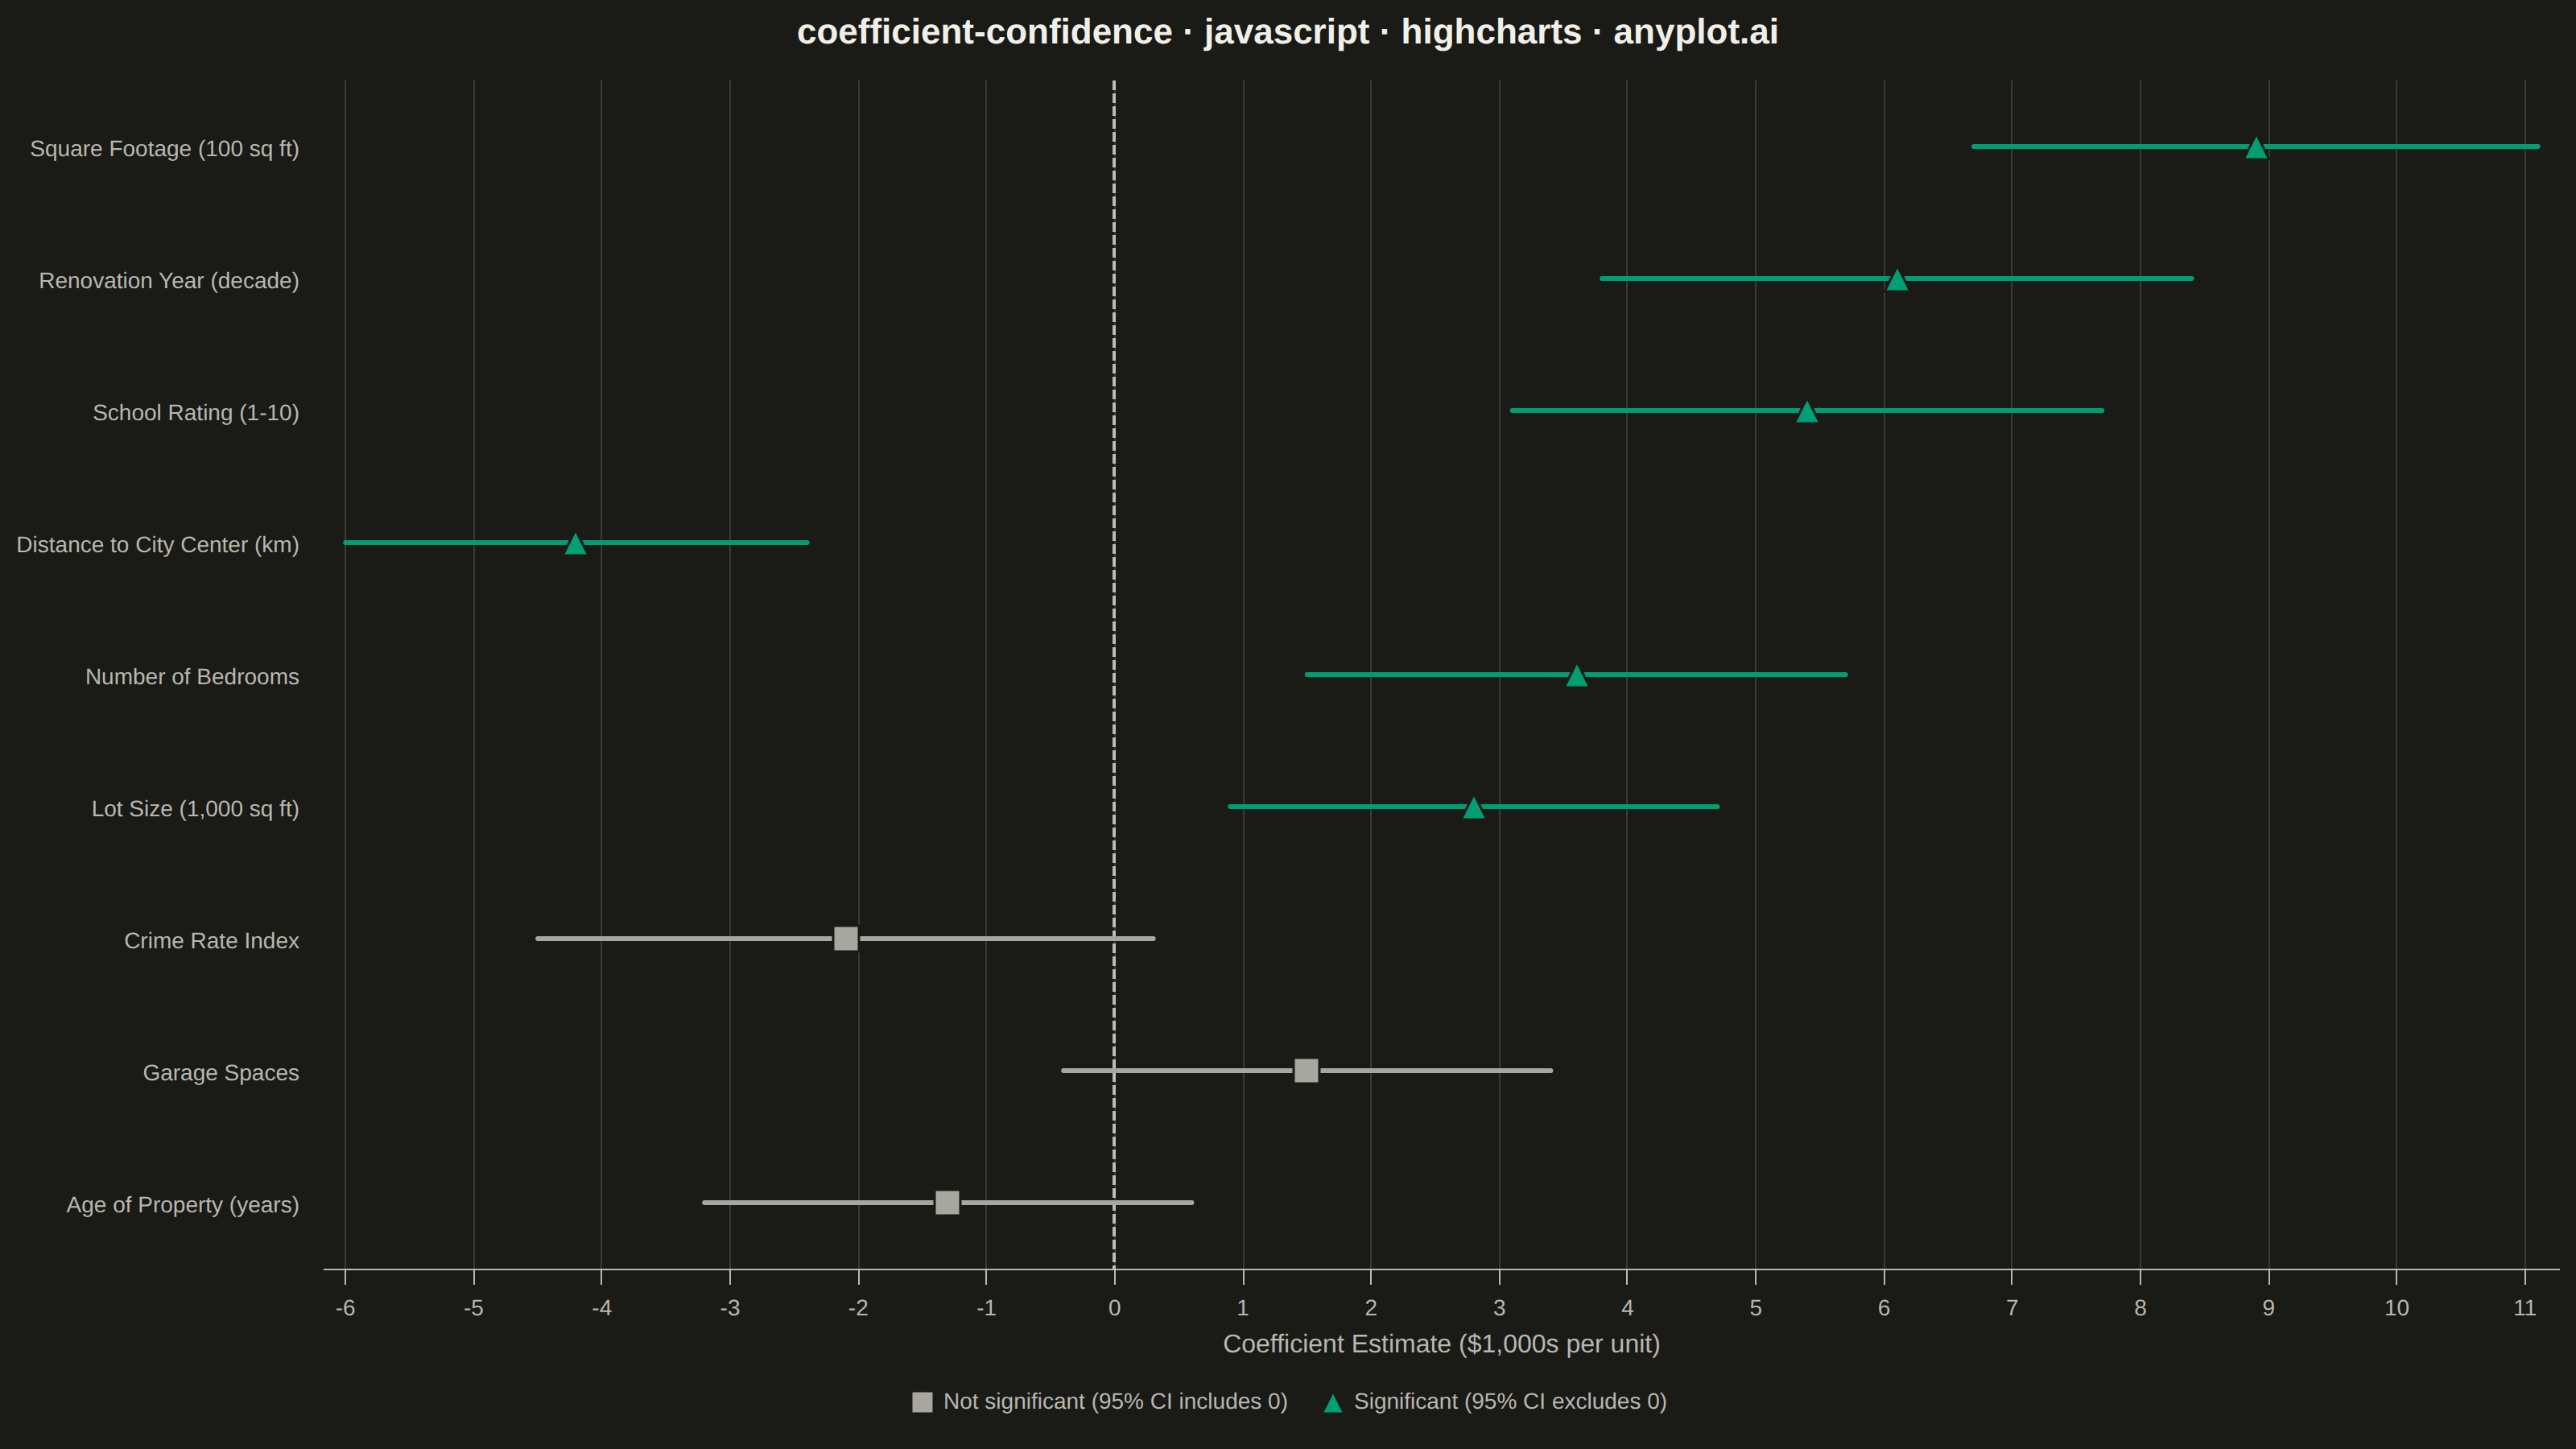
A coefficient plot displays regression coefficients as points positioned along a horizontal axis, with horizontal error bars showing confidence intervals. This visualization makes it easy to assess effect sizes and statistical significance - coefficients whose confidence intervals cross zero are not statistically significant. Typically used to summarize results from linear, logistic, or other regression models in a clear, publication-ready format.
// anyplot.ai
// coefficient-confidence: Coefficient Plot with Confidence Intervals
// Library: highcharts 12.6.0 | JavaScript 22.23.2
// Quality: 90/100 | Created: 2026-09-01

const t = window.ANYPLOT_TOKENS;
// ANYPLOT_TOKENS has no "muted" field — derive the theme-adaptive muted-ink
// anchor locally (see prompts/default-style-guide.md "Theme-adaptive Chrome").
const inkMuted = window.ANYPLOT_THEME === "dark" ? "#A8A79F" : "#6B6A63";

// --- Data (in-memory, deterministic) ----------------------------------------
// Coefficients from a multiple linear regression predicting housing prices
// (thousands of USD per unit change), ordered by |coefficient| ascending so
// the strongest effect sits at the top of the axis.
const coefficients = [
  { variable: "Age of Property (years)", coefficient: -1.3, ciLower: -3.2, ciUpper: 0.6 },
  { variable: "Garage Spaces", coefficient: 1.5, ciLower: -0.4, ciUpper: 3.4 },
  { variable: "Crime Rate Index", coefficient: -2.1, ciLower: -4.5, ciUpper: 0.3 },
  { variable: "Lot Size (1,000 sq ft)", coefficient: 2.8, ciLower: 0.9, ciUpper: 4.7 },
  { variable: "Number of Bedrooms", coefficient: 3.6, ciLower: 1.5, ciUpper: 5.7 },
  { variable: "Distance to City Center (km)", coefficient: -4.2, ciLower: -6.0, ciUpper: -2.4 },
  { variable: "School Rating (1-10)", coefficient: 5.4, ciLower: 3.1, ciUpper: 7.7 },
  { variable: "Renovation Year (decade)", coefficient: 6.1, ciLower: 3.8, ciUpper: 8.4 },
  { variable: "Square Footage (100 sq ft)", coefficient: 8.9, ciLower: 6.7, ciUpper: 11.1 },
].map((row, index) => ({
  ...row,
  index,
  significant: row.ciLower > 0 || row.ciUpper < 0,
}));

const categories = coefficients.map((row) => row.variable);
const significantRows = coefficients.filter((row) => row.significant);
const notSignificantRows = coefficients.filter((row) => !row.significant);

// Highcharts core has no errorbar/columnrange series (highcharts-more is not
// loaded), so each whisker is drawn as a two-point horizontal line segment;
// a null point after every pair breaks the line before the next coefficient.
const whiskerData = (rows) =>
  rows.flatMap((row) => [
    [row.ciLower, row.index],
    [row.ciUpper, row.index],
    [null, null],
  ]);

// --- Chart -------------------------------------------------------------------
Highcharts.chart("container", {
  chart: {
    type: "line",
    backgroundColor: "transparent",
    animation: false,
    style: { fontFamily: "inherit" },
  },
  credits: { enabled: false },
  title: {
    text: "coefficient-confidence · javascript · highcharts · anyplot.ai",
    style: { color: t.ink, fontSize: "22px", fontWeight: "600" },
  },
  xAxis: {
    title: { text: "Coefficient Estimate ($1,000s per unit)", style: { color: t.inkSoft, fontSize: "16px" } },
    lineColor: t.inkSoft,
    tickColor: t.inkSoft,
    gridLineWidth: 1,
    gridLineColor: t.grid,
    labels: { style: { color: t.inkSoft, fontSize: "14px" } },
    plotLines: [{ value: 0, color: t.inkSoft, width: 2, dashStyle: "ShortDash" }],
  },
  yAxis: {
    categories,
    title: { text: null },
    lineColor: t.inkSoft,
    tickColor: t.inkSoft,
    gridLineWidth: 0,
    labels: { style: { color: t.inkSoft, fontSize: "14px" } },
  },
  legend: {
    itemStyle: { color: t.inkSoft, fontSize: "14px" },
    itemHoverStyle: { color: t.ink },
  },
  plotOptions: {
    series: { animation: false },
    line: { marker: { enabled: false }, enableMouseTracking: false, showInLegend: false, lineWidth: 3 },
    scatter: { marker: { radius: 8, lineColor: t.pageBg, lineWidth: 1.5 } },
  },
  series: [
    { type: "line", name: "CI (not significant)", data: whiskerData(notSignificantRows), color: inkMuted },
    { type: "line", name: "CI (significant)", data: whiskerData(significantRows), color: t.palette[0] },
    {
      type: "scatter",
      name: "Not significant (95% CI includes 0)",
      data: notSignificantRows.map((row) => ({ x: row.coefficient, y: row.index })),
      color: inkMuted,
    },
    {
      type: "scatter",
      name: "Significant (95% CI excludes 0)",
      data: significantRows.map((row) => ({ x: row.coefficient, y: row.index })),
      color: t.palette[0],
    },
  ],
});
Runnable source as JSON, for any HTTP client: https://api.anyplot.ai/specs/coefficient-confidence/highcharts/code. Any spec id and library id listed in llms-full.txt fit the same URL shape; every URL below is complete and callable.
{
  "spec_id": "coefficient-confidence",
  "language": "javascript",
  "library": "highcharts",
  "page": "https://anyplot.ai/coefficient-confidence/javascript/highcharts",
  "hub": "https://anyplot.ai/coefficient-confidence",
  "code_json": "https://api.anyplot.ai/specs/coefficient-confidence/highcharts/code",
  "spec_json": "https://api.anyplot.ai/specs/coefficient-confidence",
  "render_light_png": "https://storage.googleapis.com/anyplot-images/plots/coefficient-confidence/javascript/highcharts/plot-light.png",
  "render_dark_png": "https://storage.googleapis.com/anyplot-images/plots/coefficient-confidence/javascript/highcharts/plot-dark.png",
  "interactive_light_html": "https://storage.googleapis.com/anyplot-images/plots/coefficient-confidence/javascript/highcharts/plot-light.html",
  "interactive_dark_html": "https://storage.googleapis.com/anyplot-images/plots/coefficient-confidence/javascript/highcharts/plot-dark.html",
  "quality_score": 90.0,
  "license": "MIT",
  "guide": "https://anyplot.ai/llms.txt"
}
Part of Coefficient Plot with Confidence Intervals on anyplot.ai.