The same plot in 14 other libraries — JavaScript: Chart.js, D3.js, Highcharts, MUI X Charts; Python: Altair, Bokeh, lets-plot, Matplotlib, Plotly, plotnine, Pygal, Seaborn; R: ggplot2; Julia: Makie.jl. Compare all 15 side by side: Filled Contour Plot in Python, R, Julia and JavaScript.
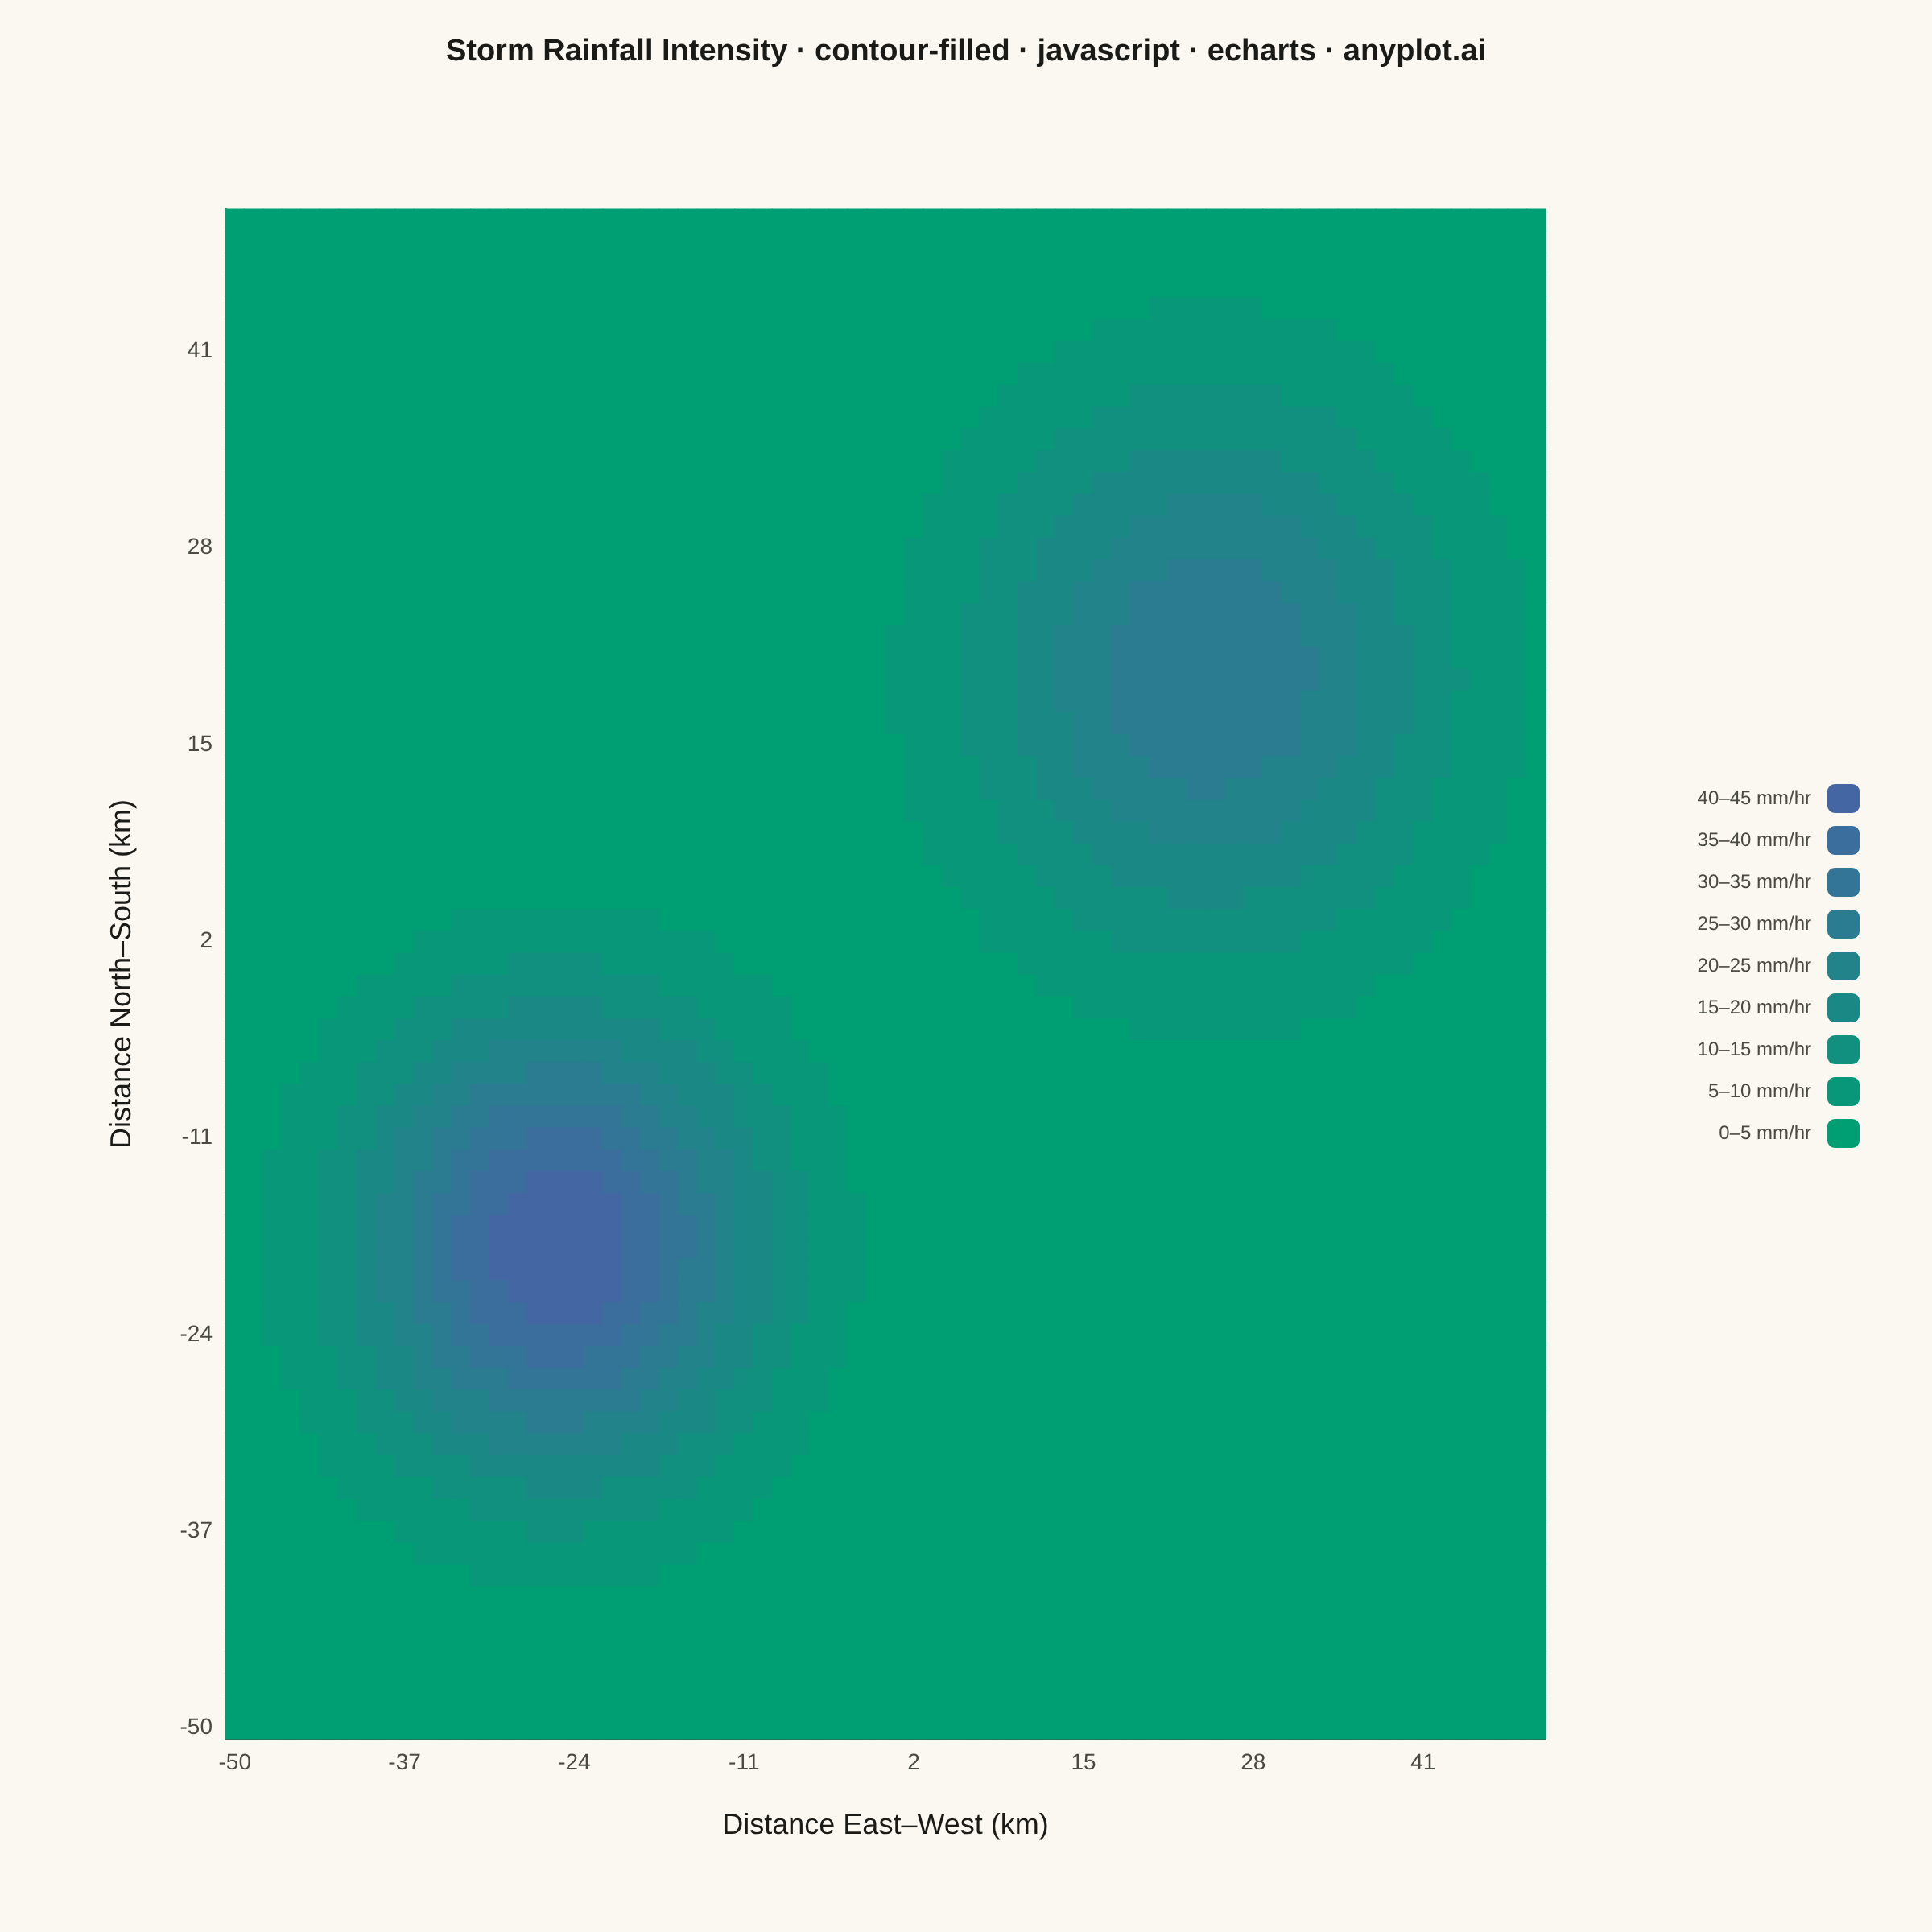
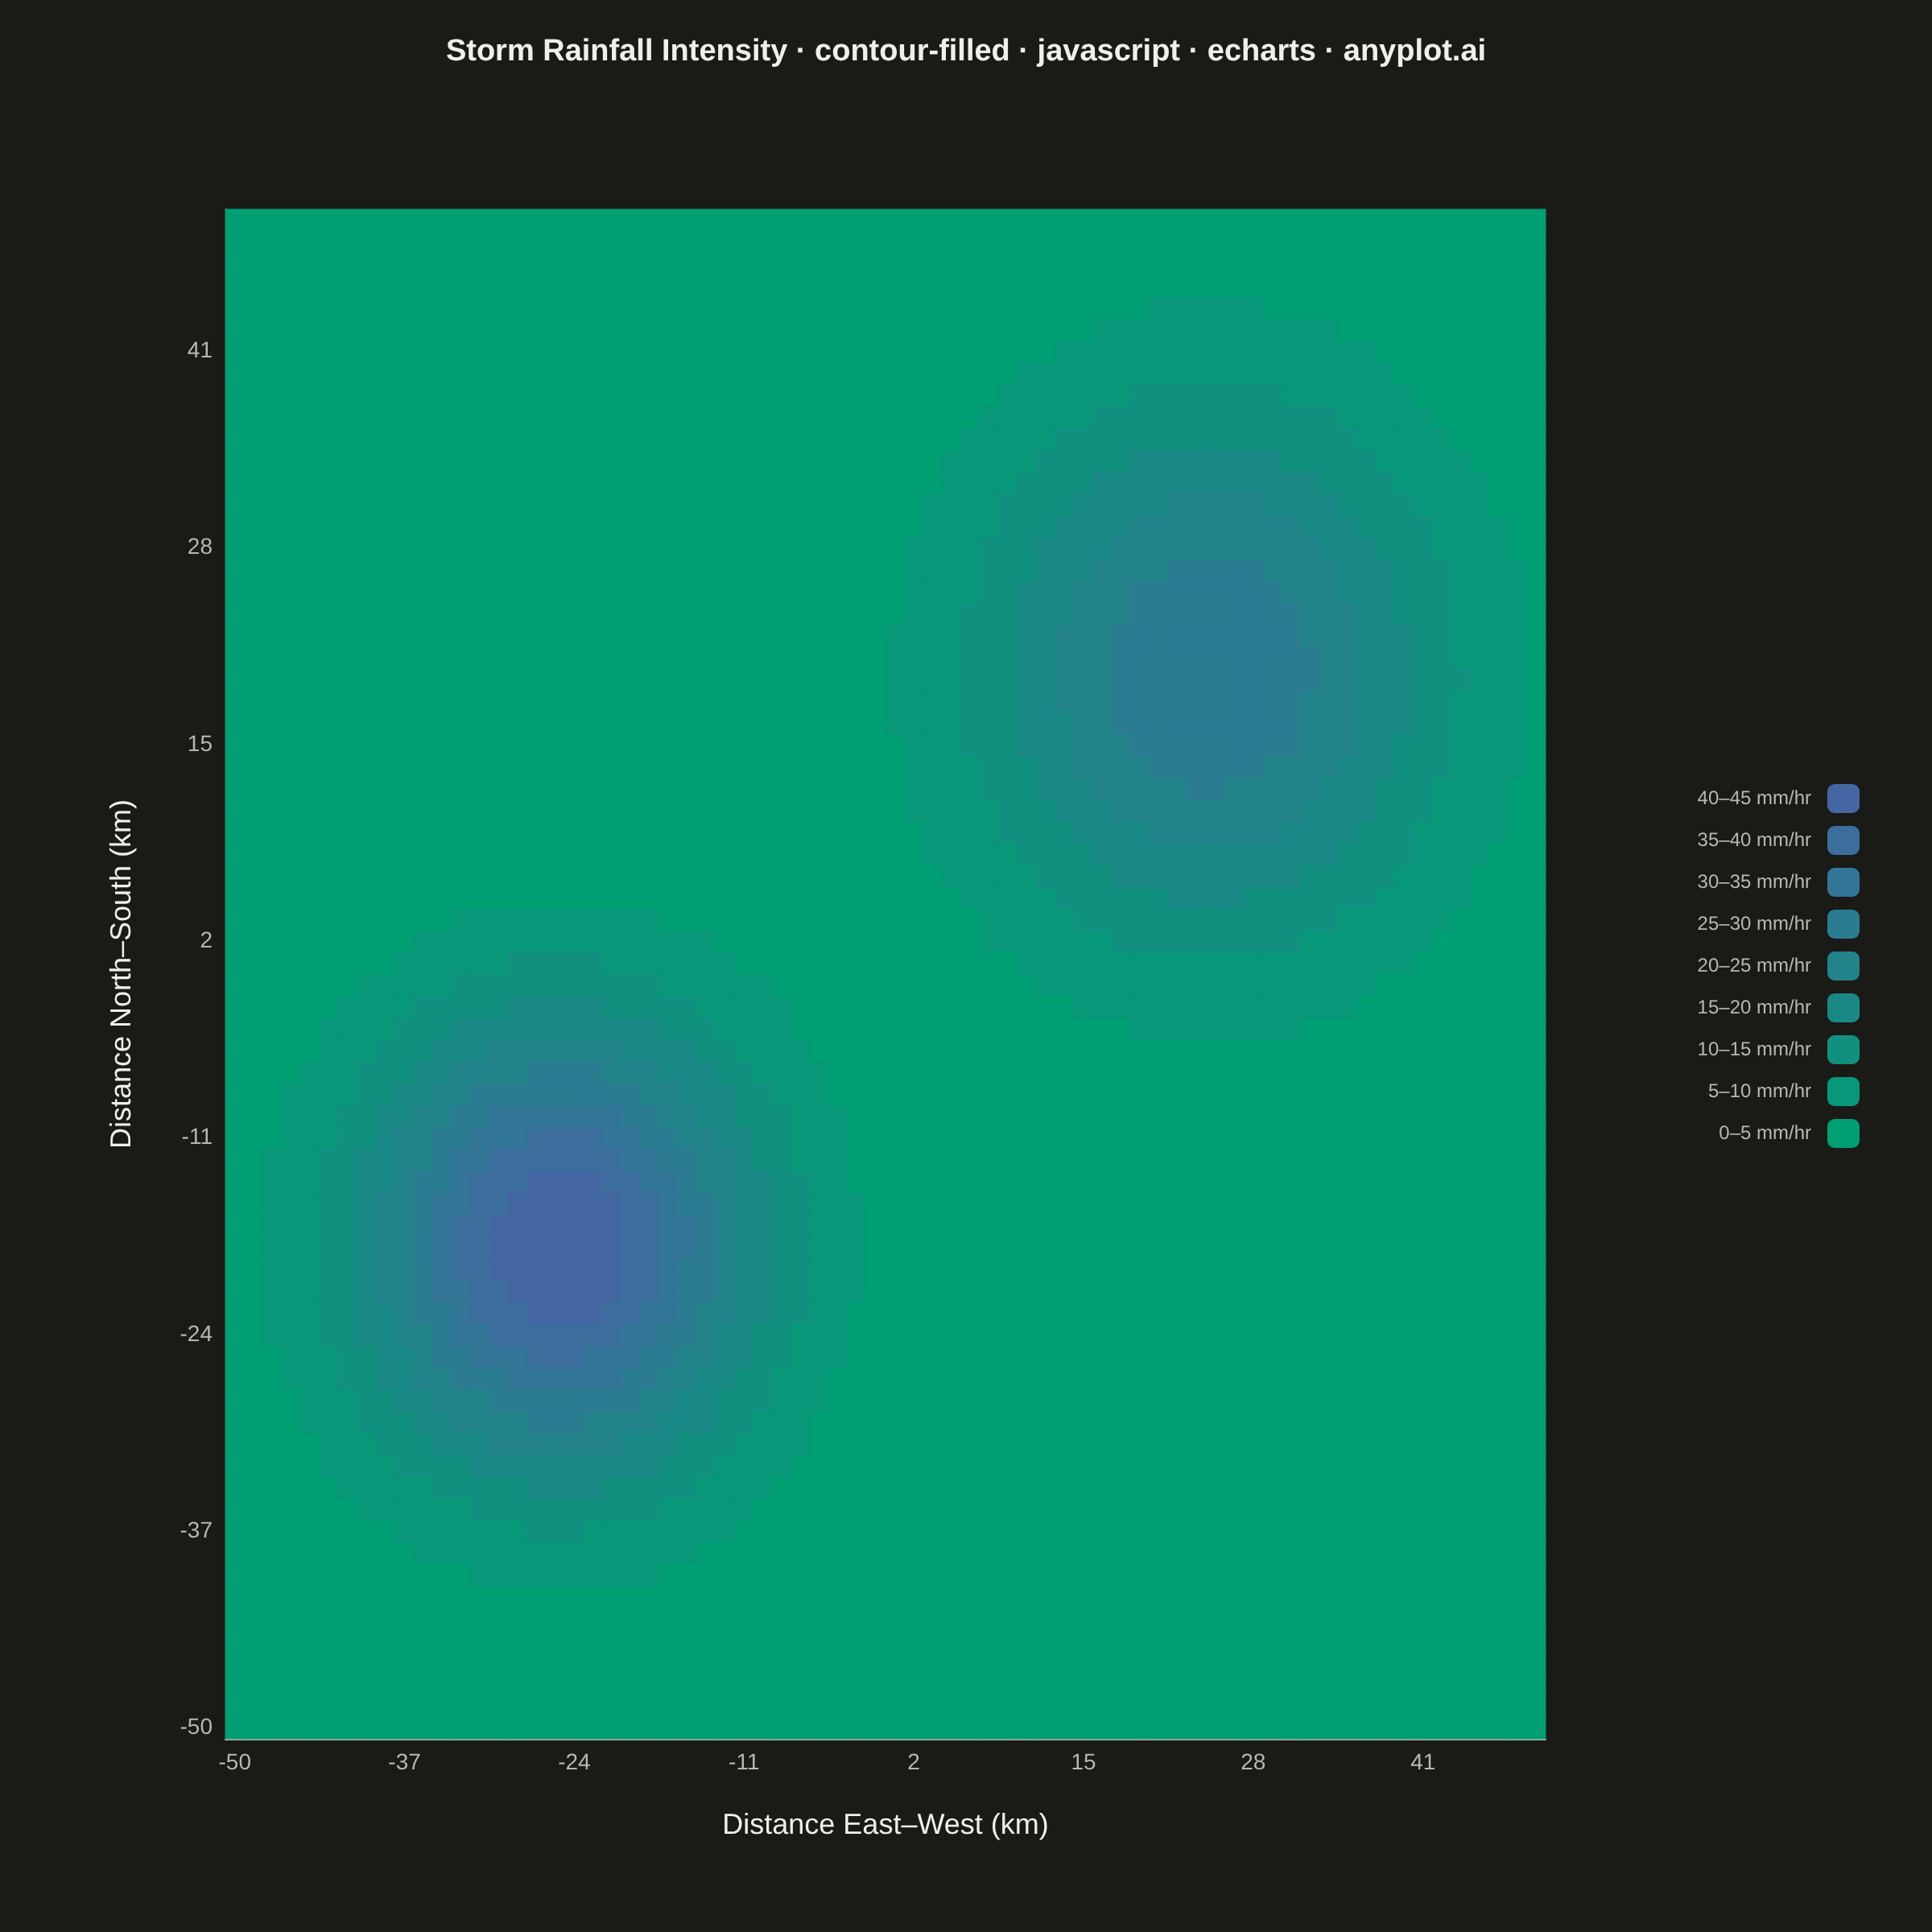
A filled contour plot displays colored regions between level curves of a 2D scalar field, creating a smooth gradient visualization of continuous data. Unlike basic contour plots that show only isolines, filled contours use color bands to represent value ranges, making it easier to perceive gradual changes and identify regions of similar magnitude. This visualization is particularly effective for showing how a quantity varies continuously across a 2D surface.
// anyplot.ai
// contour-filled: Filled Contour Plot
// Library: echarts 6.1.0 | JavaScript 22.23.2
// Quality: 85/100 | Created: 2026-09-04

//# anyplot-orientation: square
const t = window.ANYPLOT_TOKENS;

// --- Data (in-memory, deterministic) ----------------------------------------
// Combined rainfall-intensity field from two overlapping storm cells over a
// 100 km x 100 km region, sampled on a regular grid.
const N = 70; // grid points per axis (spec range: 30-100)
const DOMAIN_MIN = -50;
const DOMAIN_MAX = 50;
const step = (DOMAIN_MAX - DOMAIN_MIN) / (N - 1);
const coords = Array.from({ length: N }, (_, i) => DOMAIN_MIN + i * step);

// Two Gaussian storm cells: [centerX, centerY, sigma, peakIntensityMmPerHr]
// Centers are far apart relative to sigma so the two peaks read as distinct
// lobes rather than merging into one blob.
const storms = [
  [-25, -18, 11, 45],
  [25, 20, 13, 30],
];

function rainfallIntensity(x, y) {
  return storms.reduce((sum, [cx, cy, sigma, peak]) => {
    const d2 = (x - cx) ** 2 + (y - cy) ** 2;
    return sum + peak * Math.exp(-d2 / (2 * sigma * sigma));
  }, 0);
}

const data = [];
let zMax = 0;
for (let i = 0; i < N; i++) {
  for (let j = 0; j < N; j++) {
    const z = rainfallIntensity(coords[i], coords[j]);
    if (z > zMax) zMax = z;
    data.push([i, j, Math.round(z * 10) / 10]);
  }
}

// --- Axis labels (thin out to keep the grid readable) -----------------------
const axisLabels = coords.map((v) => Math.round(v).toString());
const tickInterval = Math.ceil(N / 8) - 1;

// --- Title size (scale for length > 67 chars) --------------------------------
const titleText =
  "Storm Rainfall Intensity · contour-filled · javascript · echarts · anyplot.ai";
const titleSize = Math.max(
  15,
  Math.round(22 * Math.min(1, 67 / titleText.length)),
);

// --- Render ------------------------------------------------------------------
const chart = echarts.init(document.getElementById("container"));

chart.setOption({
  animation: false,
  backgroundColor: "transparent",

  title: {
    text: titleText,
    left: "center",
    top: 18,
    textStyle: { color: t.ink, fontSize: titleSize, fontWeight: "bold" },
  },

  grid: { left: 140, right: 240, top: 130, bottom: 120 },

  xAxis: {
    type: "category",
    data: axisLabels,
    name: "Distance East–West (km)",
    nameLocation: "middle",
    nameGap: 45,
    nameTextStyle: { color: t.ink, fontSize: 18 },
    axisLabel: { color: t.inkSoft, fontSize: 14, interval: tickInterval },
    axisLine: { lineStyle: { color: t.inkSoft } },
    axisTick: { show: false },
    splitLine: { show: false },
  },

  yAxis: {
    type: "category",
    data: axisLabels,
    name: "Distance North–South (km)",
    nameLocation: "middle",
    nameGap: 55,
    nameTextStyle: { color: t.ink, fontSize: 18 },
    axisLabel: { color: t.inkSoft, fontSize: 14, interval: tickInterval },
    axisLine: { lineStyle: { color: t.inkSoft } },
    axisTick: { show: false },
    splitLine: { show: false },
  },

  // Imprint sequential colormap banded into few, high-contrast levels — the
  // filled-contour look. Every swatch is labeled with its own range so
  // intermediate levels can be read off precisely, not just the extremes.
  visualMap: {
    type: "piecewise",
    min: 0,
    max: Math.ceil(zMax),
    splitNumber: 9,
    calculable: false,
    orient: "vertical",
    right: 30,
    top: "middle",
    itemWidth: 20,
    itemHeight: 18,
    itemGap: 8,
    precision: 0,
    formatter: (min, max) => `${Math.round(min)}–${Math.round(max)} mm/hr`,
    textStyle: { color: t.inkSoft, fontSize: 12 },
    inRange: { color: t.seq },
    backgroundColor: "transparent",
    borderWidth: 0,
  },

  series: [
    {
      type: "heatmap",
      data: data,
      itemStyle: { borderWidth: 0 },
      emphasis: { disabled: true },
      label: { show: false },
    },
  ],

  tooltip: { show: false },
});
Runnable source as JSON, for any HTTP client: https://api.anyplot.ai/specs/contour-filled/echarts/code. Any spec id and library id listed in llms-full.txt fit the same URL shape; every URL below is complete and callable.
{
  "spec_id": "contour-filled",
  "language": "javascript",
  "library": "echarts",
  "page": "https://anyplot.ai/contour-filled/javascript/echarts",
  "hub": "https://anyplot.ai/contour-filled",
  "code_json": "https://api.anyplot.ai/specs/contour-filled/echarts/code",
  "spec_json": "https://api.anyplot.ai/specs/contour-filled",
  "render_light_png": "https://storage.googleapis.com/anyplot-images/plots/contour-filled/javascript/echarts/plot-light.png",
  "render_dark_png": "https://storage.googleapis.com/anyplot-images/plots/contour-filled/javascript/echarts/plot-dark.png",
  "interactive_light_html": "https://storage.googleapis.com/anyplot-images/plots/contour-filled/javascript/echarts/plot-light.html",
  "interactive_dark_html": "https://storage.googleapis.com/anyplot-images/plots/contour-filled/javascript/echarts/plot-dark.html",
  "quality_score": 85.0,
  "license": "MIT",
  "guide": "https://anyplot.ai/llms.txt"
}
Part of Filled Contour Plot on anyplot.ai.