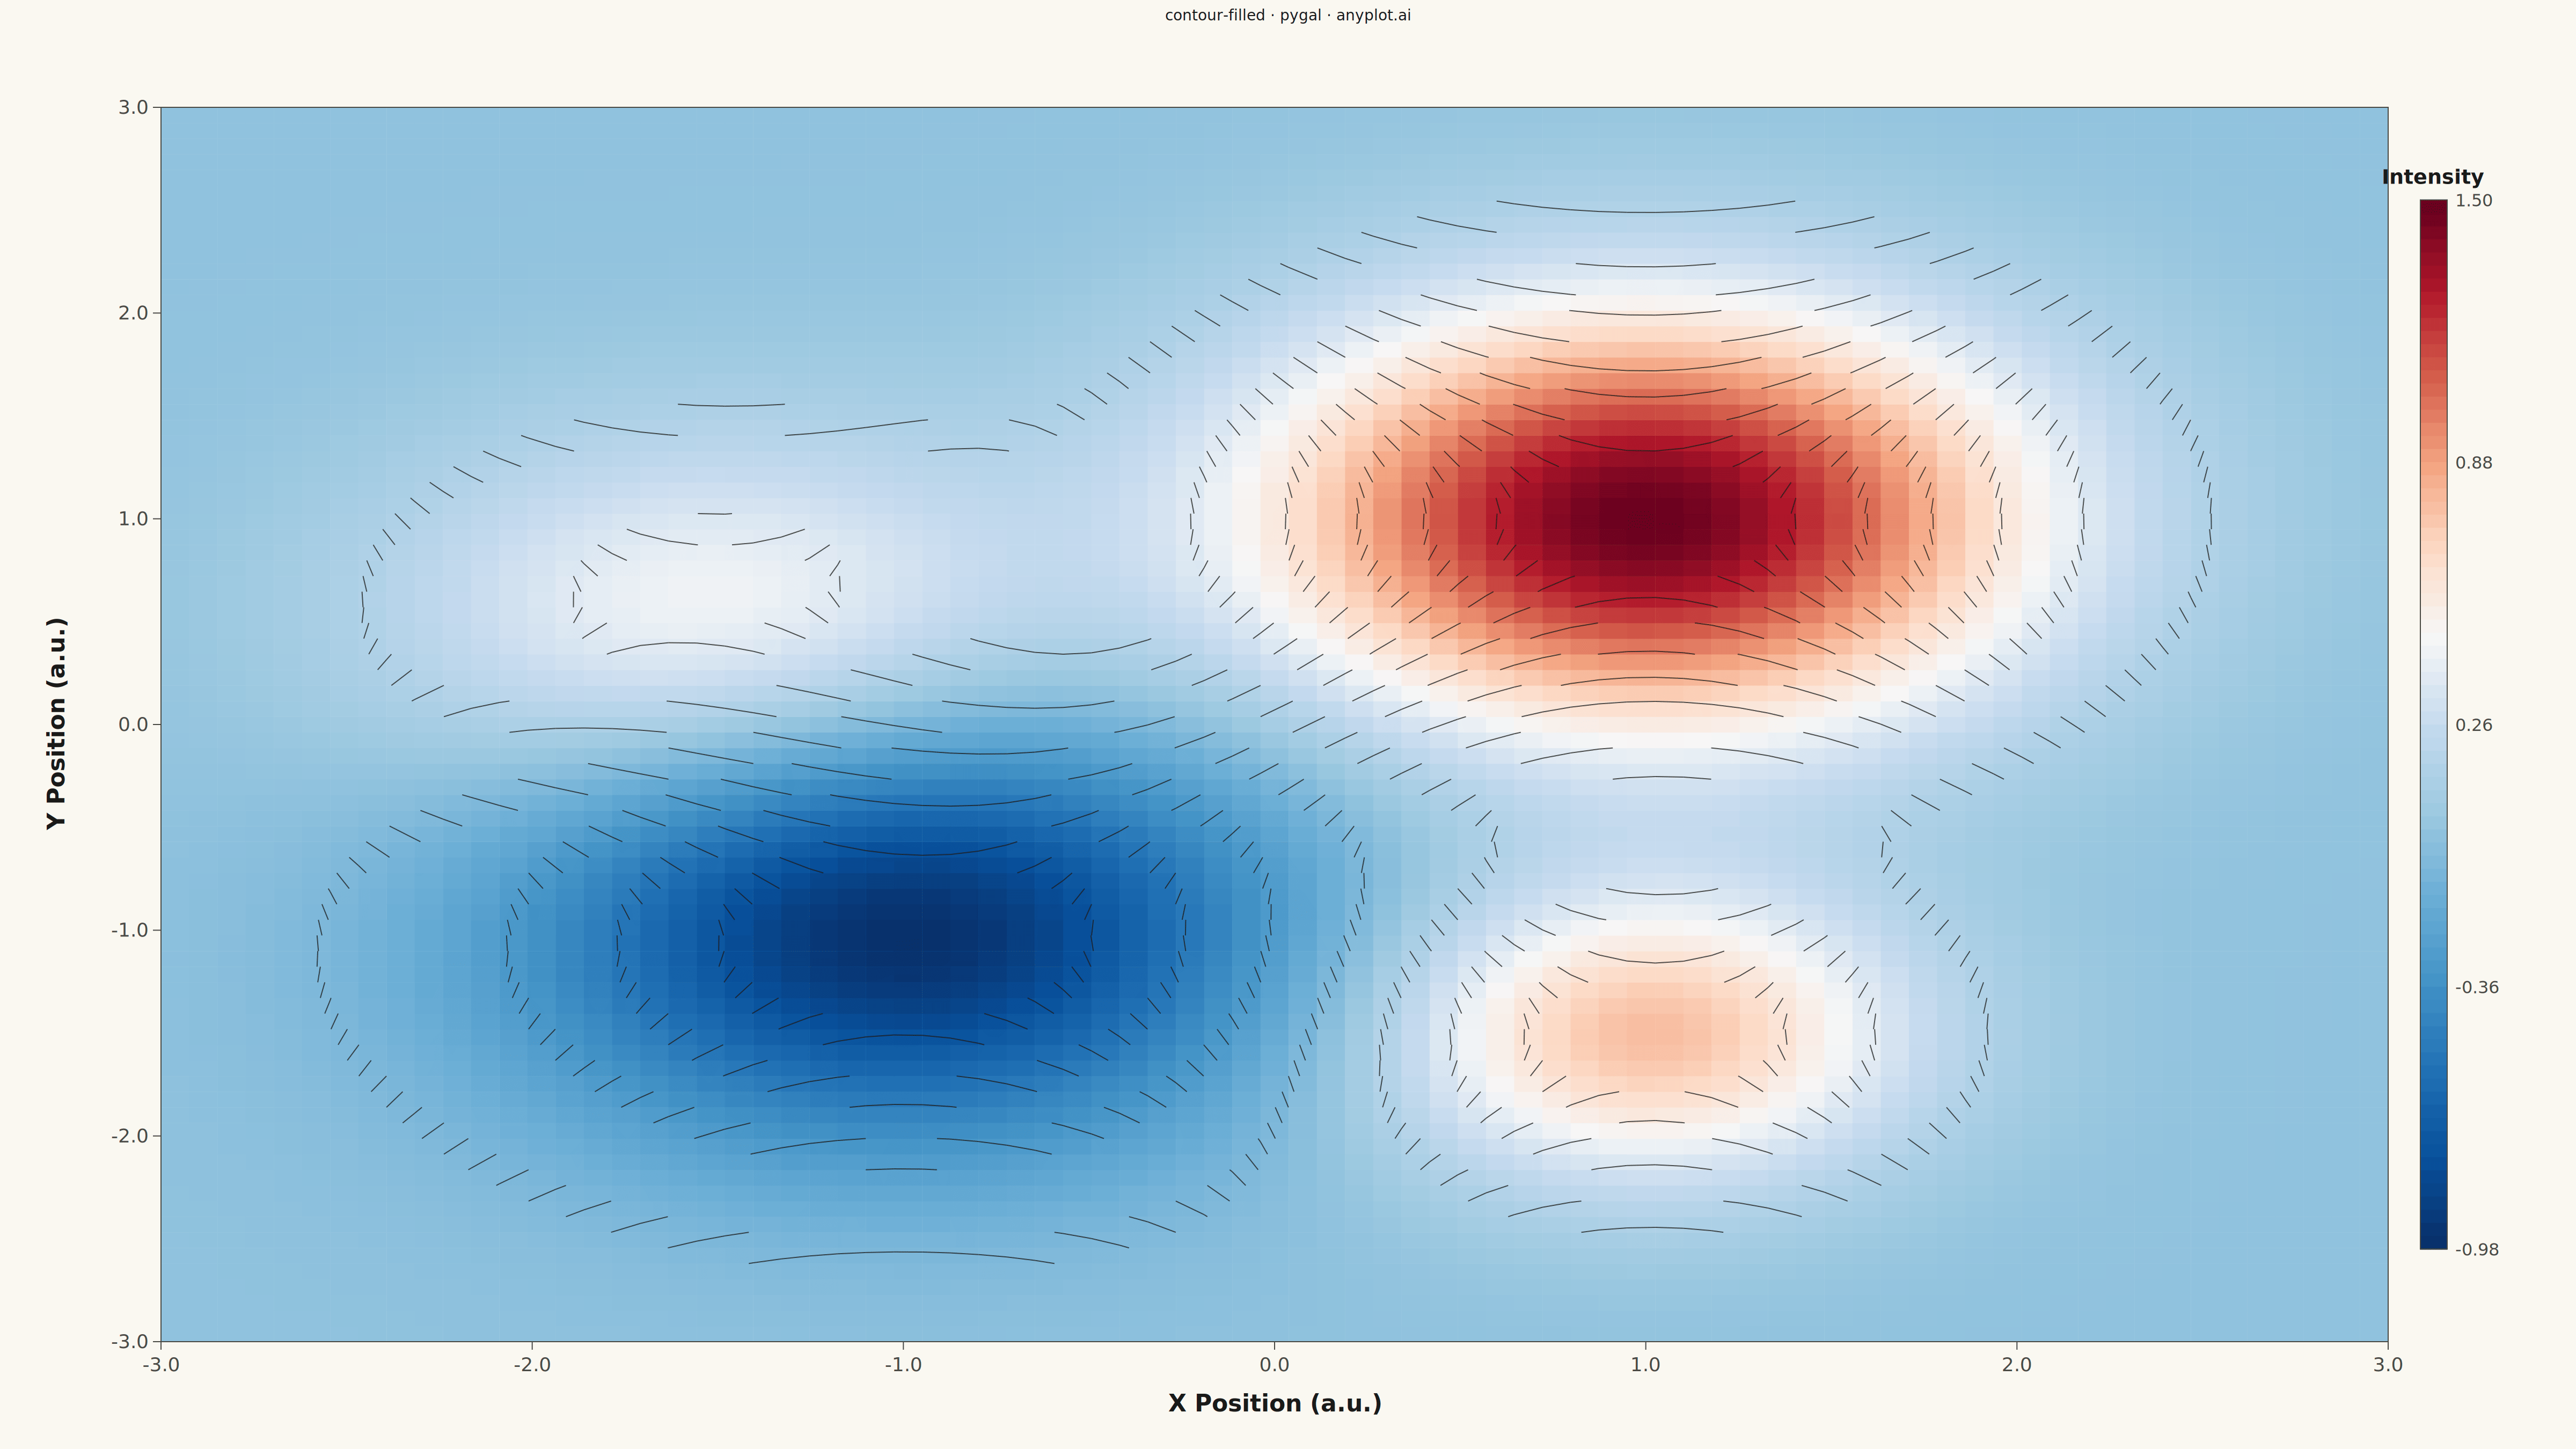
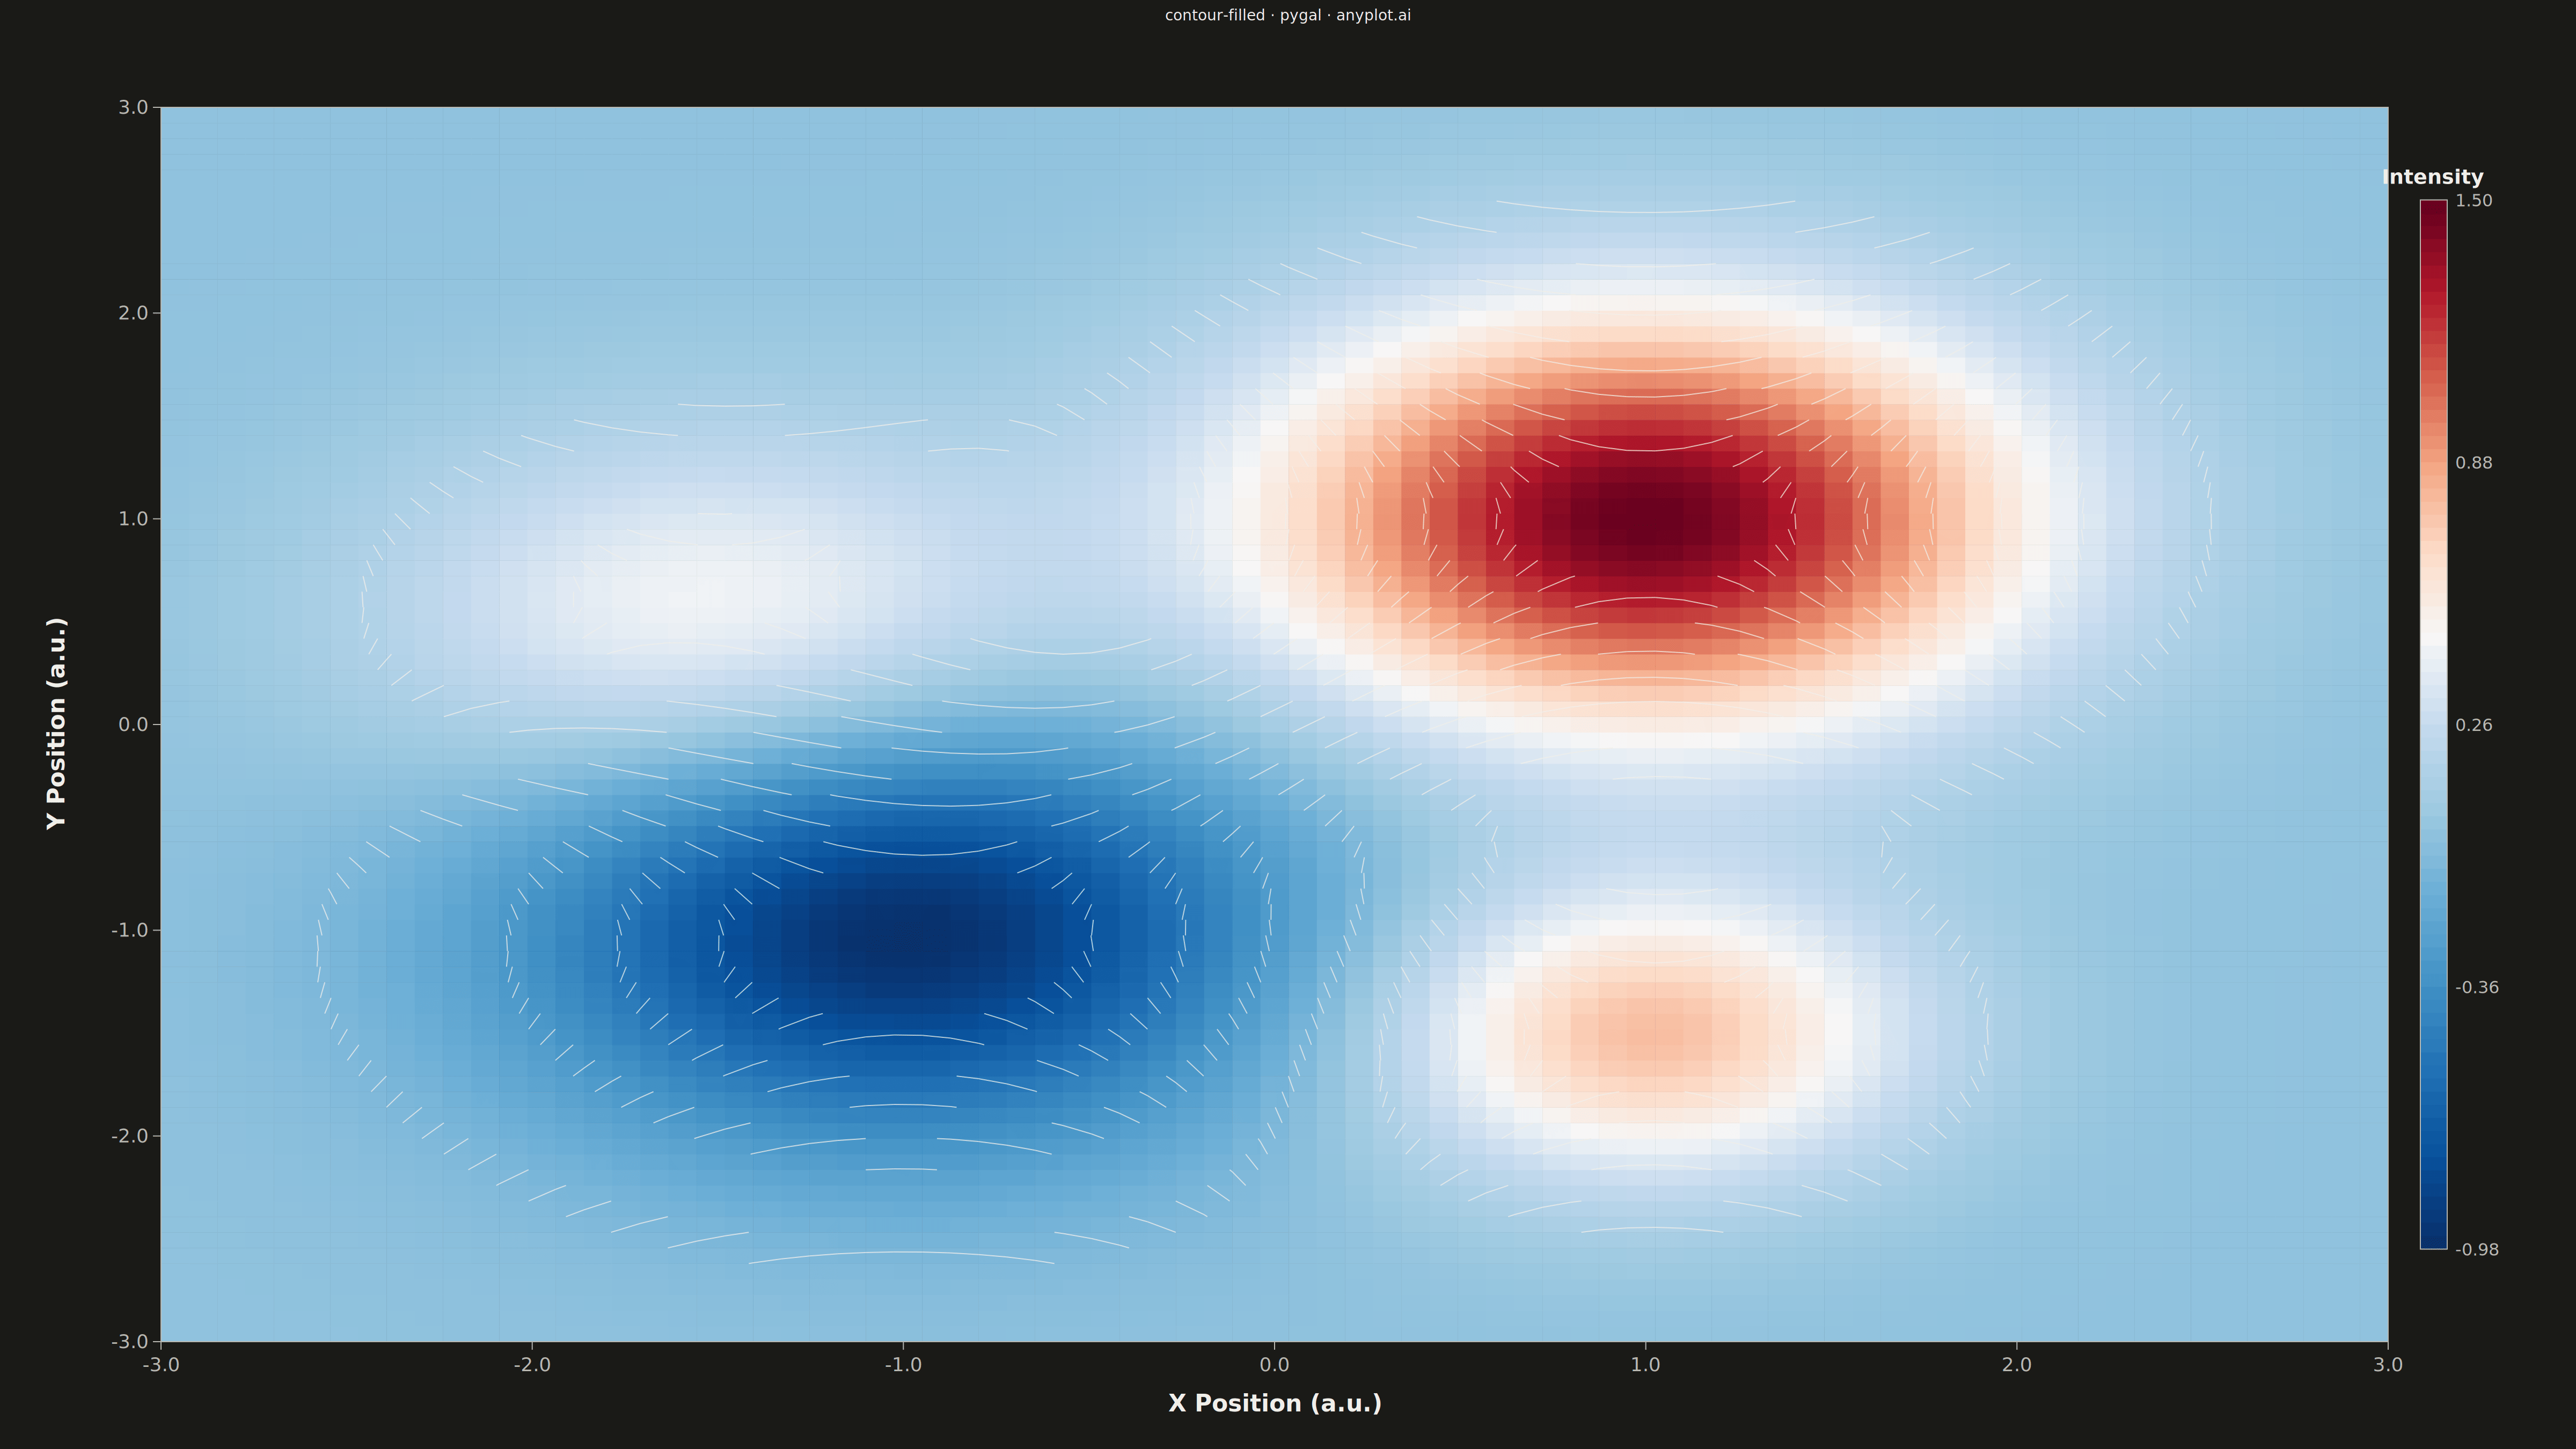
A filled contour plot displays colored regions between level curves of a 2D scalar field, creating a smooth gradient visualization of continuous data. Unlike basic contour plots that show only isolines, filled contours use color bands to represent value ranges, making it easier to perceive gradual changes and identify regions of similar magnitude. This visualization is particularly effective for showing how a quantity varies continuously across a 2D surface.
""" anyplot.ai
contour-filled: Filled Contour Plot
Library: pygal 3.1.0 | Python 3.13.13
Quality: 91/100 | Updated: 2026-05-11
"""

import os
import sys
from pathlib import Path


# Remove script directory from path to avoid name collision with pygal package
_script_dir = str(Path(__file__).parent)
sys.path = [p for p in sys.path if p != _script_dir]

import cairosvg
import numpy as np
import pygal
from pygal.style import Style


THEME = os.getenv("ANYPLOT_THEME", "light")
PAGE_BG = "#FAF8F1" if THEME == "light" else "#1A1A17"
INK = "#1A1A17" if THEME == "light" else "#F0EFE8"
INK_SOFT = "#4A4A44" if THEME == "light" else "#B8B7B0"

# Data: Mathematical function - Gaussian peaks on a 2D surface
np.random.seed(42)
n_points = 80
x = np.linspace(-3, 3, n_points)
y = np.linspace(-3, 3, n_points)
X, Y = np.meshgrid(x, y)

Z = (
    1.5 * np.exp(-((X - 1) ** 2 + (Y - 1) ** 2))
    - 1.0 * np.exp(-((X + 1) ** 2 + (Y + 1) ** 2))
    + 0.8 * np.exp(-((X - 1) ** 2 + (Y + 1.5) ** 2) / 0.5)
    + 0.5 * np.exp(-((X + 1.5) ** 2 + (Y - 0.5) ** 2) / 0.8)
)

z_min, z_max = Z.min(), Z.max()

# Diverging colormap (blue-white-red) - same for both themes, only chrome adapts
colormap = [
    "#08306b",
    "#08519c",
    "#2171b5",
    "#4292c6",
    "#6baed6",
    "#9ecae1",
    "#c6dbef",
    "#f7f7f7",
    "#fddbc7",
    "#f4a582",
    "#d6604d",
    "#b2182b",
    "#67001f",
]

# Style for 4800x2700 canvas
custom_style = Style(
    background=PAGE_BG,
    plot_background=PAGE_BG,
    foreground=INK,
    foreground_strong=INK,
    foreground_subtle=INK_SOFT,
    colors=("#009E73",),
    title_font_size=28,
    legend_font_size=16,
    label_font_size=22,
    value_font_size=18,
    font_family="sans-serif",
)

# Create base XY chart
chart = pygal.XY(
    width=4800,
    height=2700,
    style=custom_style,
    title="contour-filled · pygal · anyplot.ai",
    show_legend=False,
    margin=120,
    margin_top=200,
    margin_bottom=200,
    margin_left=300,
    margin_right=350,
    show_x_labels=False,
    show_y_labels=False,
    show_x_guides=False,
    show_y_guides=False,
    x_title="",
    y_title="",
)

# Plot dimensions (matching chart margins)
plot_x = 300
plot_y = 200
plot_width = 4800 - 300 - 350
plot_height = 2700 - 200 - 200

# Cell size for higher resolution
cell_w = plot_width / (n_points - 1)
cell_h = plot_height / (n_points - 1)

# Build SVG content for filled contour
svg_parts = []

# Draw filled cells
n_levels = 25
levels = np.linspace(z_min, z_max, n_levels + 1)

for i in range(n_points - 1):
    for j in range(n_points - 1):
        cell_val = (Z[i, j] + Z[i, j + 1] + Z[i + 1, j] + Z[i + 1, j + 1]) / 4

        # Inline color interpolation
        if z_max == z_min:
            color = colormap[len(colormap) // 2]
        else:
            norm = max(0, min(1, (cell_val - z_min) / (z_max - z_min)))
            pos = norm * (len(colormap) - 1)
            i1, i2 = int(pos), min(int(pos) + 1, len(colormap) - 1)
            frac = pos - i1
            c1, c2 = colormap[i1], colormap[i2]
            r = int(int(c1[1:3], 16) + (int(c2[1:3], 16) - int(c1[1:3], 16)) * frac)
            g = int(int(c1[3:5], 16) + (int(c2[3:5], 16) - int(c1[3:5], 16)) * frac)
            b = int(int(c1[5:7], 16) + (int(c2[5:7], 16) - int(c1[5:7], 16)) * frac)
            color = f"#{r:02x}{g:02x}{b:02x}"

        cx = plot_x + j * cell_w
        cy = plot_y + plot_height - (i + 1) * cell_h
        svg_parts.append(
            f'<rect x="{cx:.1f}" y="{cy:.1f}" width="{cell_w + 0.5:.1f}" '
            f'height="{cell_h + 0.5:.1f}" fill="{color}" stroke="none"/>'
        )

# Draw contour lines using marching squares (increased opacity to 0.75)
line_levels = np.linspace(z_min, z_max, 12)[1:-1]

for level in line_levels:
    for i in range(n_points - 1):
        for j in range(n_points - 1):
            z00, z01 = Z[i, j], Z[i, j + 1]
            z10, z11 = Z[i + 1, j], Z[i + 1, j + 1]

            case = 0
            if z00 >= level:
                case |= 1
            if z01 >= level:
                case |= 2
            if z11 >= level:
                case |= 4
            if z10 >= level:
                case |= 8

            if case == 0 or case == 15:
                continue

            x0 = plot_x + j * cell_w
            y0 = plot_y + plot_height - (i + 1) * cell_h

            # Edge midpoints
            left_t = 0.5 if abs(z10 - z00) < 1e-10 else (level - z00) / (z10 - z00)
            right_t = 0.5 if abs(z11 - z01) < 1e-10 else (level - z01) / (z11 - z01)
            top_t = 0.5 if abs(z11 - z10) < 1e-10 else (level - z10) / (z11 - z10)
            bottom_t = 0.5 if abs(z01 - z00) < 1e-10 else (level - z00) / (z01 - z00)

            left = (x0, y0 + cell_h * left_t)
            right = (x0 + cell_w, y0 + cell_h * right_t)
            top = (x0 + cell_w * top_t, y0 + cell_h)
            bottom = (x0 + cell_w * bottom_t, y0)

            segments = []
            if case in [1, 14]:
                segments.append((left, bottom))
            elif case in [2, 13]:
                segments.append((bottom, right))
            elif case in [3, 12]:
                segments.append((left, right))
            elif case in [4, 11]:
                segments.append((right, top))
            elif case == 5:
                segments.append((left, top))
                segments.append((bottom, right))
            elif case in [6, 9]:
                segments.append((bottom, top))
            elif case in [7, 8]:
                segments.append((left, top))
            elif case == 10:
                segments.append((left, bottom))
                segments.append((right, top))

            for (x1, y1), (x2, y2) in segments:
                svg_parts.append(
                    f'<line x1="{x1:.1f}" y1="{y1:.1f}" x2="{x2:.1f}" y2="{y2:.1f}" '
                    f'stroke="{INK}" stroke-width="2" stroke-opacity="0.75"/>'
                )

# Axis frame
svg_parts.append(
    f'<rect x="{plot_x}" y="{plot_y}" width="{plot_width}" height="{plot_height}" '
    f'fill="none" stroke="{INK_SOFT}" stroke-width="2"/>'
)

# X-axis labels and ticks
n_x_ticks = 7
for i in range(n_x_ticks):
    frac = i / (n_x_ticks - 1)
    tick_x = plot_x + frac * plot_width
    tick_y = plot_y + plot_height
    val = x[0] + frac * (x[-1] - x[0])
    svg_parts.append(
        f'<line x1="{tick_x:.1f}" y1="{tick_y}" x2="{tick_x:.1f}" y2="{tick_y + 15}" stroke="{INK_SOFT}" stroke-width="2"/>'
    )
    svg_parts.append(
        f'<text x="{tick_x:.1f}" y="{tick_y + 55}" text-anchor="middle" fill="{INK_SOFT}" '
        f'style="font-size:36px;font-family:sans-serif">{val:.1f}</text>'
    )

# X-axis title
svg_parts.append(
    f'<text x="{plot_x + plot_width / 2}" y="{plot_y + plot_height + 130}" text-anchor="middle" '
    f'fill="{INK}" style="font-size:44px;font-weight:bold;font-family:sans-serif">X Position (a.u.)</text>'
)

# Y-axis labels and ticks
n_y_ticks = 7
for i in range(n_y_ticks):
    frac = i / (n_y_ticks - 1)
    tick_y = plot_y + plot_height - frac * plot_height
    tick_x = plot_x
    val = y[0] + frac * (y[-1] - y[0])
    svg_parts.append(
        f'<line x1="{tick_x - 15}" y1="{tick_y:.1f}" x2="{tick_x}" y2="{tick_y:.1f}" stroke="{INK_SOFT}" stroke-width="2"/>'
    )
    svg_parts.append(
        f'<text x="{tick_x - 25}" y="{tick_y + 12:.1f}" text-anchor="end" fill="{INK_SOFT}" '
        f'style="font-size:36px;font-family:sans-serif">{val:.1f}</text>'
    )

# Y-axis title (rotated)
y_title_x = plot_x - 180
y_title_y = plot_y + plot_height / 2
svg_parts.append(
    f'<text x="{y_title_x}" y="{y_title_y}" text-anchor="middle" fill="{INK}" '
    f'style="font-size:44px;font-weight:bold;font-family:sans-serif" '
    f'transform="rotate(-90, {y_title_x}, {y_title_y})">Y Position (a.u.)</text>'
)

# Colorbar
cb_width = 50
cb_height = plot_height * 0.85
cb_x = plot_x + plot_width + 60
cb_y = plot_y + (plot_height - cb_height) / 2

# Colorbar gradient
n_cb_segments = 80
seg_h = cb_height / n_cb_segments
for i in range(n_cb_segments):
    seg_val = z_max - (z_max - z_min) * i / (n_cb_segments - 1)

    # Inline color interpolation for colorbar
    if z_max == z_min:
        seg_color = colormap[len(colormap) // 2]
    else:
        norm = max(0, min(1, (seg_val - z_min) / (z_max - z_min)))
        pos = norm * (len(colormap) - 1)
        i1, i2 = int(pos), min(int(pos) + 1, len(colormap) - 1)
        frac = pos - i1
        c1, c2 = colormap[i1], colormap[i2]
        r = int(int(c1[1:3], 16) + (int(c2[1:3], 16) - int(c1[1:3], 16)) * frac)
        g = int(int(c1[3:5], 16) + (int(c2[3:5], 16) - int(c1[3:5], 16)) * frac)
        b = int(int(c1[5:7], 16) + (int(c2[5:7], 16) - int(c1[5:7], 16)) * frac)
        seg_color = f"#{r:02x}{g:02x}{b:02x}"

    seg_y = cb_y + i * seg_h
    svg_parts.append(
        f'<rect x="{cb_x}" y="{seg_y:.1f}" width="{cb_width}" height="{seg_h + 1:.1f}" fill="{seg_color}"/>'
    )

# Colorbar border
svg_parts.append(
    f'<rect x="{cb_x}" y="{cb_y}" width="{cb_width}" height="{cb_height}" fill="none" stroke="{INK_SOFT}" stroke-width="2"/>'
)

# Colorbar labels
n_cb_labels = 5
for i in range(n_cb_labels):
    frac = i / (n_cb_labels - 1)
    val = z_max - (z_max - z_min) * frac
    label_y = cb_y + frac * cb_height + 12
    svg_parts.append(
        f'<text x="{cb_x + cb_width + 15}" y="{label_y:.1f}" fill="{INK_SOFT}" '
        f'style="font-size:32px;font-family:sans-serif">{val:.2f}</text>'
    )

# Colorbar title
cb_title_x = cb_x + cb_width / 2
cb_title_y = cb_y - 30
svg_parts.append(
    f'<text x="{cb_title_x}" y="{cb_title_y}" text-anchor="middle" fill="{INK}" '
    f'style="font-size:38px;font-weight:bold;font-family:sans-serif">Intensity</text>'
)

# Combine all SVG parts
custom_svg = "\n".join(svg_parts)

# Add dummy data point (required by pygal)
chart.add("", [(0, 0)])

# Render base chart and inject custom SVG
base_svg = chart.render(is_unicode=True)

# Insert custom contour SVG before the closing </svg> tag
output_svg = base_svg.replace("</svg>", f"{custom_svg}\n</svg>")

# Save SVG (optional, for debugging)
with open(f"plot-{THEME}.svg", "w", encoding="utf-8") as f:
    f.write(output_svg)

# Convert to PNG using cairosvg
cairosvg.svg2png(bytestring=output_svg.encode("utf-8"), write_to=f"plot-{THEME}.png")

# Save interactive HTML
html_content = f"""<!DOCTYPE html>
<html>
<head>
    <meta charset="utf-8">
    <title>contour-filled - pygal</title>
    <style>
        body {{ margin: 0; display: flex; justify-content: center; align-items: center; min-height: 100vh; background: {PAGE_BG}; }}
        .chart {{ max-width: 100%; height: auto; }}
    </style>
</head>
<body>
    <figure class="chart">
        {output_svg}
    </figure>
</body>
</html>
"""

with open(f"plot-{THEME}.html", "w", encoding="utf-8") as f:
    f.write(html_content)
Runnable source as JSON, for any HTTP client: https://api.anyplot.ai/specs/contour-filled/pygal/code. Any spec id and library id listed in llms-full.txt fit the same URL shape; every URL below is complete and callable.
{
  "spec_id": "contour-filled",
  "language": "python",
  "library": "pygal",
  "page": "https://anyplot.ai/contour-filled/python/pygal",
  "hub": "https://anyplot.ai/contour-filled",
  "code_json": "https://api.anyplot.ai/specs/contour-filled/pygal/code",
  "spec_json": "https://api.anyplot.ai/specs/contour-filled",
  "render_light_png": "https://storage.googleapis.com/anyplot-images/plots/contour-filled/python/pygal/plot-light.png",
  "render_dark_png": "https://storage.googleapis.com/anyplot-images/plots/contour-filled/python/pygal/plot-dark.png",
  "interactive_light_html": "https://storage.googleapis.com/anyplot-images/plots/contour-filled/python/pygal/plot-light.html",
  "interactive_dark_html": "https://storage.googleapis.com/anyplot-images/plots/contour-filled/python/pygal/plot-dark.html",
  "quality_score": 91.0,
  "license": "MIT",
  "guide": "https://anyplot.ai/llms.txt"
}
Part of Filled Contour Plot on anyplot.ai.