The same plot in 14 other libraries — JavaScript: Chart.js, D3.js, Apache ECharts, MUI X Charts; Python: Altair, Bokeh, lets-plot, Matplotlib, Plotly, plotnine, Pygal, Seaborn; R: ggplot2; Julia: Makie.jl. Compare all 15 side by side: Filled Contour Plot in Python, R, Julia and JavaScript.
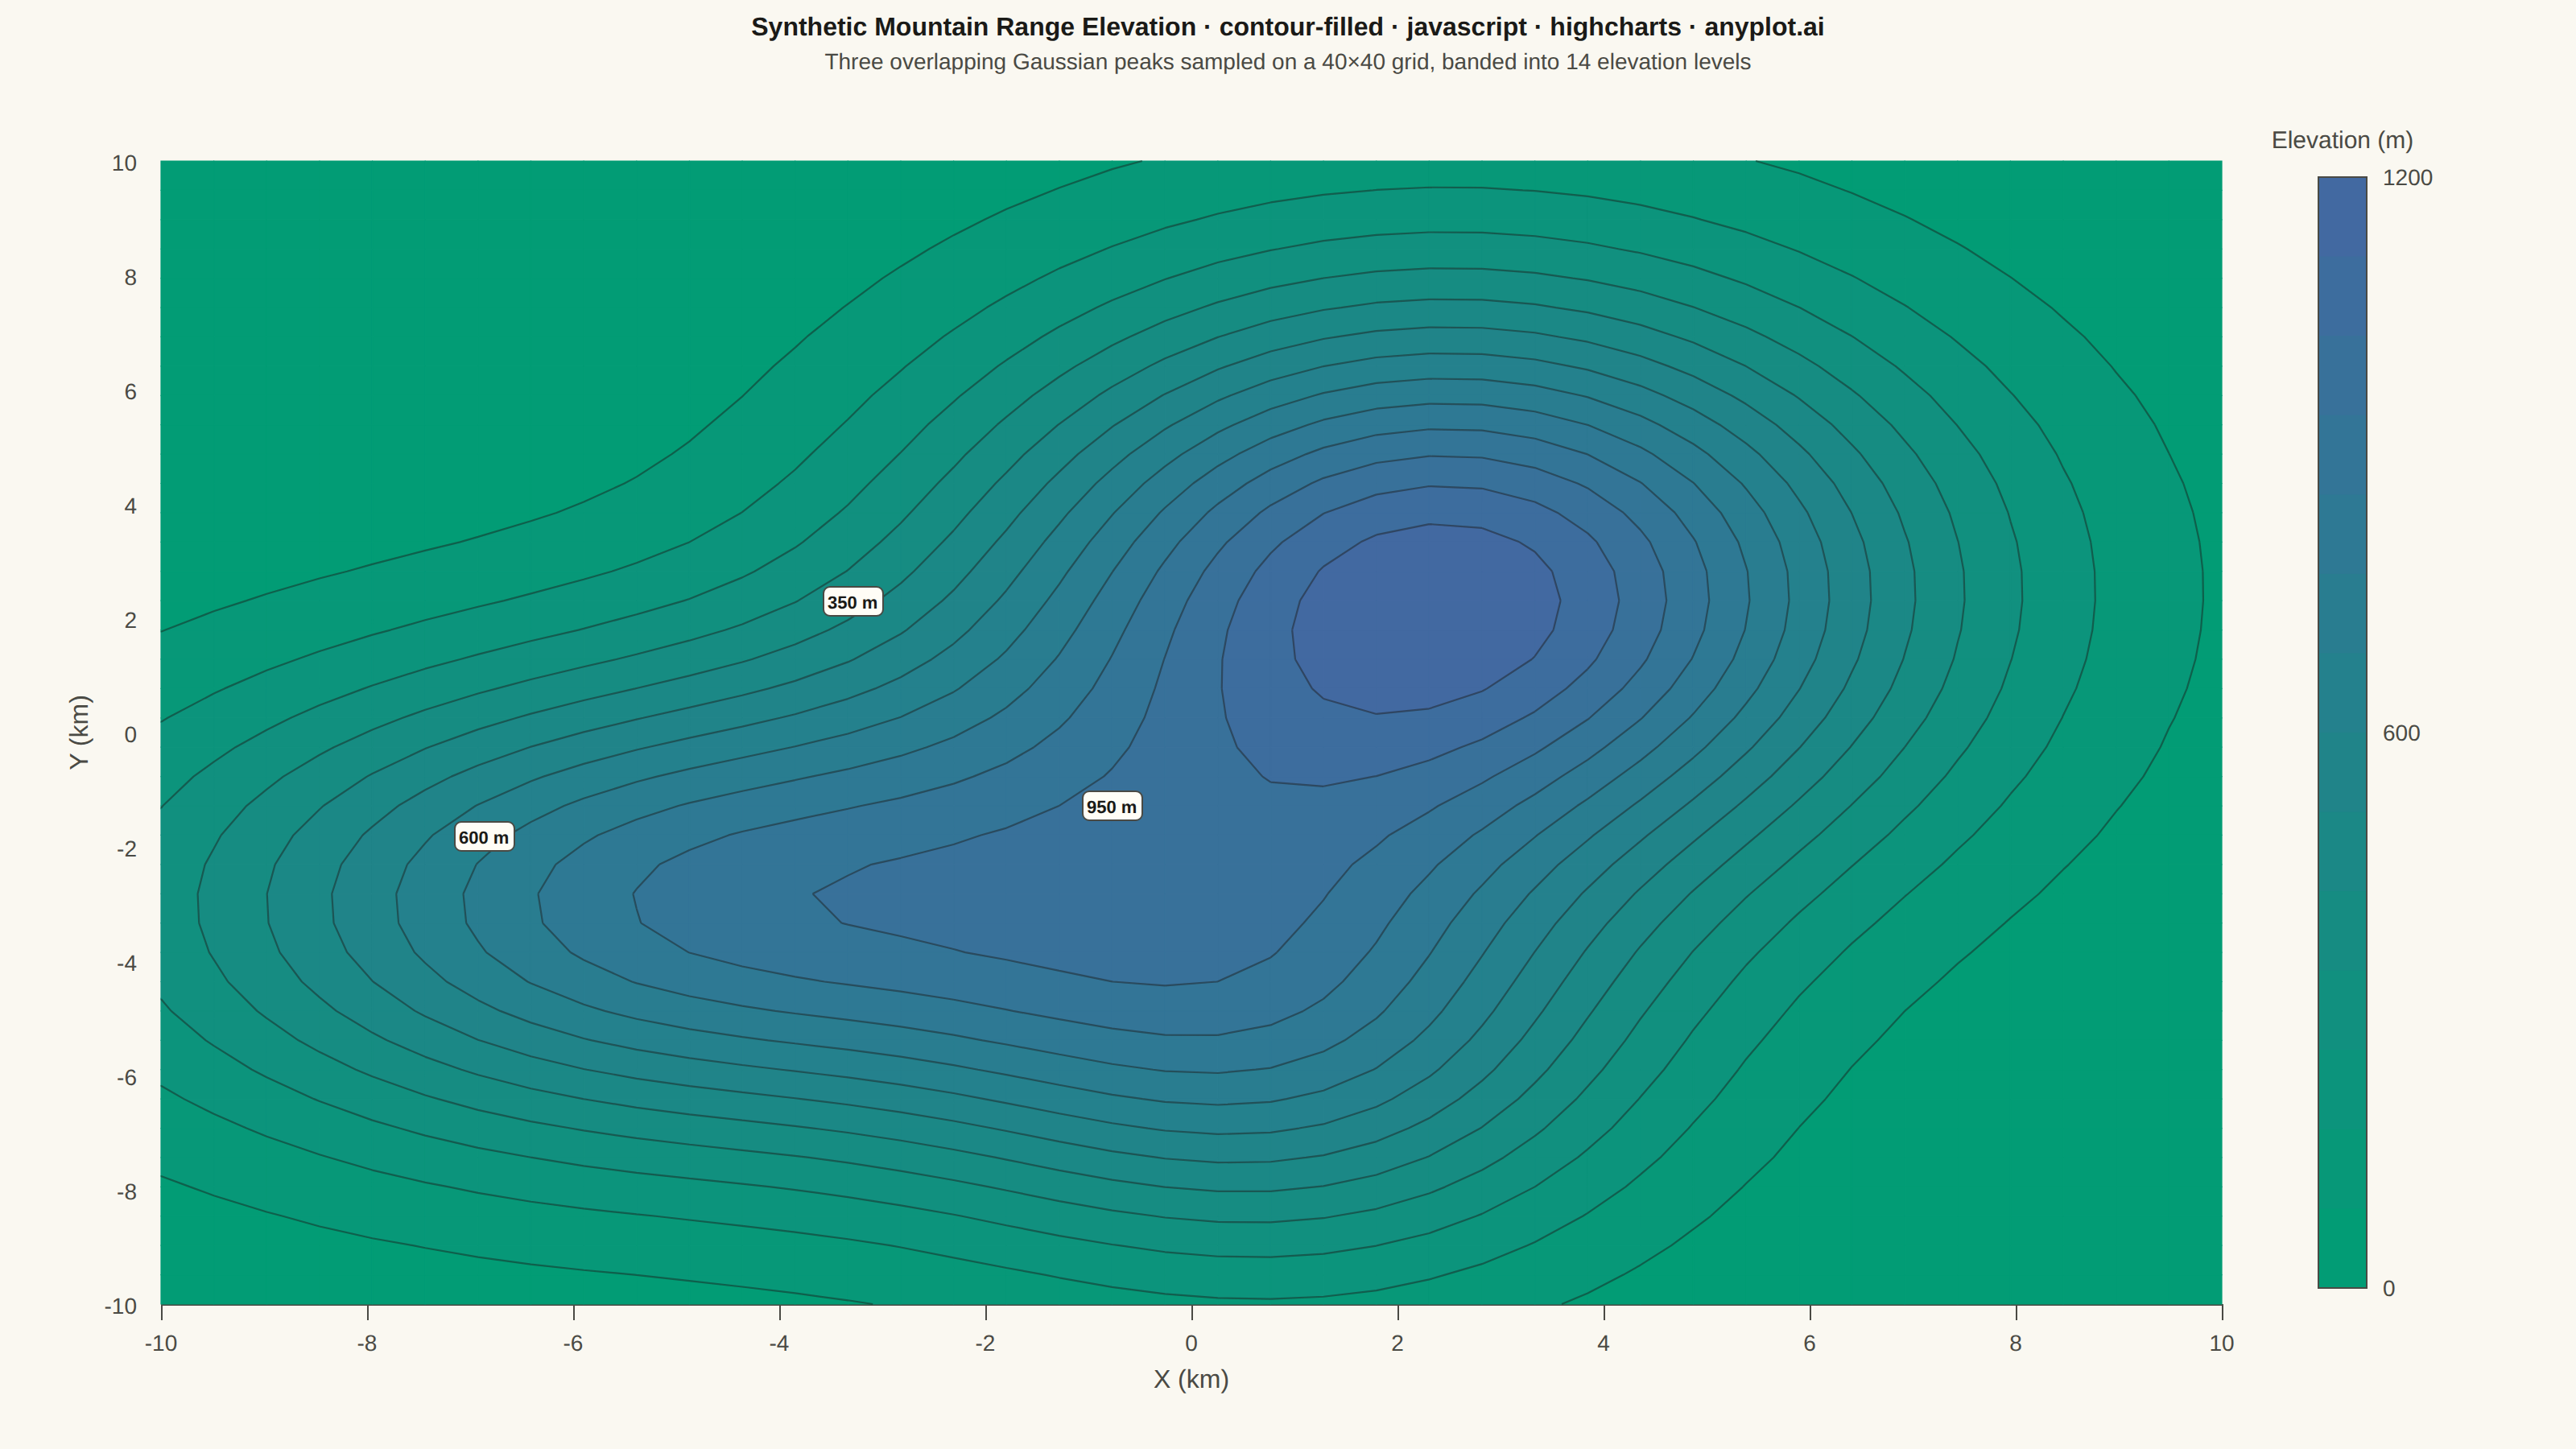
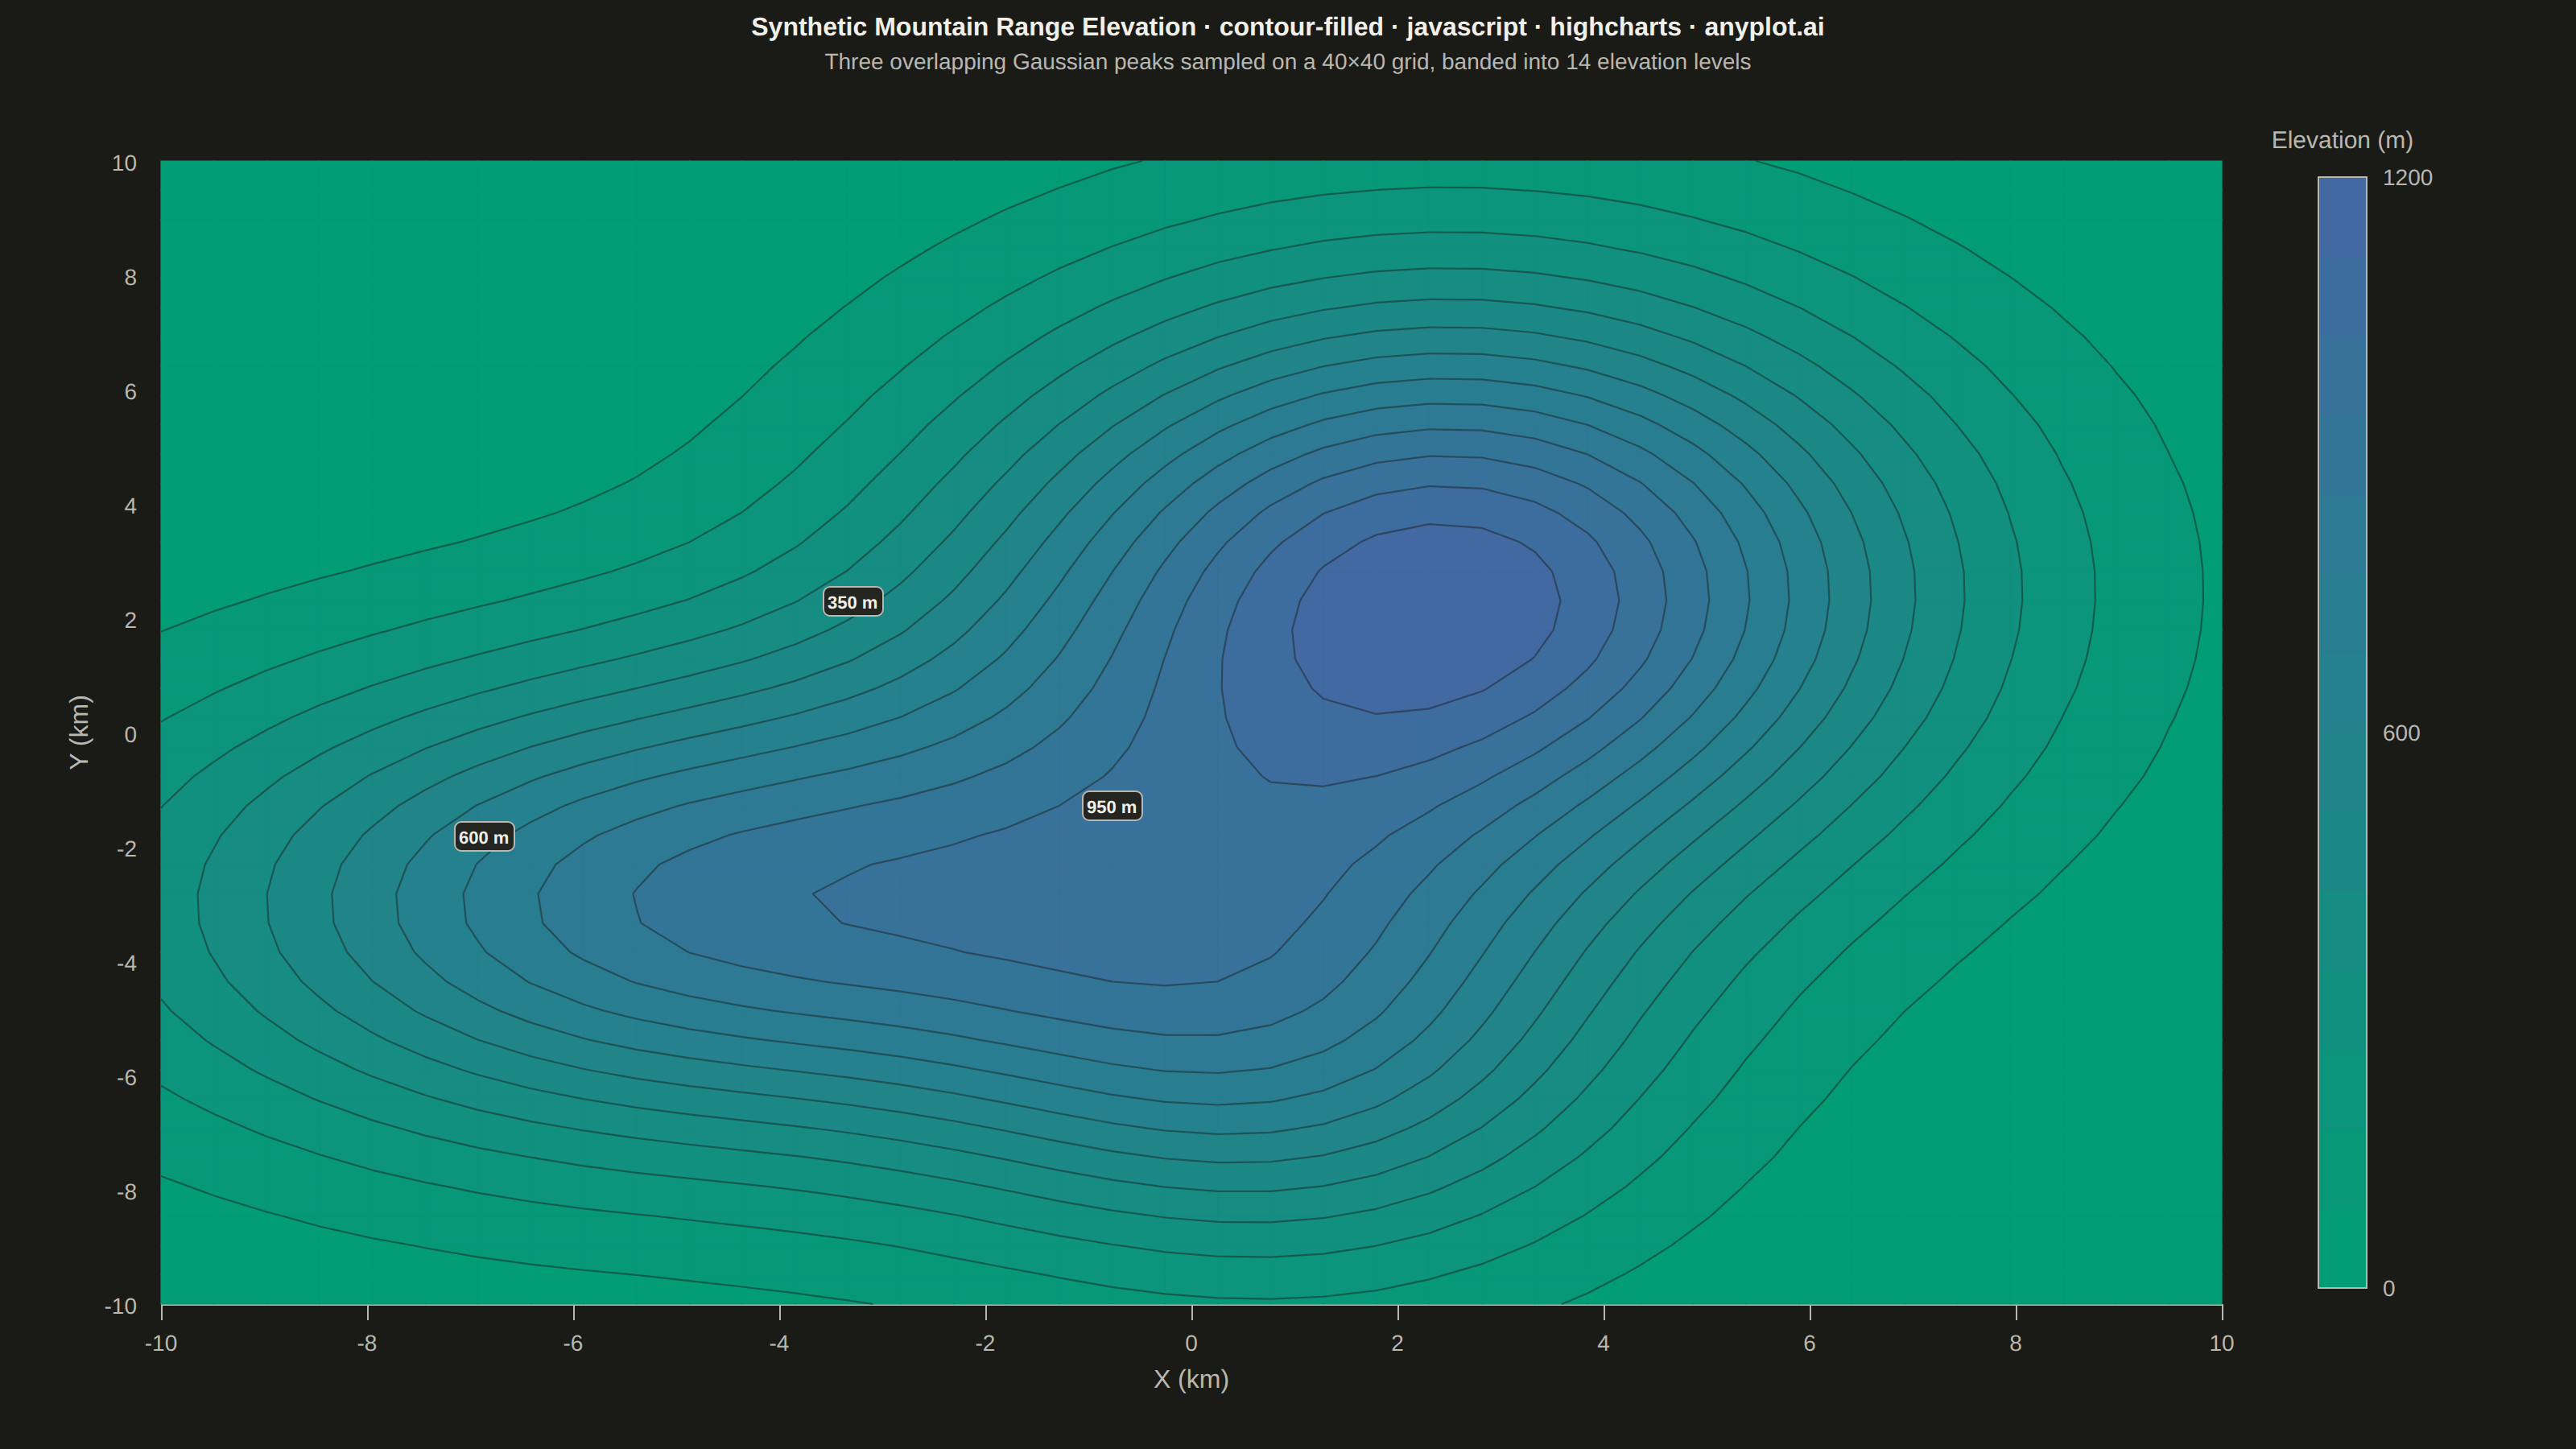
A filled contour plot displays colored regions between level curves of a 2D scalar field, creating a smooth gradient visualization of continuous data. Unlike basic contour plots that show only isolines, filled contours use color bands to represent value ranges, making it easier to perceive gradual changes and identify regions of similar magnitude. This visualization is particularly effective for showing how a quantity varies continuously across a 2D surface.
// anyplot.ai
// contour-filled: Filled Contour Plot
// Library: highcharts 12.6.0 | JavaScript 22.23.2
// Quality: 91/100 | Created: 2026-09-04

const t = window.ANYPLOT_TOKENS;

// --- Data: synthetic mountain-range elevation field on a regular grid ------
// The core Highcharts bundle has no heatmap/colorAxis module loaded, so the
// filled isobands are computed by hand (marching-squares style quad clipping)
// and drawn with the SVG renderer, same technique anyplot's other
// module-less Highcharts grids use.
const NX = 40;
const NY = 40;
const X_MIN = -10;
const X_MAX = 10;
const Y_MIN = -10;
const Y_MAX = 10;
const LEVELS = 14;

const xs = Array.from({ length: NX }, (_, i) => X_MIN + (i * (X_MAX - X_MIN)) / (NX - 1));
const ys = Array.from({ length: NY }, (_, j) => Y_MIN + (j * (Y_MAX - Y_MIN)) / (NY - 1));

function peak(x, y, amp, cx, cy, sx, sy) {
  return amp * Math.exp(-(((x - cx) ** 2) / (2 * sx * sx) + ((y - cy) ** 2) / (2 * sy * sy)));
}

function elevation(x, y) {
  return (
    peak(x, y, 1150, 2.5, 2.5, 3.2, 3.6) +
    peak(x, y, 850, -4.5, -3, 3.8, 3) +
    peak(x, y, 500, 1, -5.5, 2.4, 2.8)
  );
}

// Z[row][col] — row indexes ys, col indexes xs.
const Z = ys.map((y) => xs.map((x) => elevation(x, y)));

let zMin = Infinity;
let zMax = -Infinity;
for (const row of Z) {
  for (const v of row) {
    if (v < zMin) zMin = v;
    if (v > zMax) zMax = v;
  }
}
const levelBounds = Array.from({ length: LEVELS + 1 }, (_, i) => zMin + (i * (zMax - zMin)) / LEVELS);

// --- Color: imprint_seq — brand green (low) to blue (high) elevation -------
function hexToRgb(hex) {
  return [parseInt(hex.slice(1, 3), 16), parseInt(hex.slice(3, 5), 16), parseInt(hex.slice(5, 7), 16)];
}
const SEQ_LOW = hexToRgb(t.seq[0]);
const SEQ_HIGH = hexToRgb(t.seq[1]);

function bandColor(bandIndex) {
  const frac = (bandIndex + 0.5) / LEVELS;
  const lerp = (a, b) => Math.round(a + (b - a) * frac);
  return `rgb(${lerp(SEQ_LOW[0], SEQ_HIGH[0])},${lerp(SEQ_LOW[1], SEQ_HIGH[1])},${lerp(SEQ_LOW[2], SEQ_HIGH[2])})`;
}

// --- Isoband extraction: clip each grid quad against a value band ----------
// Sutherland-Hodgman clipping against z >= lo, then z <= hi, interpolating
// along the quad's edges — the standard "conrec"-style shortcut for turning
// a scalar grid into smooth filled contour polygons per cell.
function clipHalfPlane(poly, inside, crossing) {
  if (poly.length === 0) return poly;
  const out = [];
  for (let i = 0; i < poly.length; i++) {
    const curr = poly[i];
    const prev = poly[(i + poly.length - 1) % poly.length];
    const currIn = inside(curr);
    const prevIn = inside(prev);
    if (currIn) {
      if (!prevIn) out.push(crossing(prev, curr));
      out.push(curr);
    } else if (prevIn) {
      out.push(crossing(prev, curr));
    }
  }
  return out;
}

function crossAt(p1, p2, level) {
  const f = (level - p1.z) / (p2.z - p1.z);
  return { x: p1.x + f * (p2.x - p1.x), y: p1.y + f * (p2.y - p1.y), z: level };
}

function bandPolygon(quad, lo, hi) {
  let poly = quad;
  if (lo > -Infinity) poly = clipHalfPlane(poly, (p) => p.z >= lo, (a, b) => crossAt(a, b, lo));
  if (poly.length >= 3 && hi < Infinity) poly = clipHalfPlane(poly, (p) => p.z <= hi, (a, b) => crossAt(a, b, hi));
  return poly;
}

// --- Isolines: crisp per-level boundary lines overlaid on the bands --------
// A cell edge crosses `level` when its two endpoints straddle it; exactly two
// (or, at an ambiguous saddle, four) of the quad's four edges cross for any
// given level, and connecting the crossing points traces the isoline through
// that cell — the classic marching-squares result without needing the full
// 16-case lookup table.
function edgeCrossing(p1, p2, level) {
  const f = (level - p1.z) / (p2.z - p1.z);
  return { x: p1.x + f * (p2.x - p1.x), y: p1.y + f * (p2.y - p1.y) };
}

function cellContourSegments(a, b, c, d, level) {
  const crosses = (p1, p2) => p1.z >= level !== p2.z >= level;
  const top = crosses(a, b) ? edgeCrossing(a, b, level) : null;
  const right = crosses(b, c) ? edgeCrossing(b, c, level) : null;
  const bottom = crosses(d, c) ? edgeCrossing(d, c, level) : null;
  const left = crosses(a, d) ? edgeCrossing(a, d, level) : null;
  const present = [top, right, bottom, left].filter(Boolean);
  if (present.length === 2) return [[present[0], present[1]]];
  if (present.length === 4) {
    // Saddle cell (diagonal corners on the same side of the level): resolve
    // the ambiguity from corner a so pairing stays consistent cell-to-cell.
    return a.z >= level
      ? [
          [top, left],
          [right, bottom],
        ]
      : [
          [top, right],
          [left, bottom],
        ];
  }
  return [];
}

// --- Title (fontsize scaled off the 67-char baseline) -----------------------
const TITLE_TEXT = 'Synthetic Mountain Range Elevation · contour-filled · javascript · highcharts · anyplot.ai';
const TITLE_FS = Math.max(Math.round(22 * Math.min(1, 67 / TITLE_TEXT.length)), 14);

// Fixed, theme-independent isoline stroke (not derived from t.ink): the data
// colors are already identical between light/dark, so the boundary lines
// must be too, or they read faint on light-theme bands and bright on
// dark-theme bands (a prior review flagged exactly this).
const ISOLINE_STROKE = 'rgba(26, 26, 23, 0.45)';
// Elevation levels get labeled with a "nice" round number rather than the
// raw computed boundary, and only a few are called out directly on the map.
const roundNice = (v) => Math.round(v / 50) * 50;
const LABELED_LEVEL_INDICES = new Set([
  Math.round(LEVELS * 0.25),
  Math.round(LEVELS * 0.5),
  Math.round(LEVELS * 0.75),
]);

const drawn = [];
function clearDrawn() {
  drawn.forEach((el) => {
    try {
      el.destroy();
    } catch (_err) {
      // already removed
    }
  });
  drawn.length = 0;
}

function drawAll() {
  const chart = this;
  clearDrawn();
  const r = chart.renderer;
  const xAxis = chart.xAxis[0];
  const yAxis = chart.yAxis[0];

  // Filled isobands, cell by cell.
  for (let j = 0; j < NY - 1; j++) {
    for (let i = 0; i < NX - 1; i++) {
      const quad = [
        { x: xs[i], y: ys[j], z: Z[j][i] },
        { x: xs[i + 1], y: ys[j], z: Z[j][i + 1] },
        { x: xs[i + 1], y: ys[j + 1], z: Z[j + 1][i + 1] },
        { x: xs[i], y: ys[j + 1], z: Z[j + 1][i] },
      ];
      const cellMin = Math.min(quad[0].z, quad[1].z, quad[2].z, quad[3].z);
      const cellMax = Math.max(quad[0].z, quad[1].z, quad[2].z, quad[3].z);

      for (let b = 0; b < LEVELS; b++) {
        const lo = b === 0 ? -Infinity : levelBounds[b];
        const hi = b === LEVELS - 1 ? Infinity : levelBounds[b + 1];
        if (hi < cellMin || lo > cellMax) continue;

        const poly = bandPolygon(quad, lo, hi);
        if (poly.length < 3) continue;

        const fill = bandColor(b);
        const pathArr = [];
        poly.forEach((p, idx) => {
          pathArr.push(idx === 0 ? 'M' : 'L', xAxis.toPixels(p.x), yAxis.toPixels(p.y));
        });
        pathArr.push('Z');
        drawn.push(
          r
            .path(pathArr)
            .attr({ fill, stroke: fill, 'stroke-width': 0.6, zIndex: 2 })
            .add()
        );
      }
    }
  }

  // Isolines at each interior level boundary — precise level identification
  // on top of the color bands (spec: "consider overlaying contour lines").
  for (let lvlIdx = 1; lvlIdx < LEVELS; lvlIdx++) {
    const level = levelBounds[lvlIdx];
    const pathArr = [];
    const segments = [];
    for (let j = 0; j < NY - 1; j++) {
      for (let i = 0; i < NX - 1; i++) {
        const a = { x: xs[i], y: ys[j], z: Z[j][i] };
        const b = { x: xs[i + 1], y: ys[j], z: Z[j][i + 1] };
        const c = { x: xs[i + 1], y: ys[j + 1], z: Z[j + 1][i + 1] };
        const d = { x: xs[i], y: ys[j + 1], z: Z[j + 1][i] };
        for (const [p1, p2] of cellContourSegments(a, b, c, d, level)) {
          pathArr.push('M', xAxis.toPixels(p1.x), yAxis.toPixels(p1.y), 'L', xAxis.toPixels(p2.x), yAxis.toPixels(p2.y));
          segments.push([p1, p2]);
        }
      }
    }
    if (!pathArr.length) continue;
    drawn.push(
      r
        .path(pathArr)
        .attr({ fill: 'none', stroke: ISOLINE_STROKE, 'stroke-width': 1.1, zIndex: 3 })
        .add()
    );

    // Direct elevation callout on a few isolines — picks the longest segment
    // for that level as a stable, uncluttered anchor point for the label.
    if (LABELED_LEVEL_INDICES.has(lvlIdx)) {
      let longest = segments[0];
      let longestLenSq = -1;
      for (const seg of segments) {
        const dx = seg[1].x - seg[0].x;
        const dy = seg[1].y - seg[0].y;
        const lenSq = dx * dx + dy * dy;
        if (lenSq > longestLenSq) {
          longestLenSq = lenSq;
          longest = seg;
        }
      }
      const midX = xAxis.toPixels((longest[0].x + longest[1].x) / 2);
      const midY = yAxis.toPixels((longest[0].y + longest[1].y) / 2);
      drawn.push(
        r
          .label(`${roundNice(level)} m`, midX, midY, 'rect')
          .attr({ fill: t.elevatedBg, stroke: t.inkSoft, 'stroke-width': 1, r: 4, padding: 3, zIndex: 4 })
          .css({ color: t.ink, fontSize: '11px', fontWeight: '600' })
          .add()
      );
    }
  }

  // Discrete colorbar (right of the plot area) — one swatch per band.
  const barLeft = chart.plotLeft + chart.plotWidth + 60;
  const barWidth = 30;
  const barTop = chart.plotTop + 10;
  const barHeight = chart.plotHeight - 20;
  const swatchH = barHeight / LEVELS;

  for (let b = LEVELS - 1; b >= 0; b--) {
    const yTop = barTop + (LEVELS - 1 - b) * swatchH;
    drawn.push(
      r
        .rect(barLeft, yTop, barWidth, swatchH + 0.5)
        .attr({ fill: bandColor(b), zIndex: 2 })
        .add()
    );
  }
  drawn.push(
    r
      .rect(barLeft, barTop, barWidth, barHeight)
      .attr({ fill: 'none', stroke: t.inkSoft, 'stroke-width': 1, zIndex: 3 })
      .add()
  );
  [
    [roundNice(zMax), 0],
    [roundNice((zMin + zMax) / 2), 0.5],
    [roundNice(zMin), 1],
  ].forEach(([value, frac]) => {
    drawn.push(
      r
        .text(value.toString(), barLeft + barWidth + 10, barTop + frac * barHeight + 5)
        .attr({ align: 'left', zIndex: 3 })
        .css({ color: t.inkSoft, fontSize: '14px' })
        .add()
    );
  });
  drawn.push(
    r
      .text('Elevation (m)', barLeft + barWidth / 2, barTop - 18)
      .attr({ align: 'center', zIndex: 3 })
      .css({ color: t.inkSoft, fontSize: '15px', fontWeight: '500' })
      .add()
  );
}

// Sparse invisible scatter layer so hovering the surface still gives a real
// Highcharts tooltip with the exact elevation at nearby grid points.
const SAMPLE_STRIDE = 4;
const samplePoints = [];
for (let j = 0; j < NY; j += SAMPLE_STRIDE) {
  for (let i = 0; i < NX; i += SAMPLE_STRIDE) {
    samplePoints.push({ x: xs[i], y: ys[j], elevation: Z[j][i] });
  }
}

Highcharts.chart('container', {
  chart: {
    type: 'scatter',
    backgroundColor: 'transparent',
    animation: false,
    style: { fontFamily: 'inherit' },
    margin: [100, 220, 90, 100],
    events: { load: drawAll, redraw: drawAll },
  },
  credits: { enabled: false },
  title: {
    text: TITLE_TEXT,
    style: { color: t.ink, fontSize: TITLE_FS + 'px', fontWeight: '600' },
  },
  subtitle: {
    text: 'Three overlapping Gaussian peaks sampled on a 40×40 grid, banded into 14 elevation levels',
    style: { color: t.inkSoft, fontSize: '14px' },
  },
  xAxis: {
    title: { text: 'X (km)', style: { color: t.inkSoft, fontSize: '16px' } },
    min: X_MIN,
    max: X_MAX,
    lineColor: t.inkSoft,
    tickColor: t.inkSoft,
    gridLineWidth: 0,
    labels: { style: { color: t.inkSoft, fontSize: '14px' } },
  },
  yAxis: {
    title: { text: 'Y (km)', style: { color: t.inkSoft, fontSize: '16px' } },
    min: Y_MIN,
    max: Y_MAX,
    lineColor: t.inkSoft,
    tickColor: t.inkSoft,
    gridLineWidth: 0,
    labels: { style: { color: t.inkSoft, fontSize: '14px' } },
  },
  legend: { enabled: false },
  tooltip: {
    enabled: true,
    backgroundColor: t.elevatedBg,
    borderColor: t.inkSoft,
    borderRadius: 6,
    style: { color: t.ink, fontSize: '13px' },
    formatter: function () {
      const p = this.point;
      return `<b>(${p.x.toFixed(1)}, ${p.y.toFixed(1)}) km</b><br/>Elevation: ${Math.round(p.elevation)} m`;
    },
  },
  plotOptions: {
    series: { animation: false },
    scatter: {
      enableMouseTracking: true,
      stickyTracking: false,
      marker: {
        enabled: true,
        symbol: 'circle',
        radius: 14,
        fillColor: 'rgba(0,0,0,0.001)',
        lineWidth: 0,
        states: { hover: { enabled: false } },
      },
    },
  },
  series: [
    {
      type: 'scatter',
      name: 'Elevation sample',
      data: samplePoints,
      zIndex: 1,
    },
  ],
});
Runnable source as JSON, for any HTTP client: https://api.anyplot.ai/specs/contour-filled/highcharts/code. Any spec id and library id listed in llms-full.txt fit the same URL shape; every URL below is complete and callable.
{
  "spec_id": "contour-filled",
  "language": "javascript",
  "library": "highcharts",
  "page": "https://anyplot.ai/contour-filled/javascript/highcharts",
  "hub": "https://anyplot.ai/contour-filled",
  "code_json": "https://api.anyplot.ai/specs/contour-filled/highcharts/code",
  "spec_json": "https://api.anyplot.ai/specs/contour-filled",
  "render_light_png": "https://storage.googleapis.com/anyplot-images/plots/contour-filled/javascript/highcharts/plot-light.png",
  "render_dark_png": "https://storage.googleapis.com/anyplot-images/plots/contour-filled/javascript/highcharts/plot-dark.png",
  "interactive_light_html": "https://storage.googleapis.com/anyplot-images/plots/contour-filled/javascript/highcharts/plot-light.html",
  "interactive_dark_html": "https://storage.googleapis.com/anyplot-images/plots/contour-filled/javascript/highcharts/plot-dark.html",
  "quality_score": 91.0,
  "license": "MIT",
  "guide": "https://anyplot.ai/llms.txt"
}
Part of Filled Contour Plot on anyplot.ai.