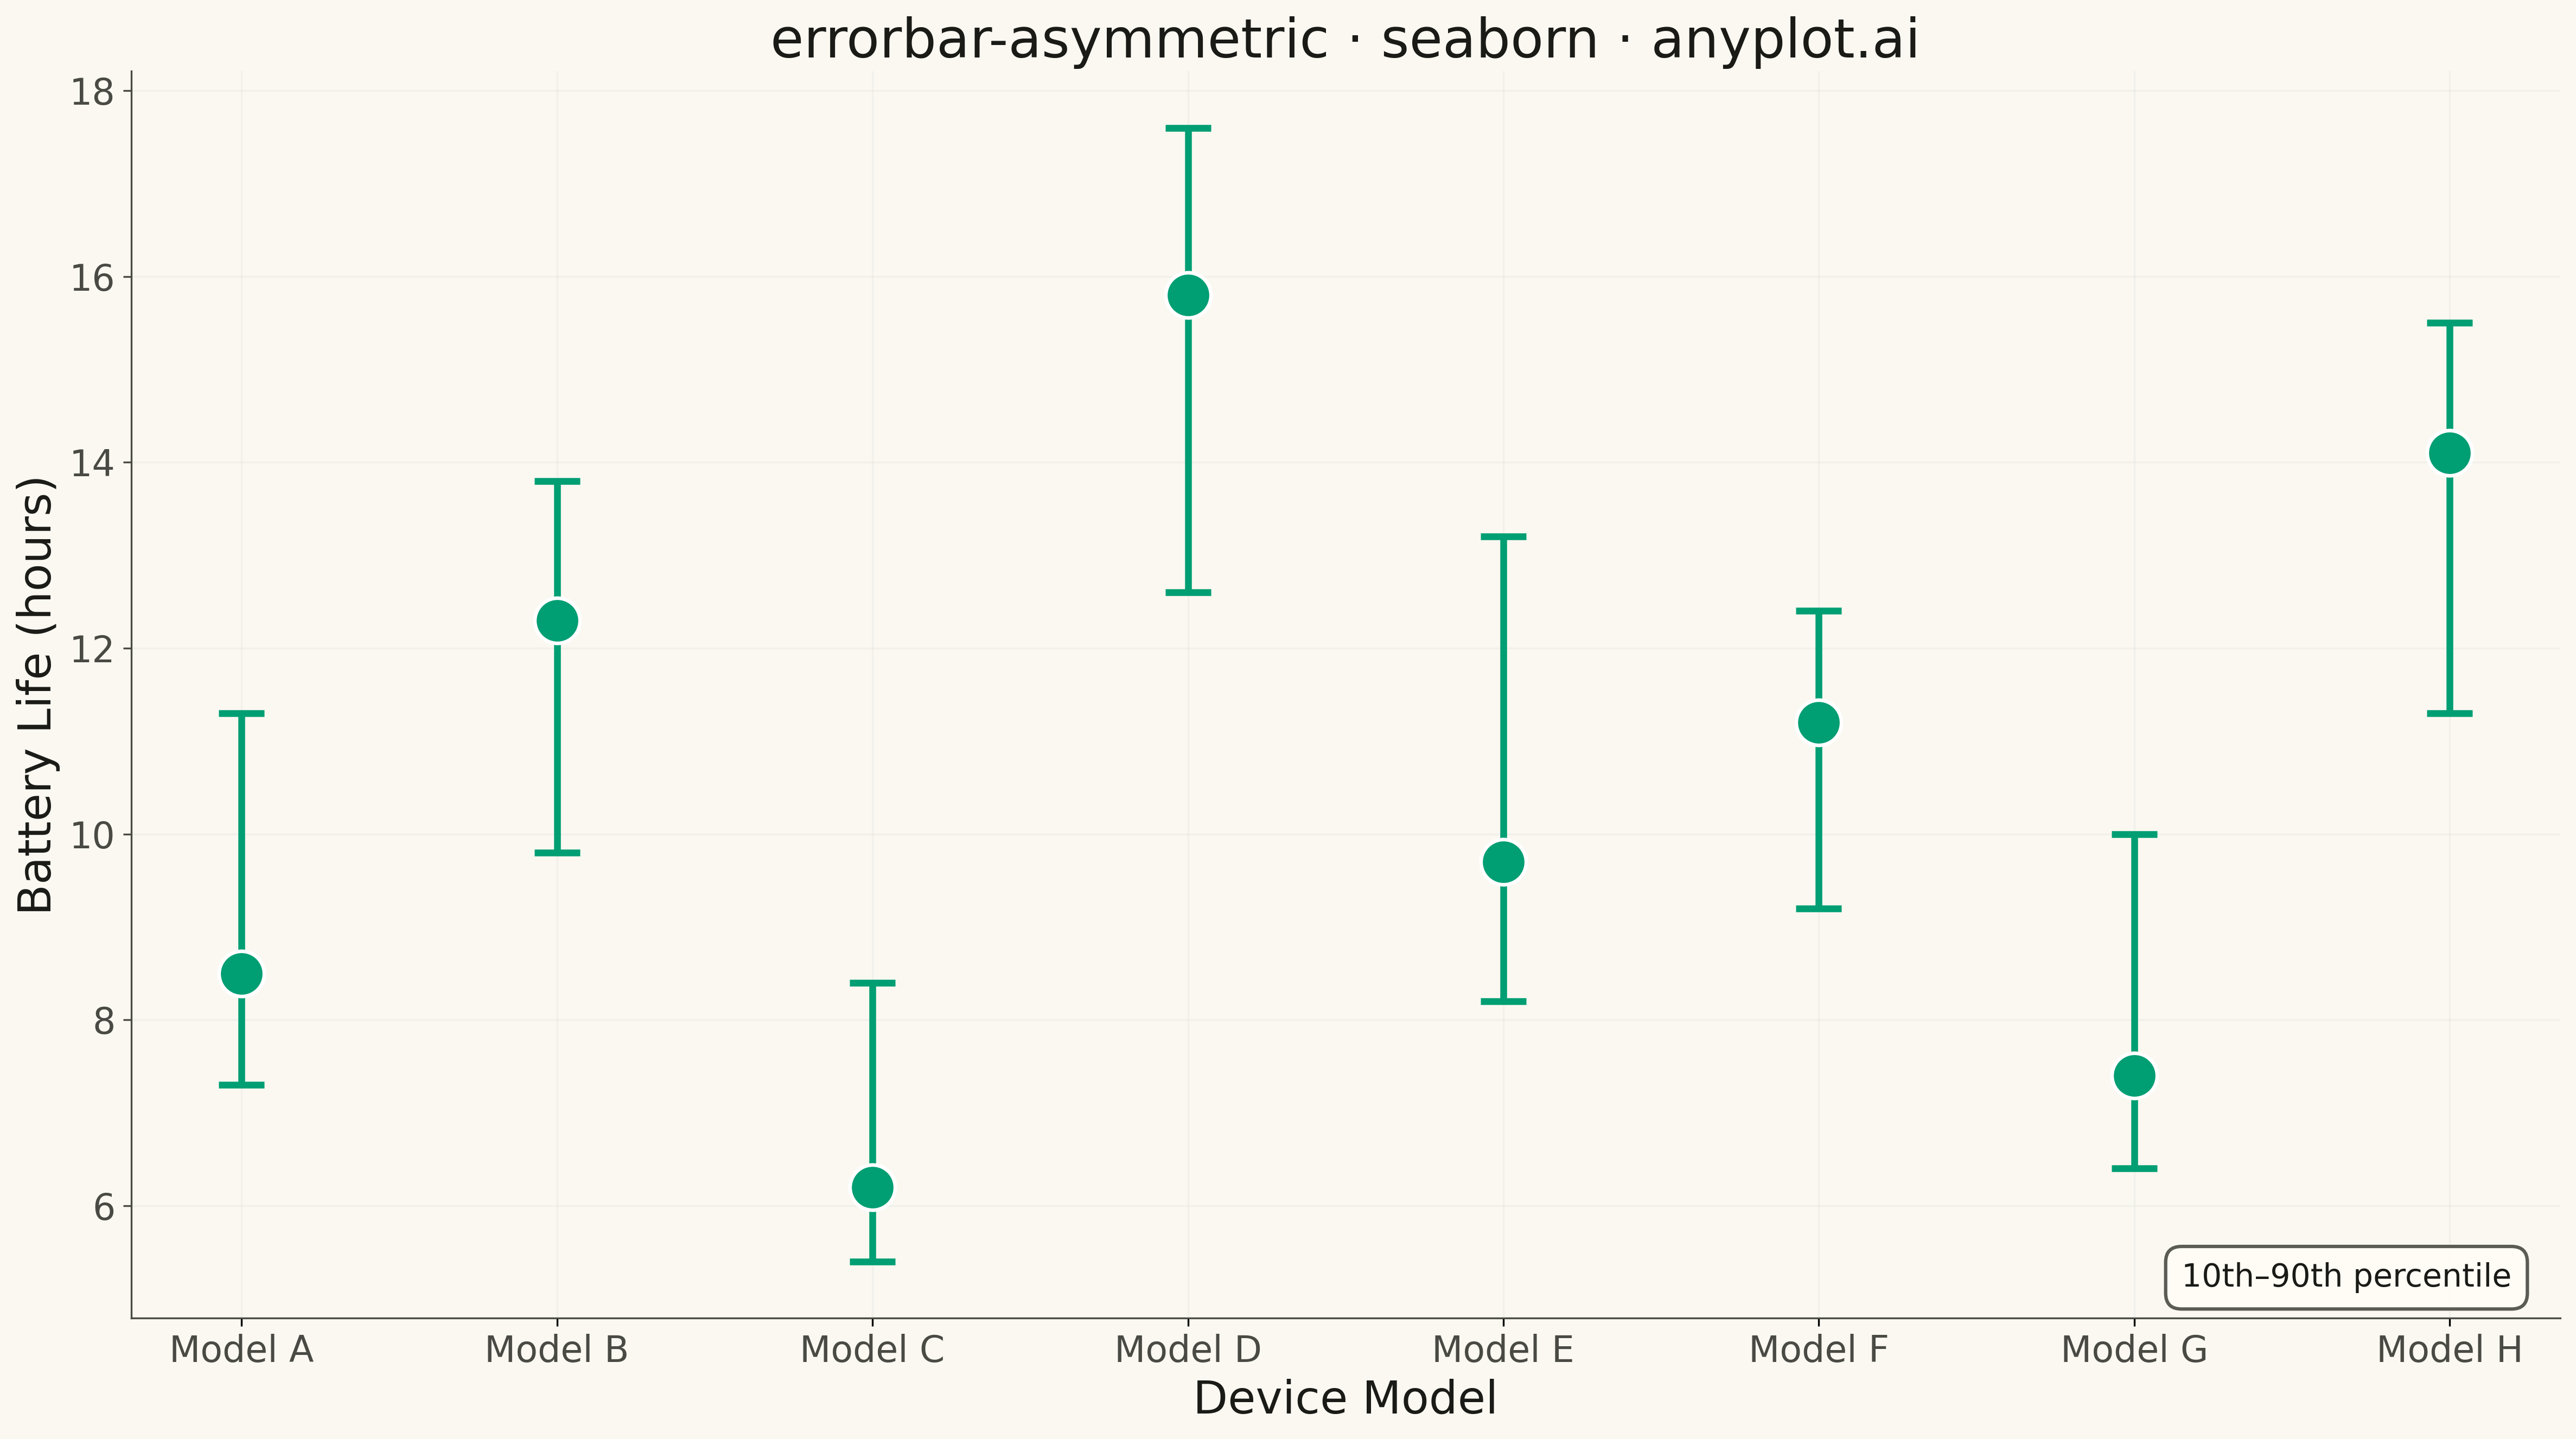
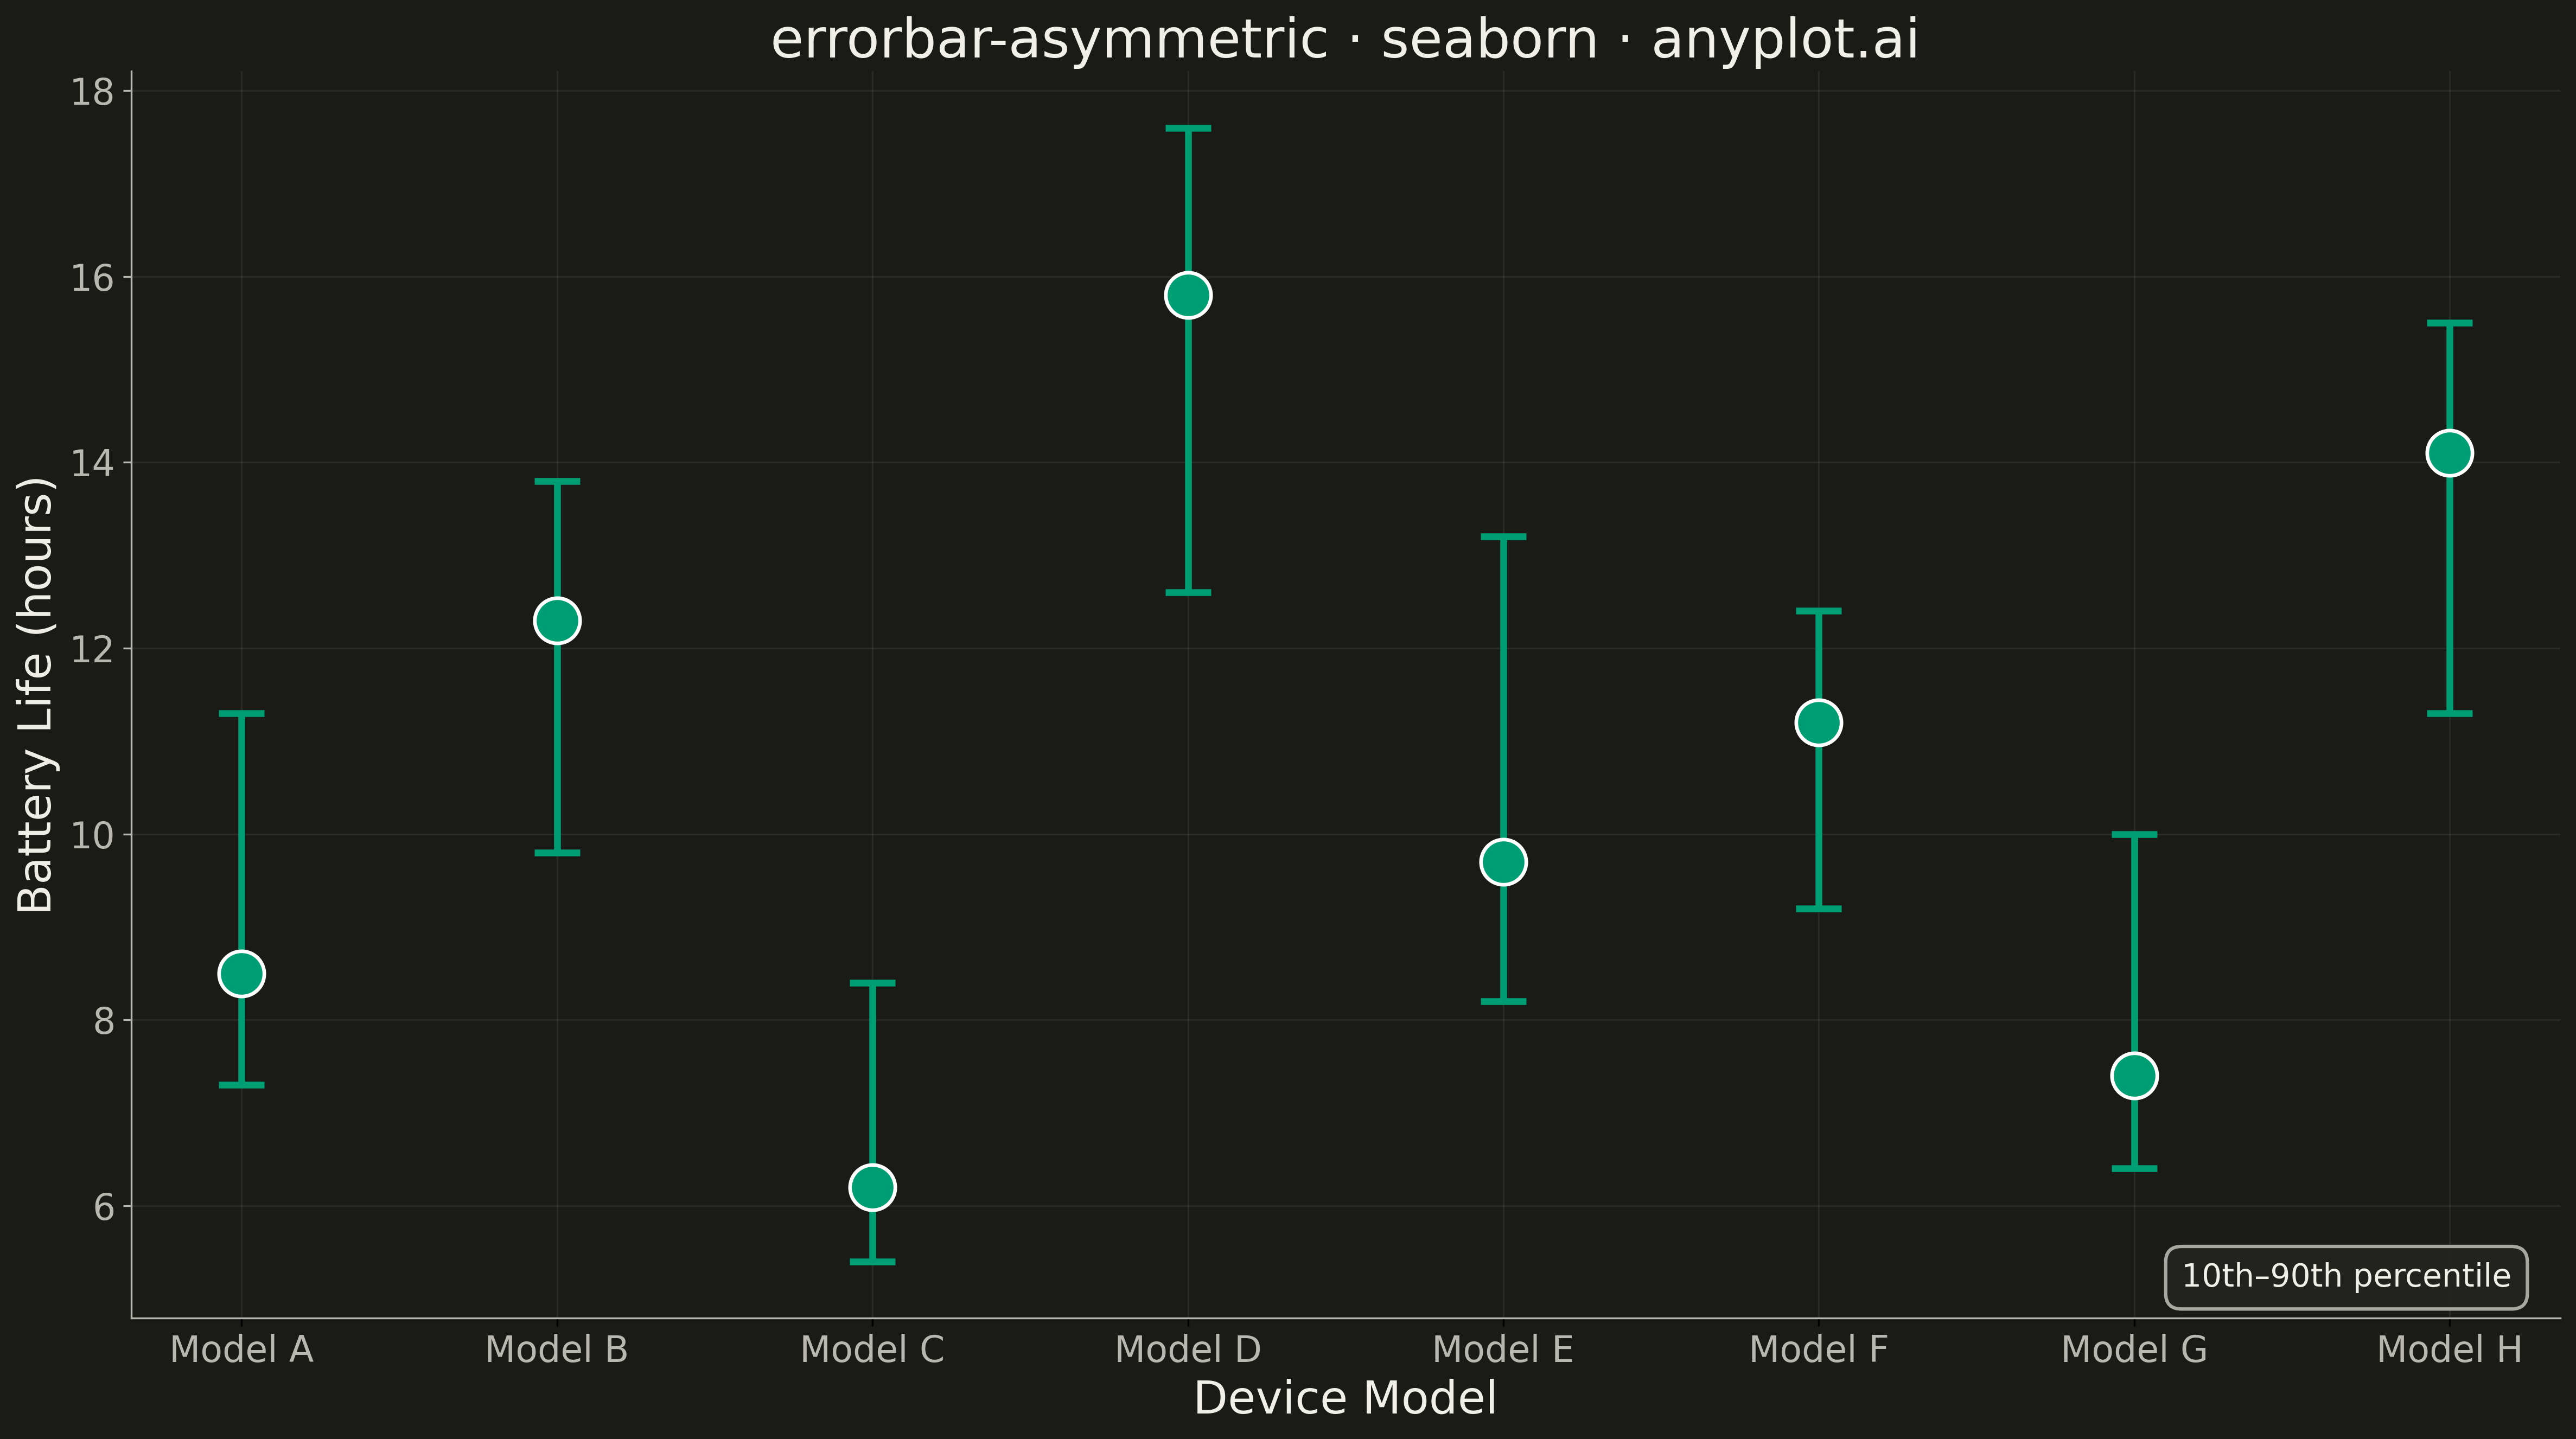
An asymmetric error bar plot displays data points with separate upper and lower error magnitudes, allowing different-sized bars extending above and below each point. This visualization is essential for representing skewed distributions, non-symmetric confidence intervals, or data where uncertainty differs in positive and negative directions. Common applications include percentile-based intervals, log-transformed data, and Bayesian credible intervals.
Preview render from the Seaborn implementation.