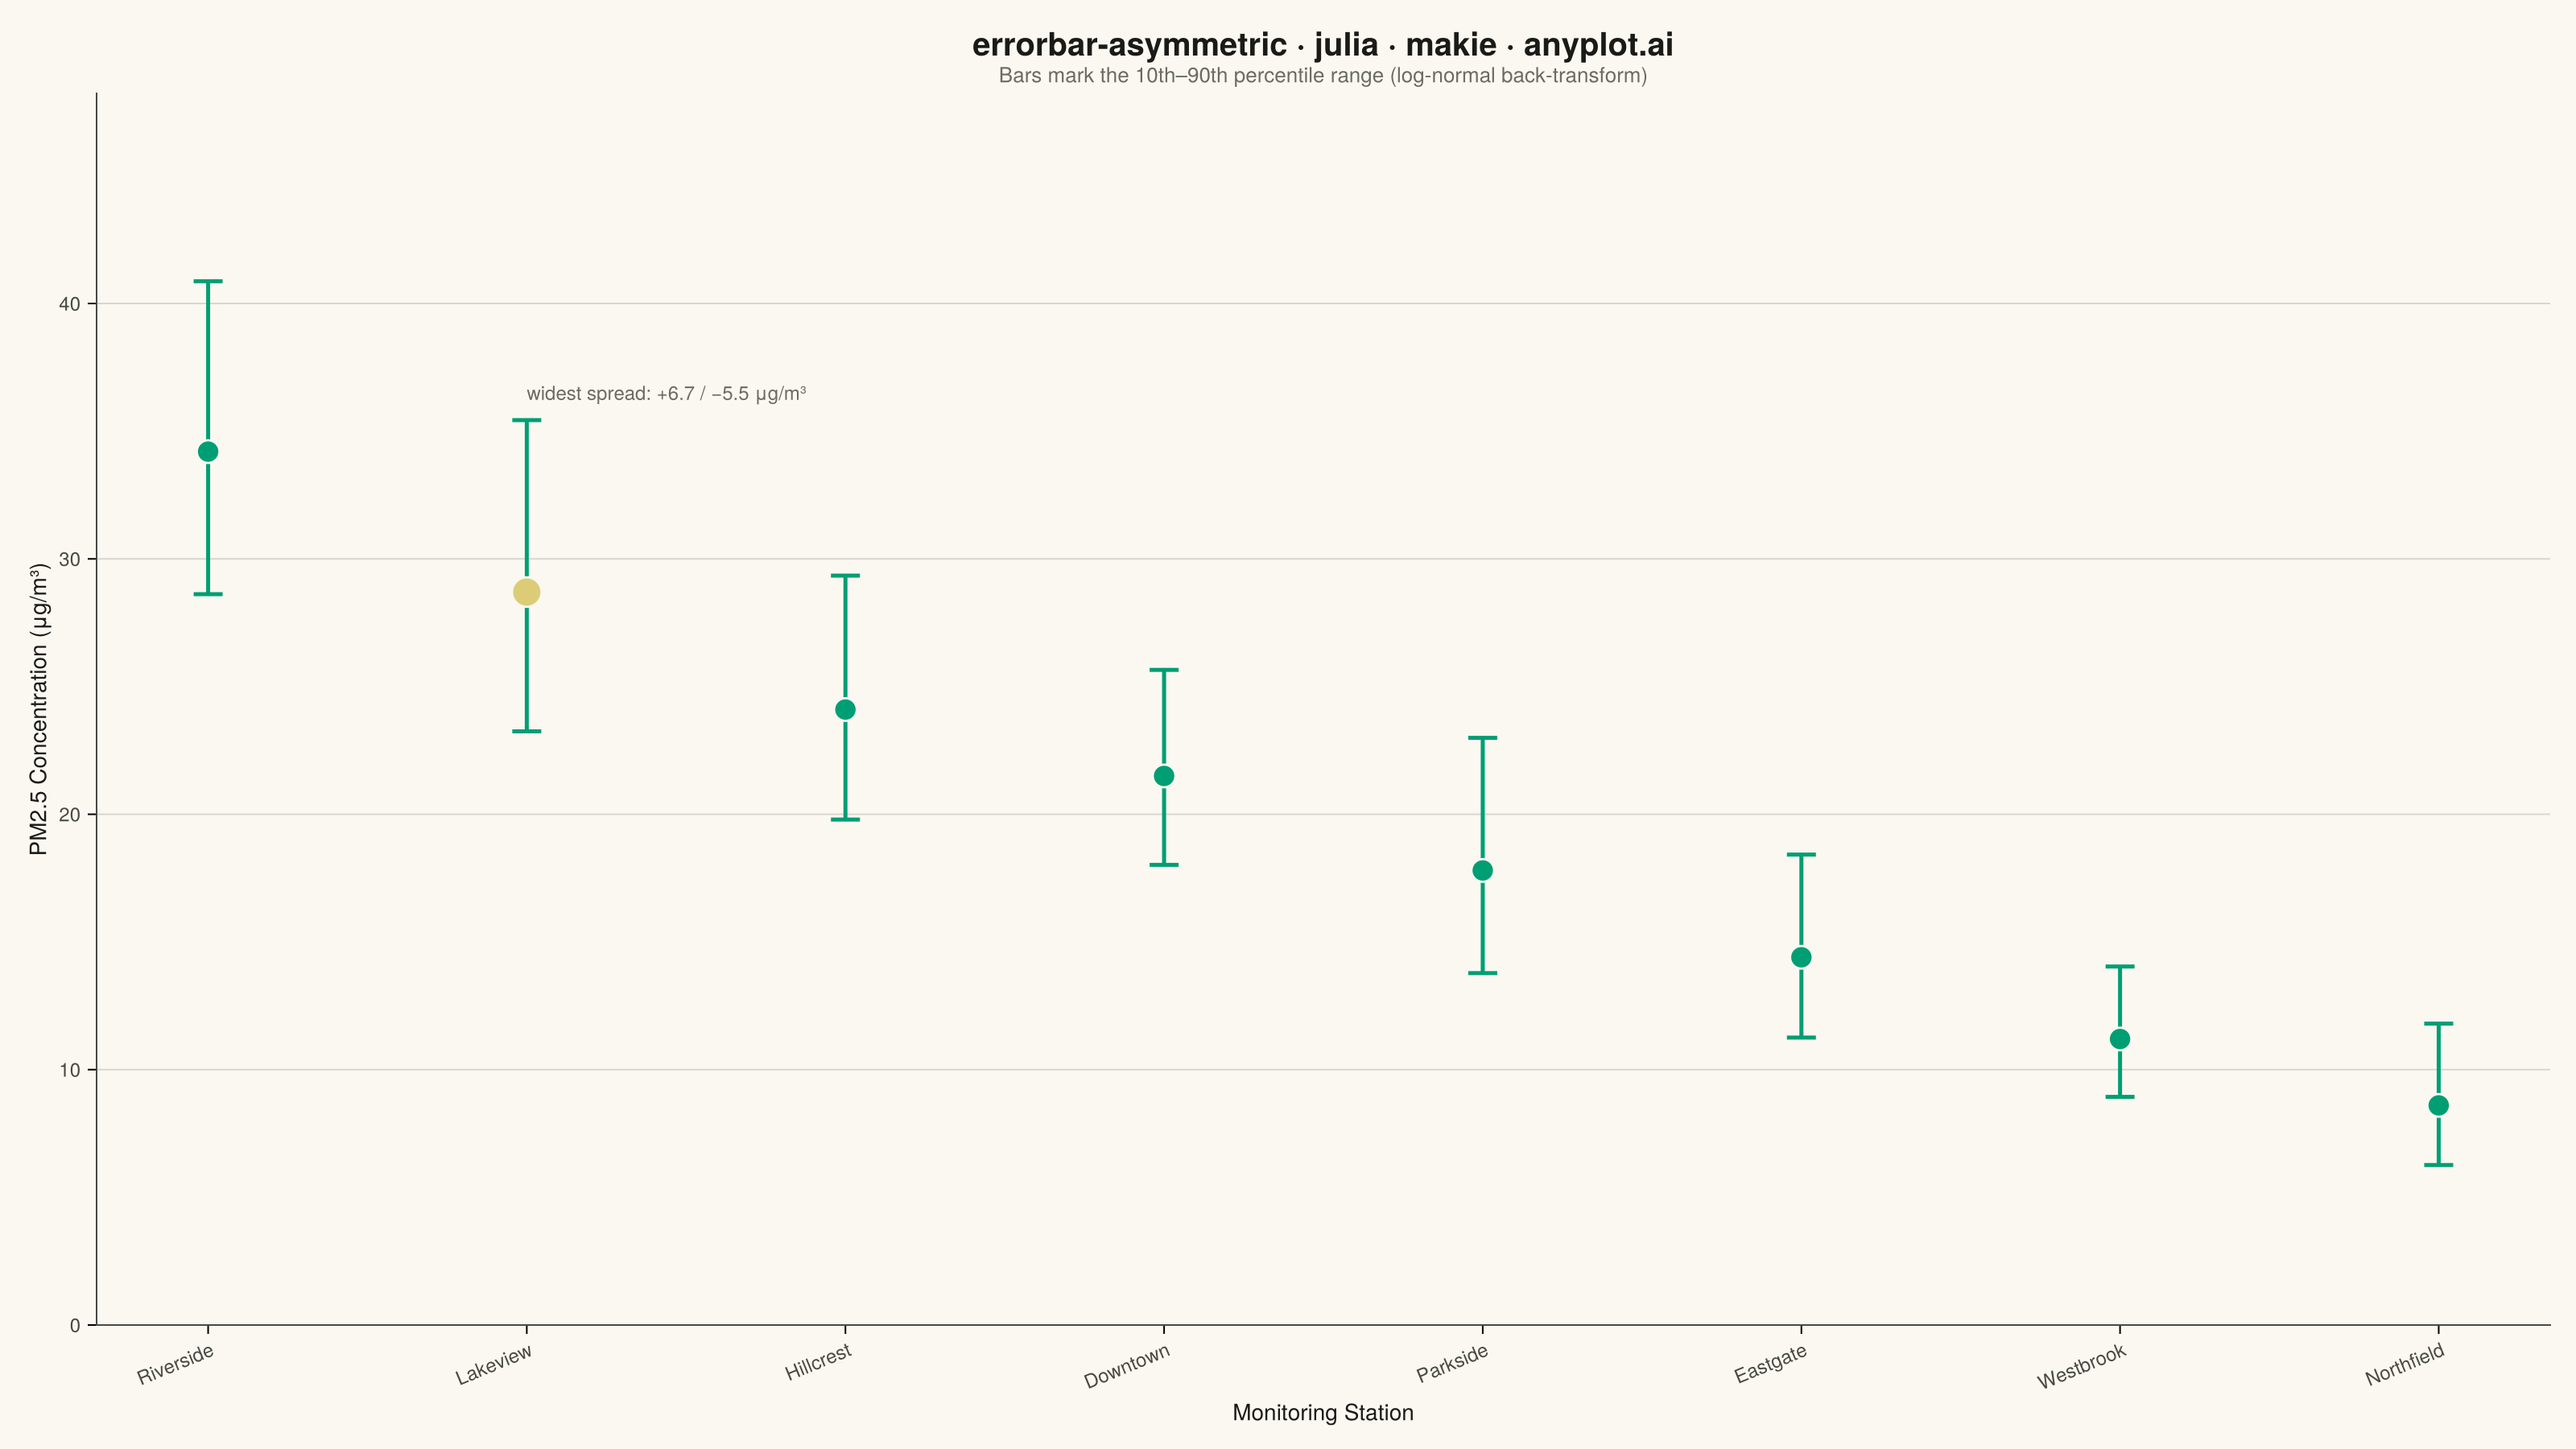
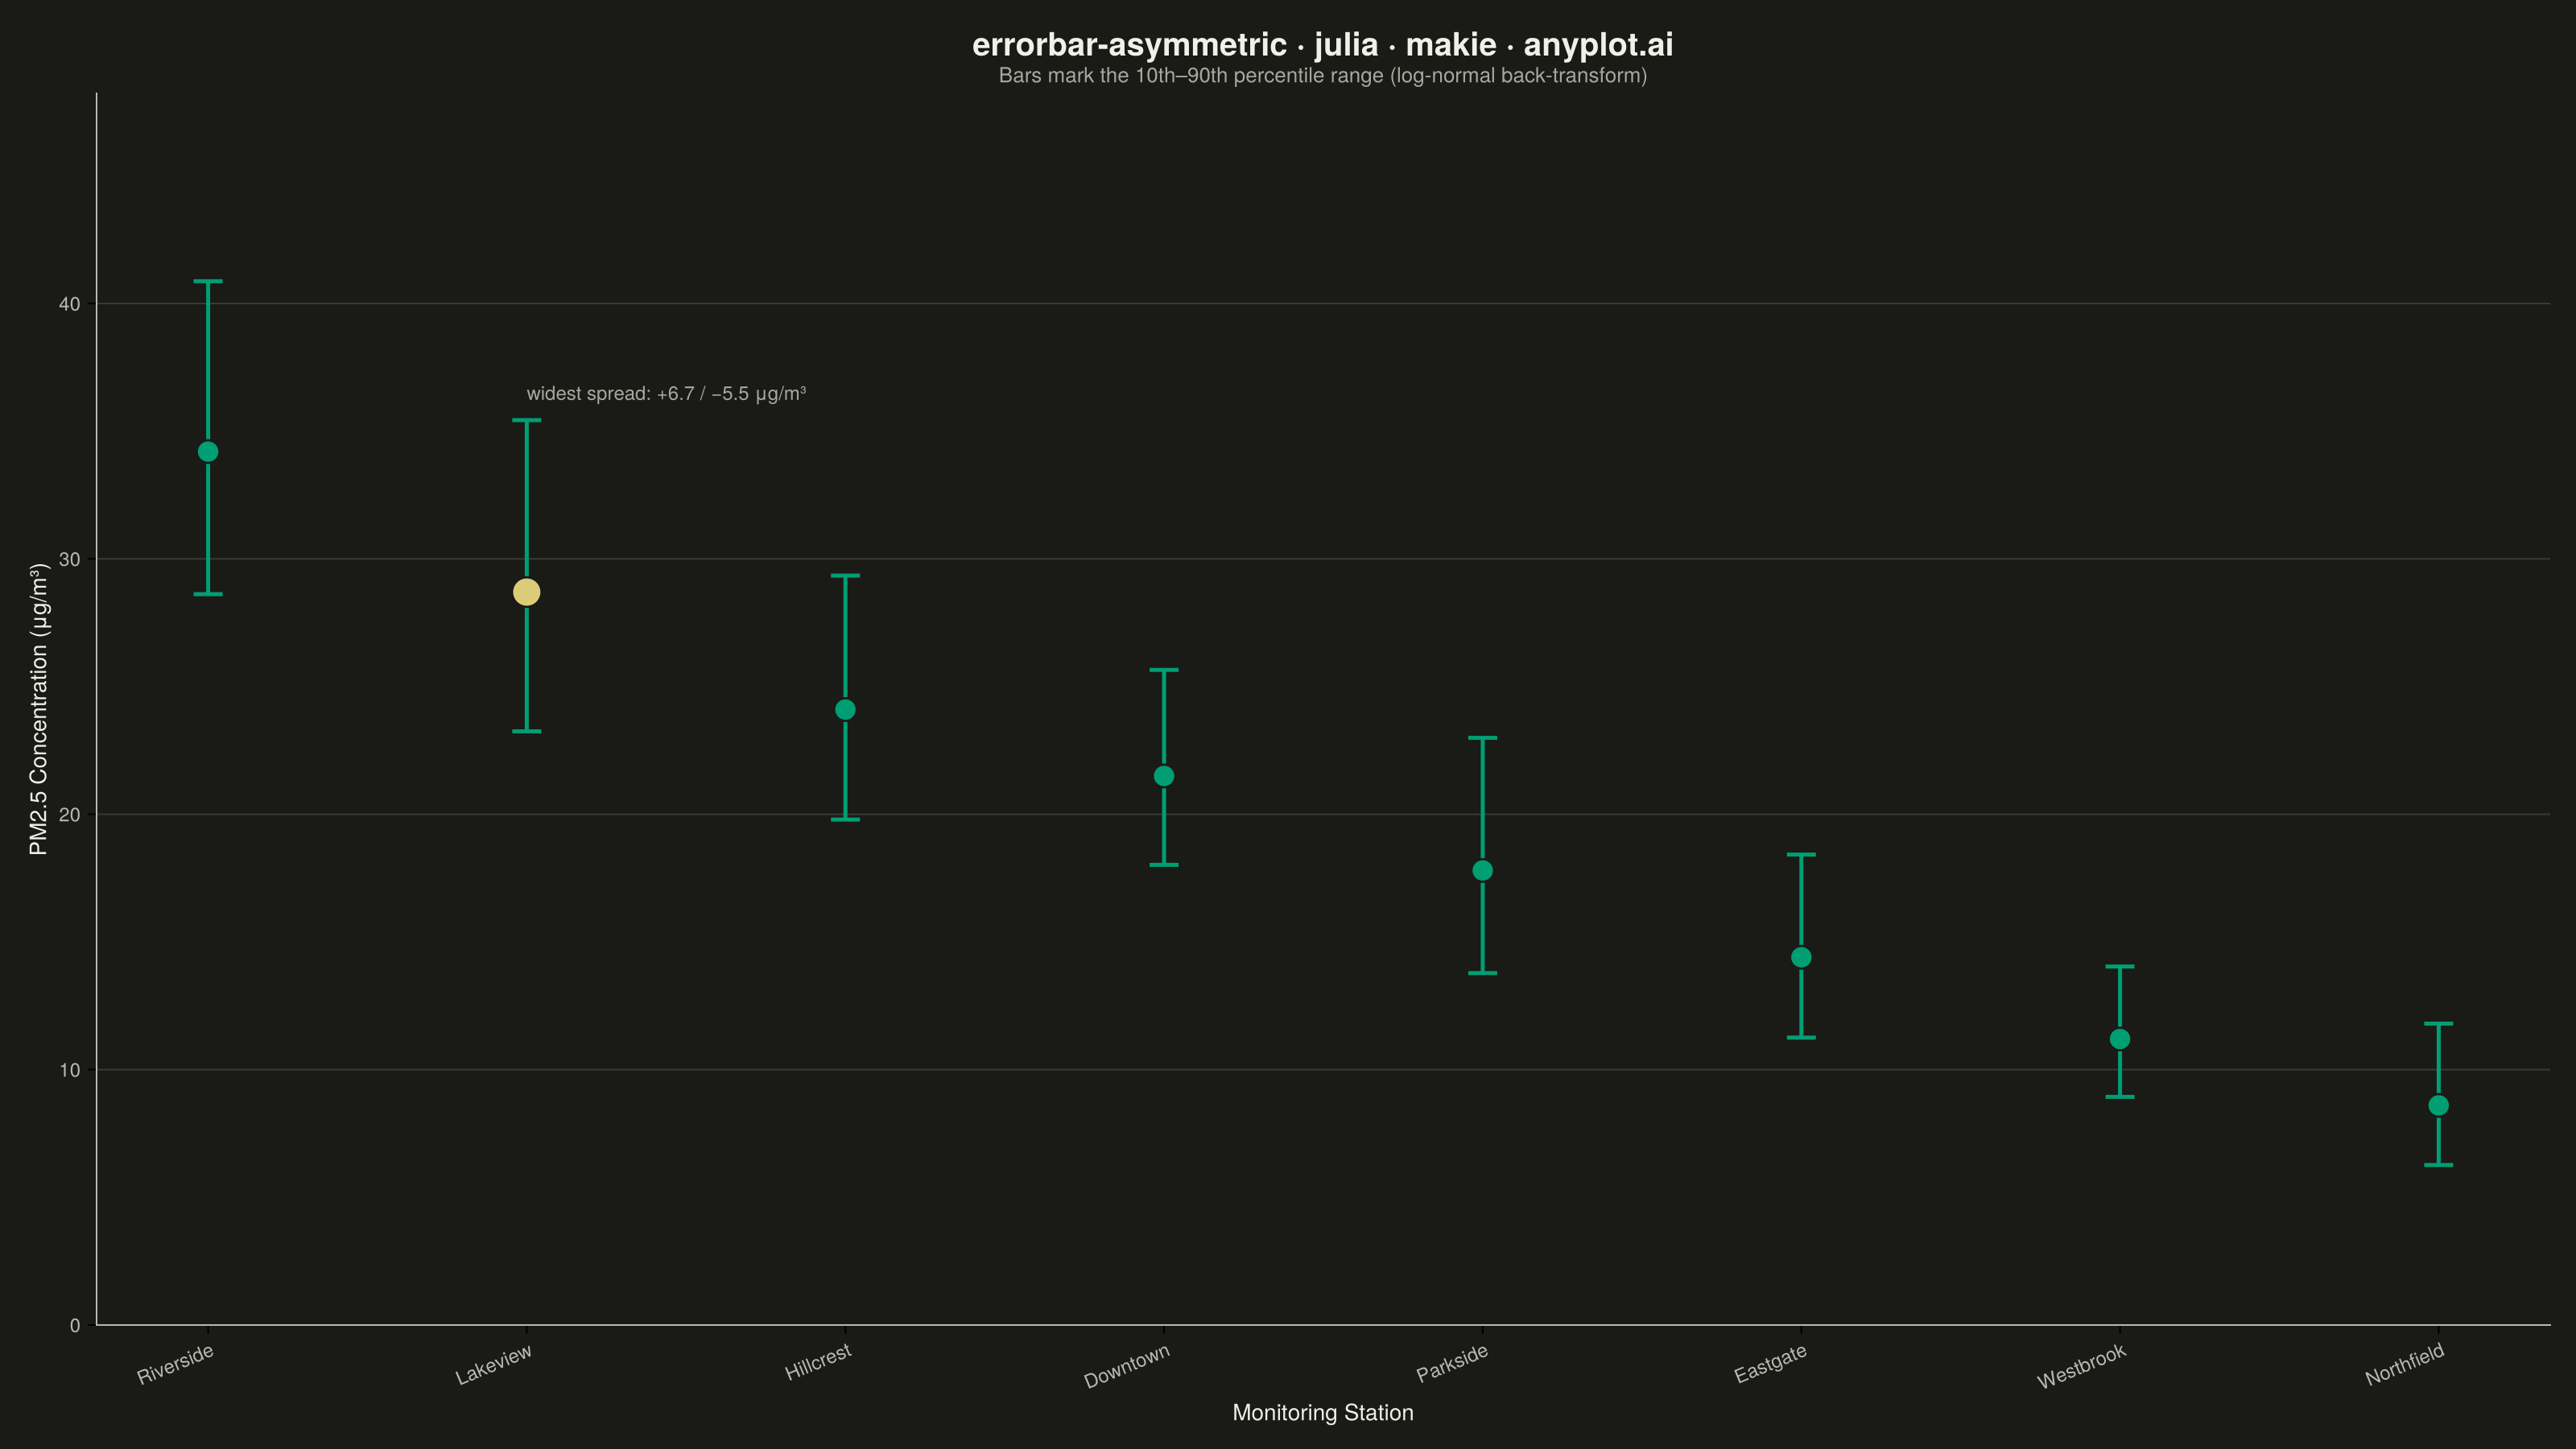
The same plot in 14 other libraries — Python: Altair, Bokeh, lets-plot, Matplotlib, Plotly, plotnine, Pygal, Seaborn; R: ggplot2; JavaScript: Chart.js, D3.js, Apache ECharts, Highcharts, MUI X Charts. Compare all 15 side by side: Asymmetric Error Bars Plot in Python, R, Julia and JavaScript.
An asymmetric error bar plot displays data points with separate upper and lower error magnitudes, allowing different-sized bars extending above and below each point. This visualization is essential for representing skewed distributions, non-symmetric confidence intervals, or data where uncertainty differs in positive and negative directions. Common applications include percentile-based intervals, log-transformed data, and Bayesian credible intervals.
# anyplot.ai
# errorbar-asymmetric: Asymmetric Error Bars Plot
# Library: makie 0.21.9 | Julia 1.11.9
# Quality: 91/100 | Created: 2026-09-05

using CairoMakie
using Colors
using Random

Random.seed!(42)

# --- Theme tokens -----------------------------------------------------------
const THEME    = get(ENV, "ANYPLOT_THEME", "light")
const PAGE_BG  = THEME == "light" ? colorant"#FAF8F1" : colorant"#1A1A17"
const INK      = THEME == "light" ? colorant"#1A1A17" : colorant"#F0EFE8"
const INK_SOFT = THEME == "light" ? colorant"#4A4A44" : colorant"#B8B7B0"
const INK_MUTED = THEME == "light" ? colorant"#6B6A63" : colorant"#A8A79F"
const BRAND    = colorant"#009E73"  # Imprint palette position 1
const ANYPLOT_AMBER = colorant"#DDCC77"  # semantic anchor: draws the eye to the callout station

# --- Data ---------------------------------------------------------------
# Airborne particulate matter (PM2.5, μg/m3) reported as station medians. The
# underlying measurement noise is log-normal, so back-transforming the
# uncertainty to the linear concentration scale yields a larger upper bound
# than lower bound at every station.
stations = ["Riverside", "Lakeview", "Hillcrest", "Downtown",
            "Parkside", "Eastgate", "Westbrook", "Northfield"]
n = length(stations)
positions = 1:n

median_conc = [34.2, 28.7, 24.1, 21.5, 17.8, 14.4, 11.2, 8.6]
log_sigma = 0.14 .+ 0.22 .* rand(n)

error_lower = median_conc .* (1 .- exp.(-log_sigma))
error_upper = median_conc .* (exp.(log_sigma) .- 1)

# Station with the widest asymmetric spread gets a callout accent below.
spread = error_upper .- error_lower
widest = argmax(spread)

# --- Plot ---------------------------------------------------------------
fig = Figure(
    size            = (1600, 900),
    fontsize        = 14,
    backgroundcolor = PAGE_BG,
)

ax = Axis(
    fig[1, 1];
    title              = "errorbar-asymmetric · julia · makie · anyplot.ai",
    titlesize          = 20,
    titlecolor         = INK,
    subtitle           = "Bars mark the 10th–90th percentile range (log-normal back-transform)",
    subtitlesize       = 13,
    subtitlecolor      = INK_MUTED,
    xlabel             = "Monitoring Station",
    ylabel             = "PM2.5 Concentration (μg/m³)",
    xlabelsize         = 14,
    ylabelsize         = 14,
    xlabelcolor        = INK,
    ylabelcolor        = INK,
    xticklabelcolor    = INK_SOFT,
    yticklabelcolor    = INK_SOFT,
    xticklabelsize     = 12,
    yticklabelsize     = 12,
    xticks             = (positions, stations),
    xticklabelrotation = π / 8,
    backgroundcolor    = PAGE_BG,
    topspinevisible     = false,
    rightspinevisible   = false,
    leftspinecolor      = INK_SOFT,
    bottomspinecolor    = INK_SOFT,
    xgridvisible        = false,
    ygridcolor          = RGBAf(INK.r, INK.g, INK.b, 0.15),
)

errorbars!(ax, positions, median_conc, error_lower, error_upper;
           color = BRAND, whiskerwidth = 18, linewidth = 2.5)
scatter!(ax, positions, median_conc; color = BRAND, markersize = 20,
         strokewidth = 1.4, strokecolor = PAGE_BG)
# Redrawing just the widest-spread point on top (own scatter! call, not a
# per-point color/size vector) avoids relying on Makie's Colorant-vector
# color path, which is why the earlier attempt's callout failed to render.
scatter!(ax, [positions[widest]], [median_conc[widest]]; color = ANYPLOT_AMBER,
         markersize = 26, strokewidth = 1.4, strokecolor = PAGE_BG)

halign = widest <= 2 ? :left : widest >= n - 1 ? :right : :center
text!(ax, positions[widest], median_conc[widest] + error_upper[widest];
      text = "widest spread: +$(round(error_upper[widest], digits = 1)) / −$(round(error_lower[widest], digits = 1)) μg/m³",
      align = (halign, :bottom), offset = (0, 10), fontsize = 12, color = INK_MUTED)

ylims!(ax, 0, maximum(median_conc .+ error_upper) * 1.18)

# --- Save -----------------------------------------------------------------
save("plot-$(THEME).png", fig; px_per_unit = 2)
Runnable source as JSON, for any HTTP client: https://api.anyplot.ai/specs/errorbar-asymmetric/makie/code. Any spec id and library id listed in llms-full.txt fit the same URL shape; every URL below is complete and callable.
{
  "spec_id": "errorbar-asymmetric",
  "language": "julia",
  "library": "makie",
  "page": "https://anyplot.ai/errorbar-asymmetric/julia/makie",
  "hub": "https://anyplot.ai/errorbar-asymmetric",
  "code_json": "https://api.anyplot.ai/specs/errorbar-asymmetric/makie/code",
  "spec_json": "https://api.anyplot.ai/specs/errorbar-asymmetric",
  "render_light_png": "https://storage.googleapis.com/anyplot-images/plots/errorbar-asymmetric/julia/makie/plot-light.png",
  "render_dark_png": "https://storage.googleapis.com/anyplot-images/plots/errorbar-asymmetric/julia/makie/plot-dark.png",
  "quality_score": 91.0,
  "license": "MIT",
  "guide": "https://anyplot.ai/llms.txt"
}
Part of Asymmetric Error Bars Plot on anyplot.ai.