The same plot in 14 other libraries — JavaScript: Chart.js, D3.js, Apache ECharts, Highcharts; Python: Altair, Bokeh, lets-plot, Matplotlib, Plotly, plotnine, Pygal, Seaborn; R: ggplot2; Julia: Makie.jl. Compare all 15 side by side: Asymmetric Error Bars Plot in Python, R, Julia and JavaScript.
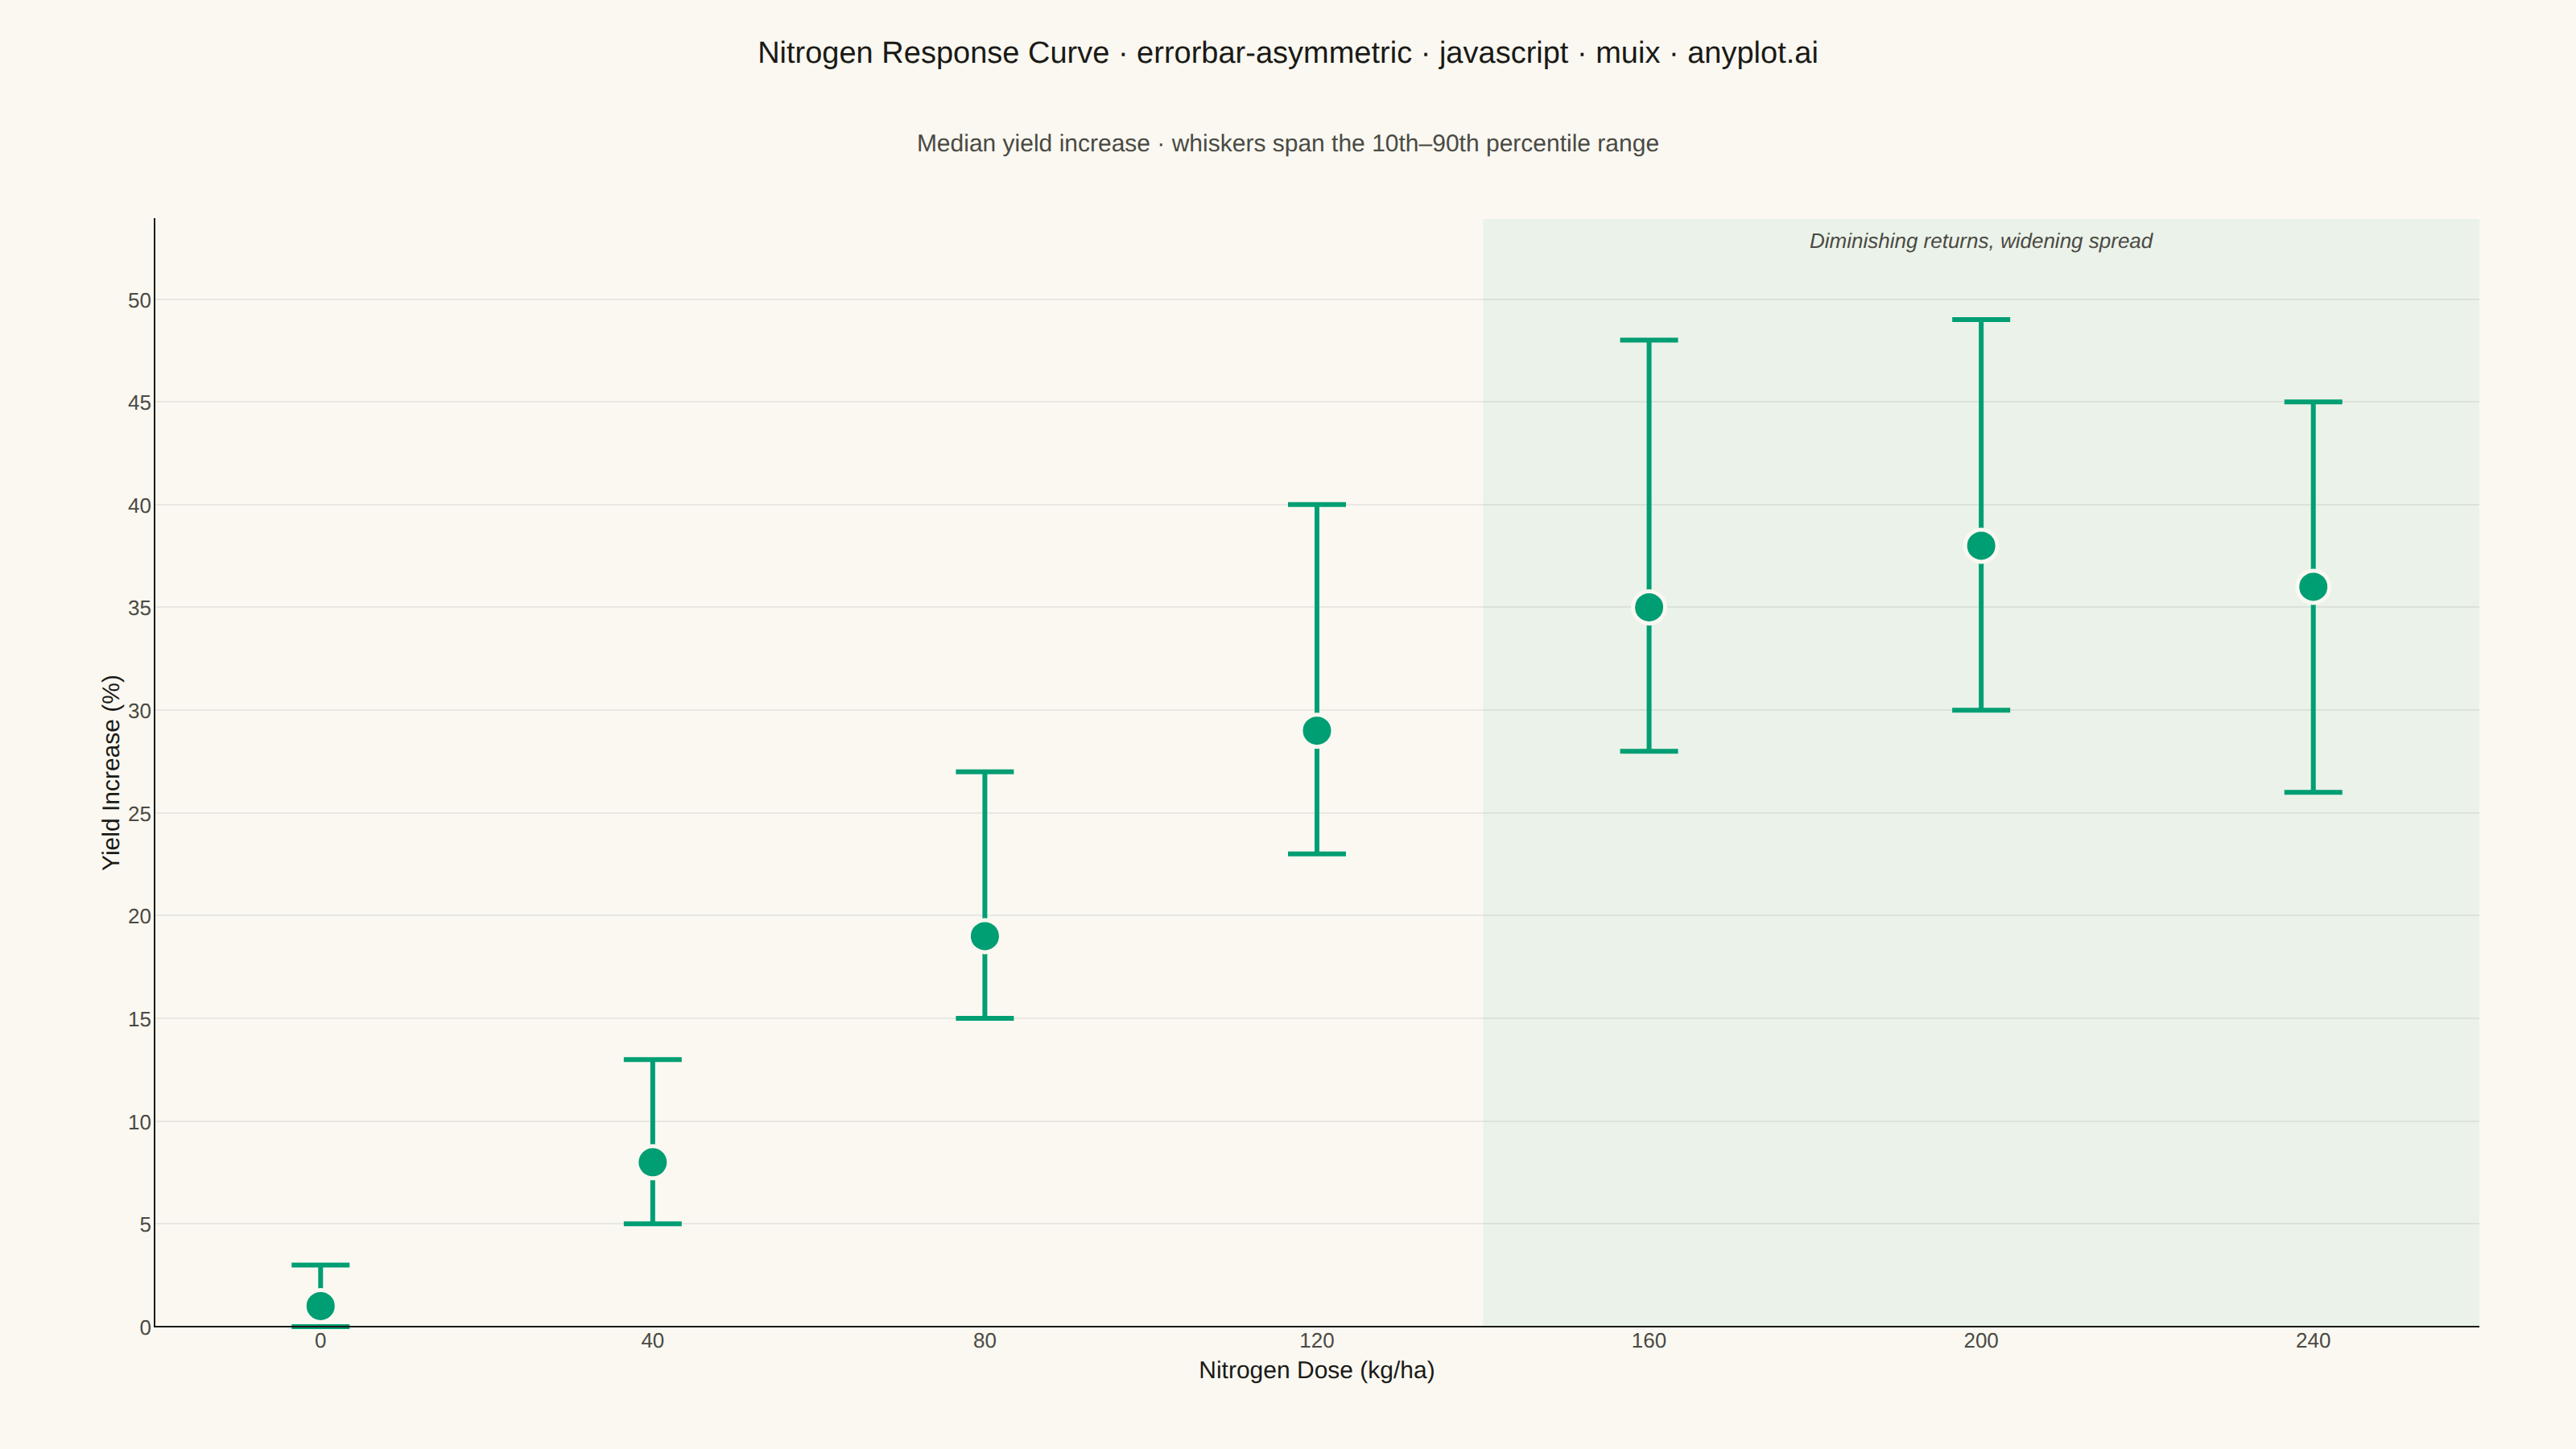
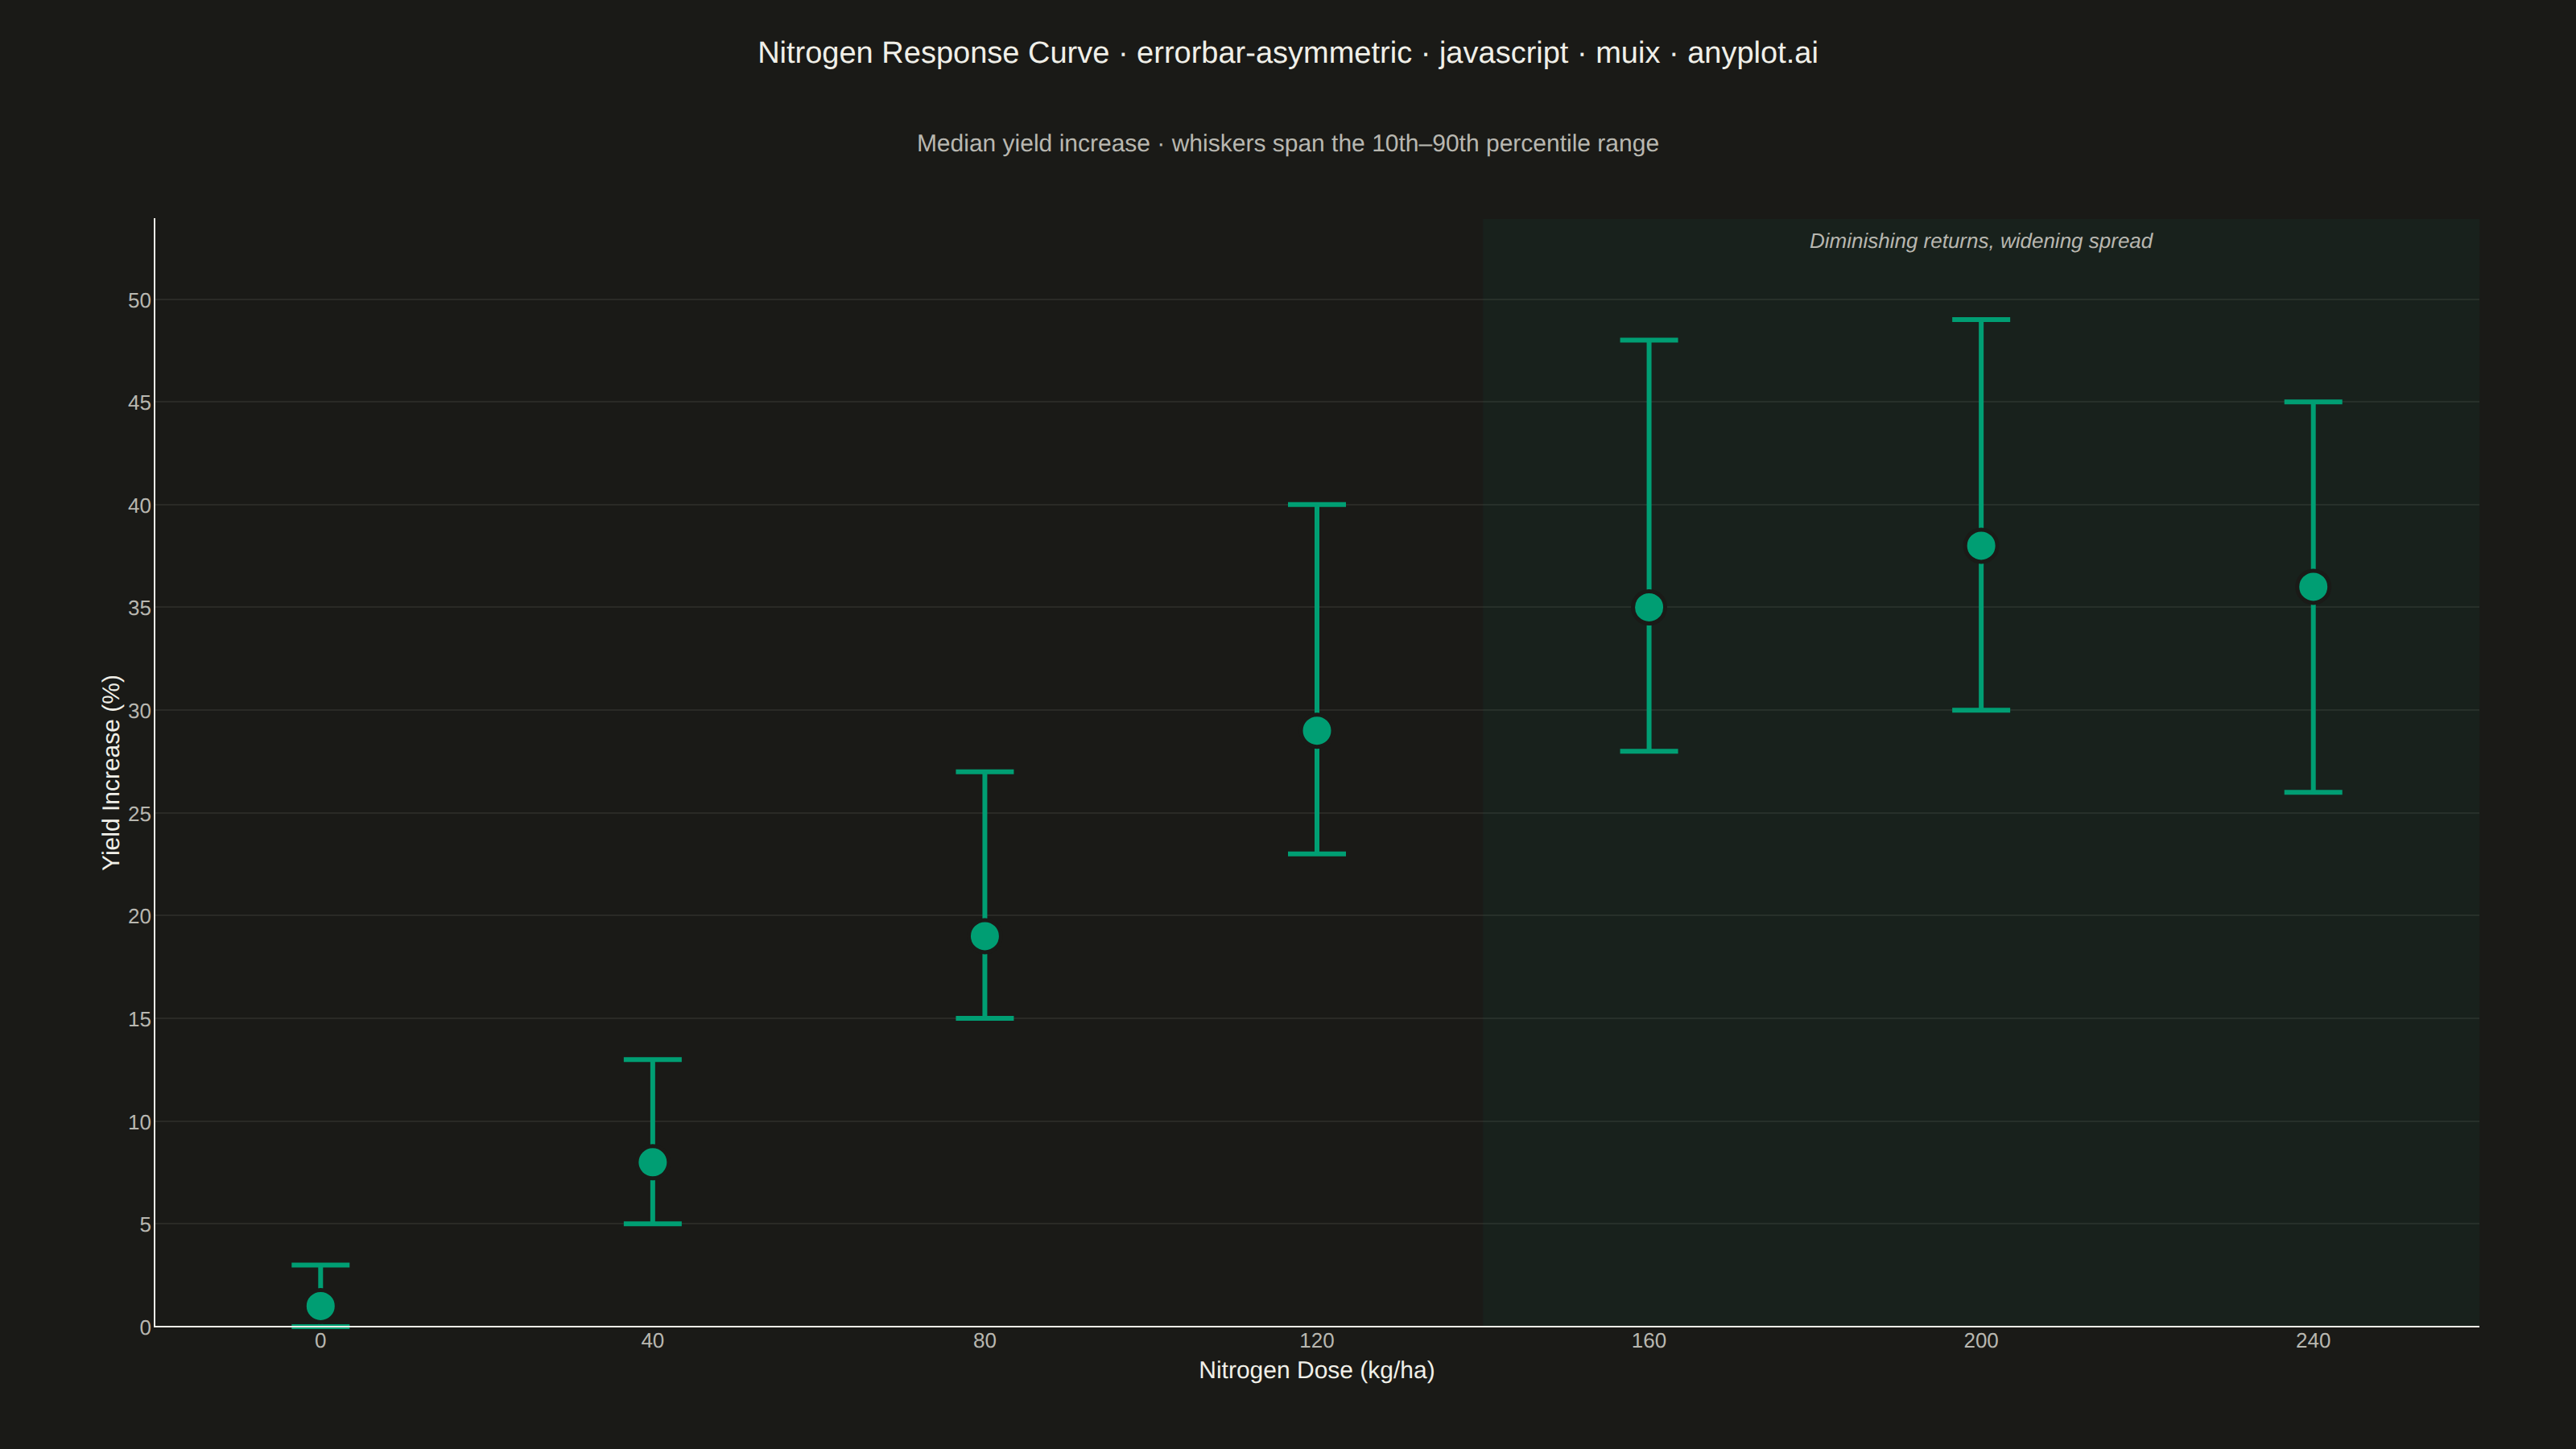
An asymmetric error bar plot displays data points with separate upper and lower error magnitudes, allowing different-sized bars extending above and below each point. This visualization is essential for representing skewed distributions, non-symmetric confidence intervals, or data where uncertainty differs in positive and negative directions. Common applications include percentile-based intervals, log-transformed data, and Bayesian credible intervals.
// anyplot.ai
// errorbar-asymmetric: Asymmetric Error Bars Plot
// Library: muix 7.29.1 | JavaScript 22.23.2
// Quality: 92/100 | Created: 2026-09-05
//# anyplot-orientation: landscape
// anyplot.ai
// errorbar-asymmetric: Asymmetric Error Bars Plot
// Library: MUI X Charts | React | Node 22
// License: @mui/x-charts — MIT (community). Pro/Premium are out of scope.
// Quality: pending | Created: 2026-09-05

import { ChartContainer } from "@mui/x-charts/ChartContainer";
import { ChartsXAxis } from "@mui/x-charts/ChartsXAxis";
import { ChartsYAxis } from "@mui/x-charts/ChartsYAxis";
import { ChartsGrid } from "@mui/x-charts/ChartsGrid";
import { useXScale, useYScale } from "@mui/x-charts";
import Box from "@mui/material/Box";
import Typography from "@mui/material/Typography";

const t = window.ANYPLOT_TOKENS;

// Crop yield increase by nitrogen fertilizer dose — median with 10th-90th
// percentile range. Response flattens (and the spread widens) at high doses,
// a realistic diminishing-returns pattern that motivates asymmetric bounds.
const doses = ["0", "40", "80", "120", "160", "200", "240"];
const median = [1, 8, 19, 29, 35, 38, 36];
const errorLower = [1, 3, 4, 6, 7, 8, 10];
const errorUpper = [2, 5, 8, 11, 13, 11, 9];

const Y_MIN = 0;
const Y_MAX = Math.max(...median.map((m, i) => m + errorUpper[i])) * 1.1;

// Plateau starts once the median gain stops climbing meaningfully — highlight
// that region to call out the diminishing-returns / widening-uncertainty story.
const PLATEAU_START_INDEX = doses.indexOf("160");

// Must be rendered inside ChartContainer to access its scale context
function ErrorBars() {
  const xScale = useXScale();
  const yScale = useYScale();

  if (!xScale || !yScale || typeof xScale.bandwidth !== "function") return null;

  const capHalfWidth = Math.min(18, xScale.bandwidth() * 0.28);
  const halfGap = (xScale.step() - xScale.bandwidth()) / 2;
  const plateauX0 = +xScale(doses[PLATEAU_START_INDEX]) - halfGap;
  const plateauX1 = +xScale(doses[doses.length - 1]) + xScale.bandwidth() + halfGap;
  const [yRangeTop, yRangeBottom] = yScale.range();
  const plateauLabelY = Math.min(yRangeTop, yRangeBottom) + 18;

  return (
    <g>
      <rect
        x={plateauX0}
        y={Math.min(yRangeTop, yRangeBottom)}
        width={plateauX1 - plateauX0}
        height={Math.abs(yRangeBottom - yRangeTop)}
        fill={t.palette[0]}
        opacity={0.06}
      />
      <text
        x={(plateauX0 + plateauX1) / 2}
        y={plateauLabelY}
        textAnchor="middle"
        fontSize={13}
        fontStyle="italic"
        fill={t.inkSoft}
      >
        Diminishing returns, widening spread
      </text>
      {doses.map((dose, i) => {
        const cx = +xScale(dose) + xScale.bandwidth() / 2;
        const yTop = +yScale(median[i] + errorUpper[i]);
        const yBottom = +yScale(median[i] - errorLower[i]);
        const yMid = +yScale(median[i]);

        return (
          <g key={dose}>
            <line
              x1={cx} x2={cx} y1={yTop} y2={yBottom}
              stroke={t.palette[0]} strokeWidth={3}
            />
            <line
              x1={cx - capHalfWidth} x2={cx + capHalfWidth} y1={yTop} y2={yTop}
              stroke={t.palette[0]} strokeWidth={3}
            />
            <line
              x1={cx - capHalfWidth} x2={cx + capHalfWidth} y1={yBottom} y2={yBottom}
              stroke={t.palette[0]} strokeWidth={3}
            />
            <circle cx={cx} cy={yMid} r={10} fill={t.palette[0]} stroke={t.pageBg} strokeWidth={2.5} />
          </g>
        );
      })}
    </g>
  );
}

const TITLE = "Nitrogen Response Curve · errorbar-asymmetric · javascript · muix · anyplot.ai";
const TITLE_FONT_SIZE = Math.round(22 * Math.min(1, 67 / TITLE.length));
const SUBTITLE = "Median yield increase · whiskers span the 10th–90th percentile range";
const TITLE_HEIGHT = 68;
const SUBTITLE_HEIGHT = 44;
const MARGIN = { top: 24, right: 60, bottom: 76, left: 96 };

export default function Chart() {
  const chartWidth = window.ANYPLOT_SIZE.width;
  const chartHeight = window.ANYPLOT_SIZE.height - TITLE_HEIGHT - SUBTITLE_HEIGHT;

  return (
    <Box
      sx={{
        width: chartWidth,
        height: window.ANYPLOT_SIZE.height,
        display: "flex",
        flexDirection: "column",
      }}
    >
      <Box
        sx={{
          height: TITLE_HEIGHT,
          display: "flex",
          alignItems: "center",
          justifyContent: "center",
          flexShrink: 0,
        }}
      >
        <Typography sx={{ color: t.ink, fontSize: TITLE_FONT_SIZE, fontWeight: 500 }}>
          {TITLE}
        </Typography>
      </Box>
      <Box
        sx={{
          height: SUBTITLE_HEIGHT,
          display: "flex",
          alignItems: "center",
          justifyContent: "center",
          flexShrink: 0,
        }}
      >
        <Typography sx={{ color: t.inkSoft, fontSize: 15 }}>
          {SUBTITLE}
        </Typography>
      </Box>

      <ChartContainer
        skipAnimation
        width={chartWidth}
        height={chartHeight}
        margin={MARGIN}
        series={[]}
        xAxis={[{
          scaleType: "band",
          data: doses,
          label: "Nitrogen Dose (kg/ha)",
          labelStyle: { fontSize: 15, fill: t.ink },
          tickLabelStyle: { fontSize: 13, fill: t.inkSoft },
          tickSize: 0,
        }]}
        yAxis={[{
          scaleType: "linear",
          min: Y_MIN,
          max: Y_MAX,
          label: "Yield Increase (%)",
          labelStyle: { fontSize: 15, fill: t.ink },
          tickLabelStyle: { fontSize: 13, fill: t.inkSoft },
          tickSize: 0,
        }]}
        sx={{
          "& .MuiChartsGrid-line": { stroke: t.grid, strokeOpacity: 0.5 },
        }}
      >
        <ChartsGrid horizontal />
        <ErrorBars />
        <ChartsXAxis />
        <ChartsYAxis />
      </ChartContainer>
    </Box>
  );
}
Runnable source as JSON, for any HTTP client: https://api.anyplot.ai/specs/errorbar-asymmetric/muix/code. Any spec id and library id listed in llms-full.txt fit the same URL shape; every URL below is complete and callable.
{
  "spec_id": "errorbar-asymmetric",
  "language": "javascript",
  "library": "muix",
  "page": "https://anyplot.ai/errorbar-asymmetric/javascript/muix",
  "hub": "https://anyplot.ai/errorbar-asymmetric",
  "code_json": "https://api.anyplot.ai/specs/errorbar-asymmetric/muix/code",
  "spec_json": "https://api.anyplot.ai/specs/errorbar-asymmetric",
  "render_light_png": "https://storage.googleapis.com/anyplot-images/plots/errorbar-asymmetric/javascript/muix/plot-light.png",
  "render_dark_png": "https://storage.googleapis.com/anyplot-images/plots/errorbar-asymmetric/javascript/muix/plot-dark.png",
  "interactive_light_html": "https://storage.googleapis.com/anyplot-images/plots/errorbar-asymmetric/javascript/muix/plot-light.html",
  "interactive_dark_html": "https://storage.googleapis.com/anyplot-images/plots/errorbar-asymmetric/javascript/muix/plot-dark.html",
  "quality_score": 92.0,
  "license": "MIT",
  "guide": "https://anyplot.ai/llms.txt"
}
Part of Asymmetric Error Bars Plot on anyplot.ai.