The same plot in 14 other libraries — JavaScript: D3.js, Apache ECharts, Highcharts, MUI X Charts; Python: Altair, Bokeh, lets-plot, Matplotlib, Plotly, plotnine, Pygal, Seaborn; R: ggplot2; Julia: Makie.jl. Compare all 15 side by side: Asymmetric Error Bars Plot in Python, R, Julia and JavaScript.
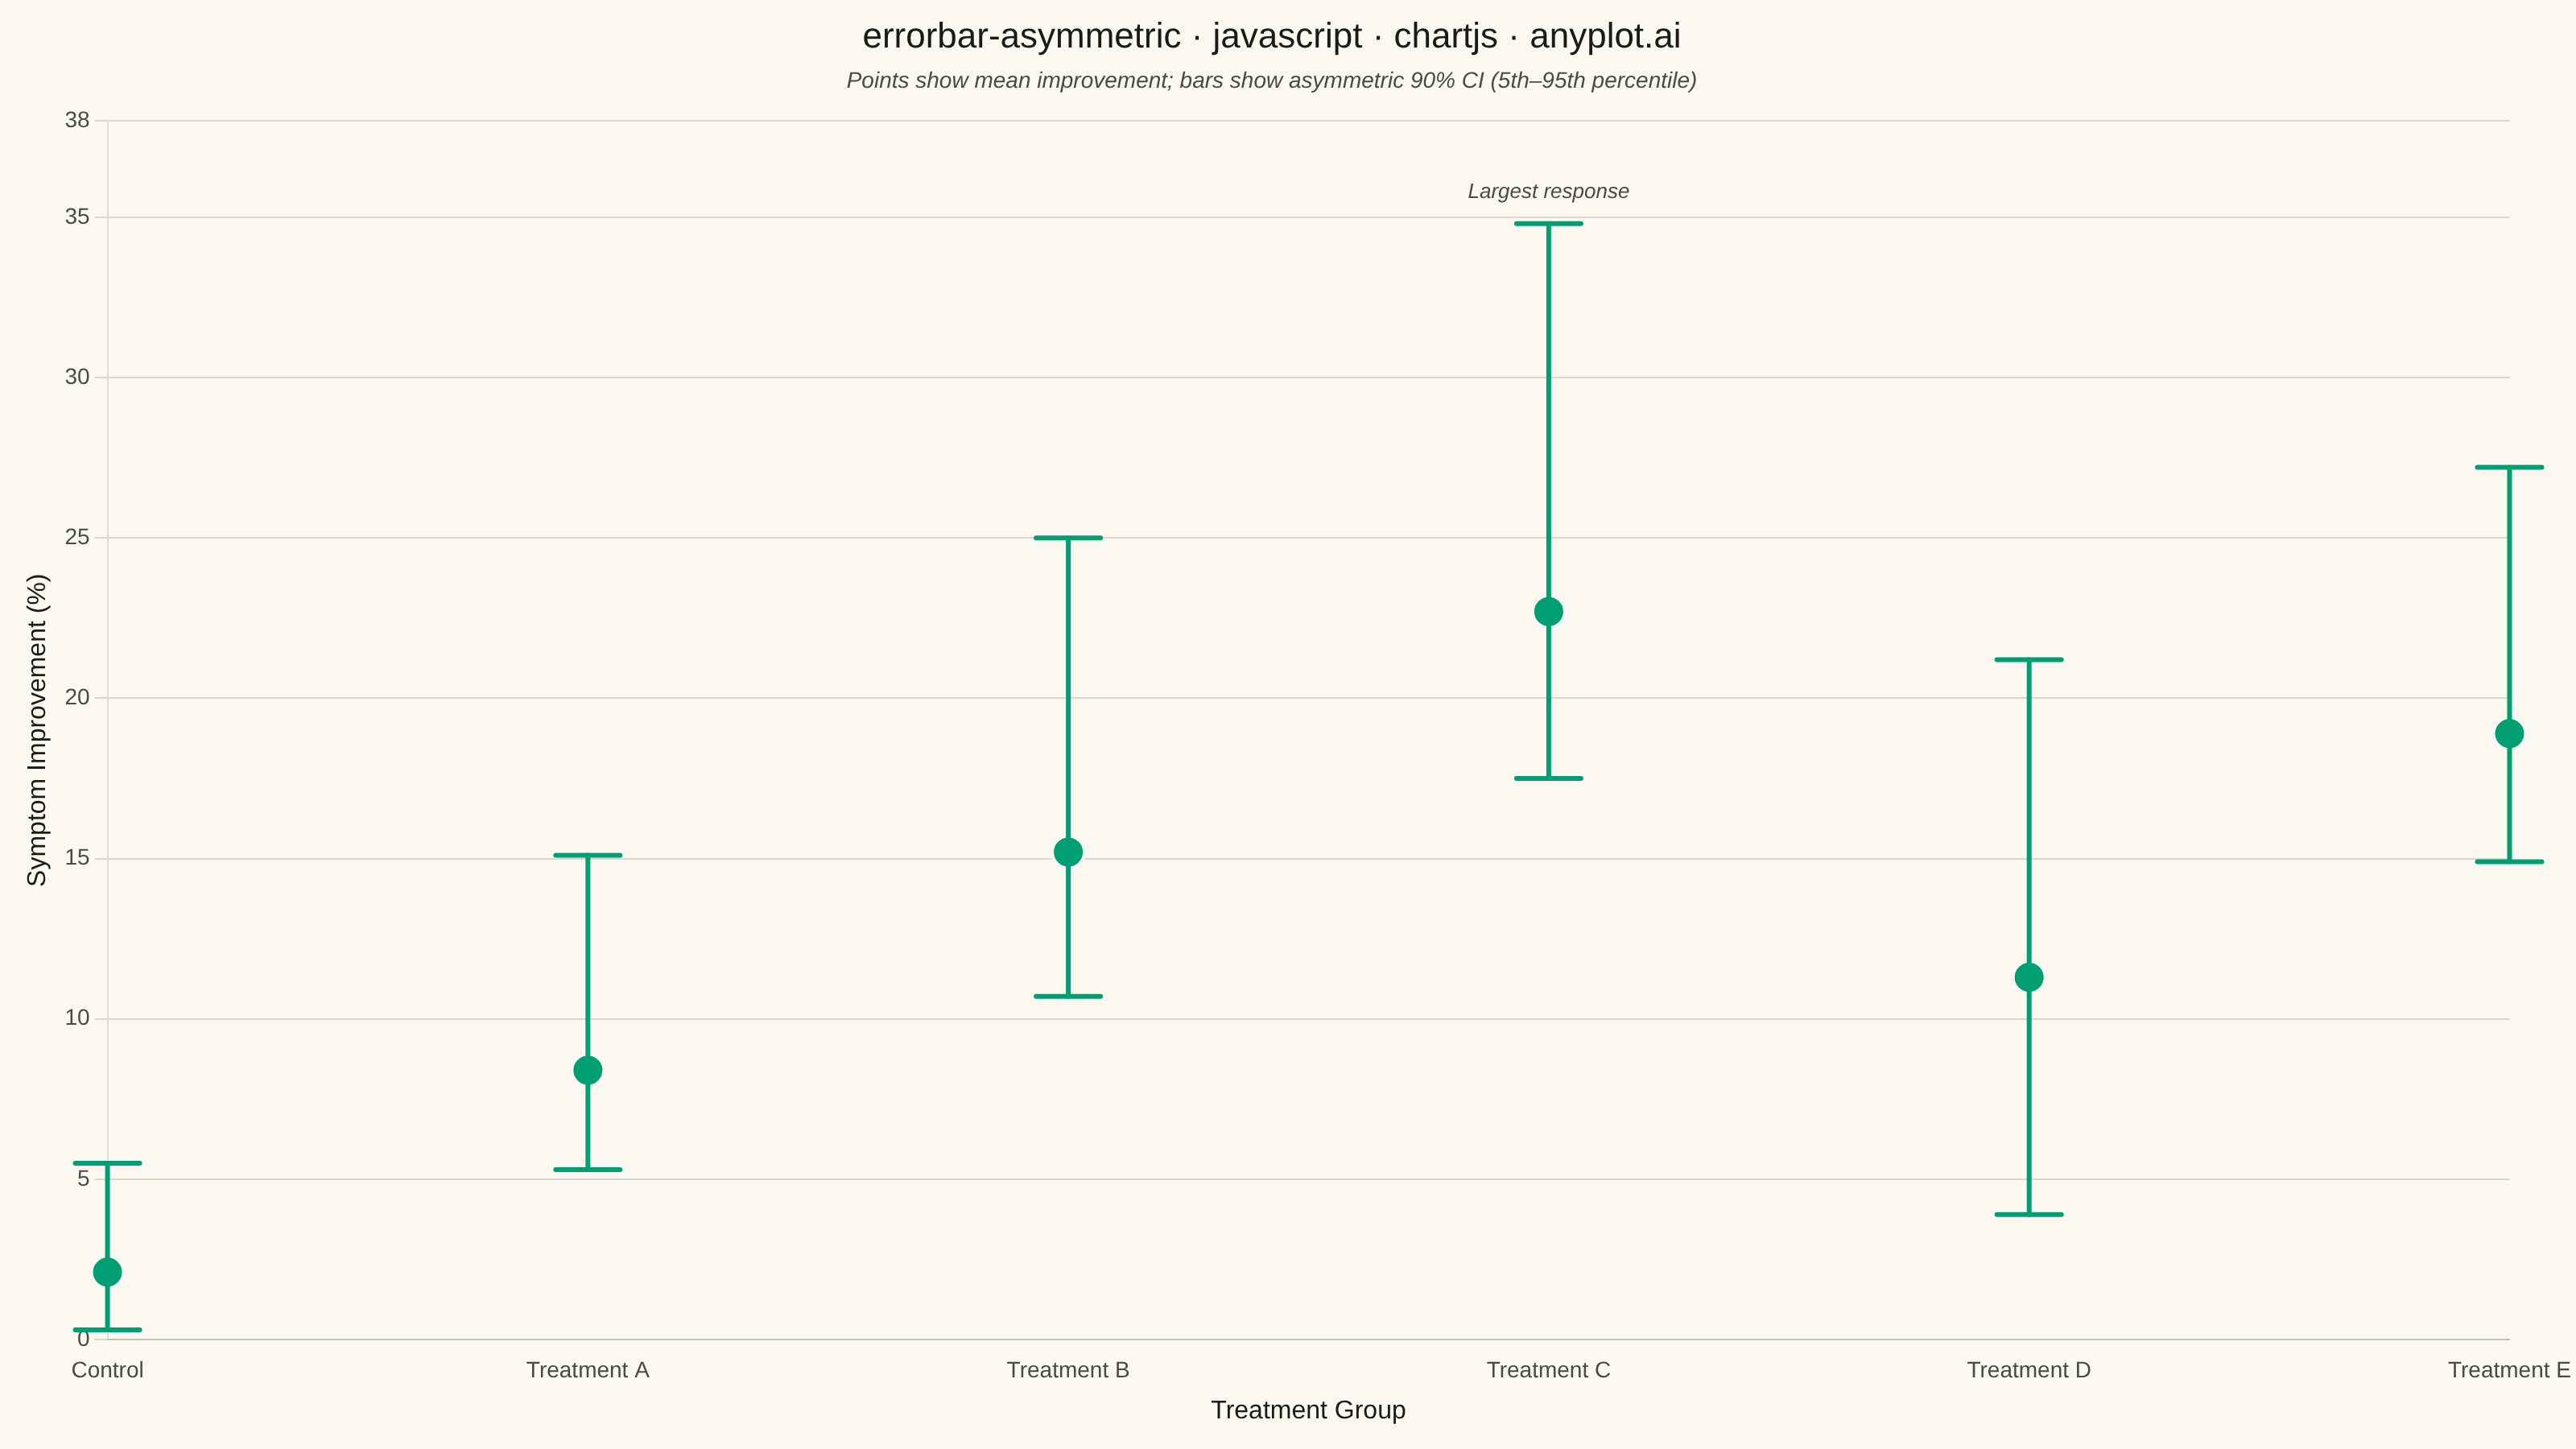
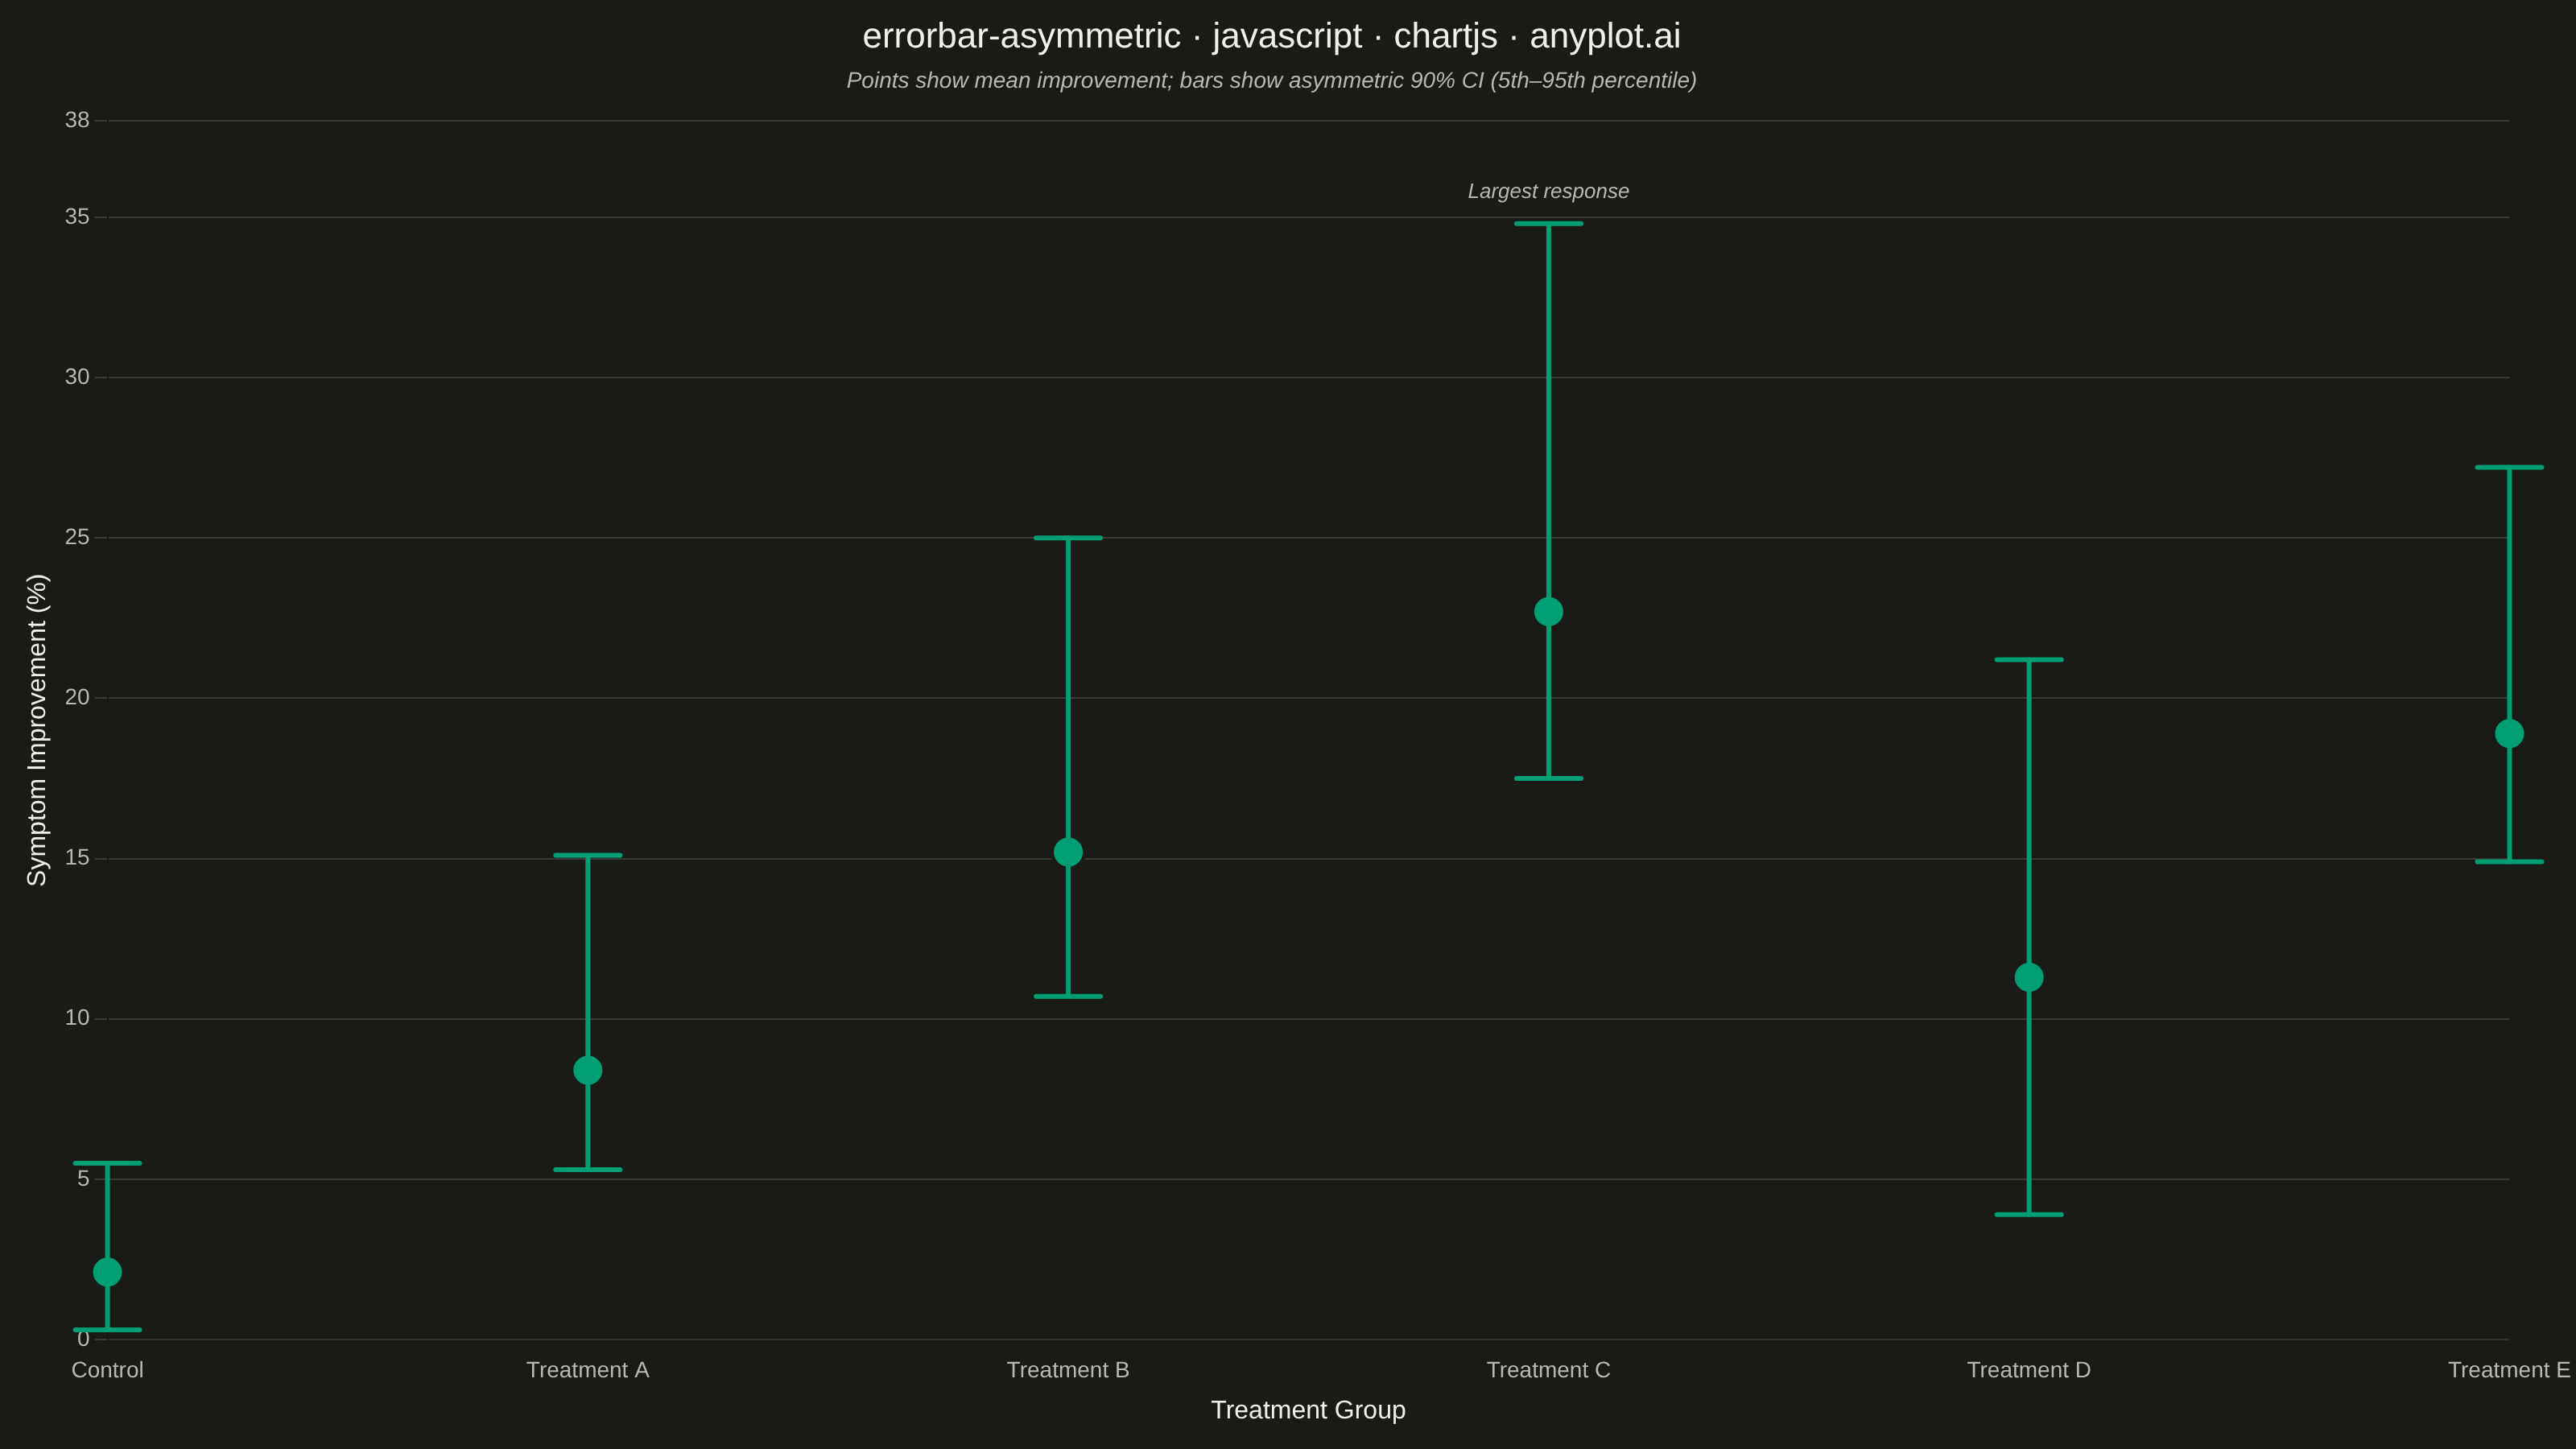
An asymmetric error bar plot displays data points with separate upper and lower error magnitudes, allowing different-sized bars extending above and below each point. This visualization is essential for representing skewed distributions, non-symmetric confidence intervals, or data where uncertainty differs in positive and negative directions. Common applications include percentile-based intervals, log-transformed data, and Bayesian credible intervals.
// anyplot.ai
// errorbar-asymmetric: Asymmetric Error Bars Plot
// Library: chartjs 4.4.7 | JavaScript 22.23.2
// Quality: 86/100 | Created: 2026-09-05

const t = window.ANYPLOT_TOKENS;

// --- Data (in-memory, deterministic) ---------------------------------------
// Mean symptom improvement (%) per treatment group, with asymmetric 90% CI
// bounds (5th-95th percentile) back-transformed from a log-scale model
// (upper bound stretches further than the lower bound for every group).
const treatmentGroups = [
  "Control",
  "Treatment A",
  "Treatment B",
  "Treatment C",
  "Treatment D",
  "Treatment E",
];
const meanImprovement = [2.1, 8.4, 15.2, 22.7, 11.3, 18.9];
const errorLower = [1.8, 3.1, 4.5, 5.2, 7.4, 4.0];
const errorUpper = [3.4, 6.7, 9.8, 12.1, 9.9, 8.3];

const ciBounds = meanImprovement.flatMap((mean, i) => [
  mean - errorLower[i],
  mean + errorUpper[i],
]);
const yAxisMax = Math.ceil((Math.max(...ciBounds) * 1.08) / 2) * 2;
const bestIndex = meanImprovement.indexOf(Math.max(...meanImprovement));

// --- Mount -----------------------------------------------------------------
const canvas = document.createElement("canvas");
document.getElementById("container").appendChild(canvas);

// --- Custom plugin: asymmetric error bar caps -------------------------------
const asymmetricErrorBars = {
  id: "asymmetricErrorBars",
  afterDatasetsDraw(chart) {
    const { ctx, scales } = chart;
    const capHalfWidth = 20;
    ctx.save();
    ctx.strokeStyle = t.palette[0];
    ctx.lineWidth = 3;
    ctx.lineCap = "round";
    treatmentGroups.forEach((_, i) => {
      const xPixel = scales.x.getPixelForValue(i);
      const yLowPixel = scales.y.getPixelForValue(meanImprovement[i] - errorLower[i]);
      const yHighPixel = scales.y.getPixelForValue(meanImprovement[i] + errorUpper[i]);

      ctx.beginPath();
      ctx.moveTo(xPixel, yLowPixel);
      ctx.lineTo(xPixel, yHighPixel);
      ctx.stroke();

      ctx.beginPath();
      ctx.moveTo(xPixel - capHalfWidth, yLowPixel);
      ctx.lineTo(xPixel + capHalfWidth, yLowPixel);
      ctx.moveTo(xPixel - capHalfWidth, yHighPixel);
      ctx.lineTo(xPixel + capHalfWidth, yHighPixel);
      ctx.stroke();
    });
    ctx.restore();

    // Callout on the standout group to give the chart a point of focus.
    const bestXPixel = scales.x.getPixelForValue(bestIndex);
    const bestYPixel = scales.y.getPixelForValue(
      meanImprovement[bestIndex] + errorUpper[bestIndex]
    );
    ctx.save();
    ctx.fillStyle = t.inkSoft;
    ctx.font = "italic 13px sans-serif";
    ctx.textAlign = "center";
    ctx.fillText("Largest response", bestXPixel, bestYPixel - 16);
    ctx.restore();
  },
};

// --- Chart -------------------------------------------------------------------
new Chart(canvas, {
  type: "line",
  data: {
    labels: treatmentGroups,
    datasets: [
      {
        label: "Mean Symptom Improvement (%)",
        data: meanImprovement,
        showLine: false,
        pointBackgroundColor: t.palette[0],
        pointBorderColor: t.pageBg,
        pointBorderWidth: 2,
        pointRadius: 10,
        pointHoverRadius: 10,
      },
    ],
  },
  options: {
    responsive: true,
    maintainAspectRatio: false,
    animation: false,
    layout: { padding: { top: 10, right: 30, bottom: 10, left: 10 } },
    plugins: {
      title: {
        display: true,
        text: "errorbar-asymmetric · javascript · chartjs · anyplot.ai",
        color: t.ink,
        font: { size: 22, weight: "500" },
        padding: { bottom: 6 },
      },
      subtitle: {
        display: true,
        text: "Points show mean improvement; bars show asymmetric 90% CI (5th–95th percentile)",
        color: t.inkSoft,
        font: { size: 14, style: "italic" },
        padding: { bottom: 16 },
      },
      legend: { display: false },
    },
    scales: {
      x: {
        ticks: { color: t.inkSoft, font: { size: 14 } },
        grid: { display: false },
        title: { display: true, text: "Treatment Group", color: t.ink, font: { size: 16 } },
      },
      y: {
        min: 0,
        max: yAxisMax,
        ticks: { color: t.inkSoft, font: { size: 14 } },
        grid: { color: t.grid },
        title: { display: true, text: "Symptom Improvement (%)", color: t.ink, font: { size: 16 } },
      },
    },
  },
  plugins: [asymmetricErrorBars],
});
Runnable source as JSON, for any HTTP client: https://api.anyplot.ai/specs/errorbar-asymmetric/chartjs/code. Any spec id and library id listed in llms-full.txt fit the same URL shape; every URL below is complete and callable.
{
  "spec_id": "errorbar-asymmetric",
  "language": "javascript",
  "library": "chartjs",
  "page": "https://anyplot.ai/errorbar-asymmetric/javascript/chartjs",
  "hub": "https://anyplot.ai/errorbar-asymmetric",
  "code_json": "https://api.anyplot.ai/specs/errorbar-asymmetric/chartjs/code",
  "spec_json": "https://api.anyplot.ai/specs/errorbar-asymmetric",
  "render_light_png": "https://storage.googleapis.com/anyplot-images/plots/errorbar-asymmetric/javascript/chartjs/plot-light.png",
  "render_dark_png": "https://storage.googleapis.com/anyplot-images/plots/errorbar-asymmetric/javascript/chartjs/plot-dark.png",
  "interactive_light_html": "https://storage.googleapis.com/anyplot-images/plots/errorbar-asymmetric/javascript/chartjs/plot-light.html",
  "interactive_dark_html": "https://storage.googleapis.com/anyplot-images/plots/errorbar-asymmetric/javascript/chartjs/plot-dark.html",
  "quality_score": 86.0,
  "license": "MIT",
  "guide": "https://anyplot.ai/llms.txt"
}
Part of Asymmetric Error Bars Plot on anyplot.ai.