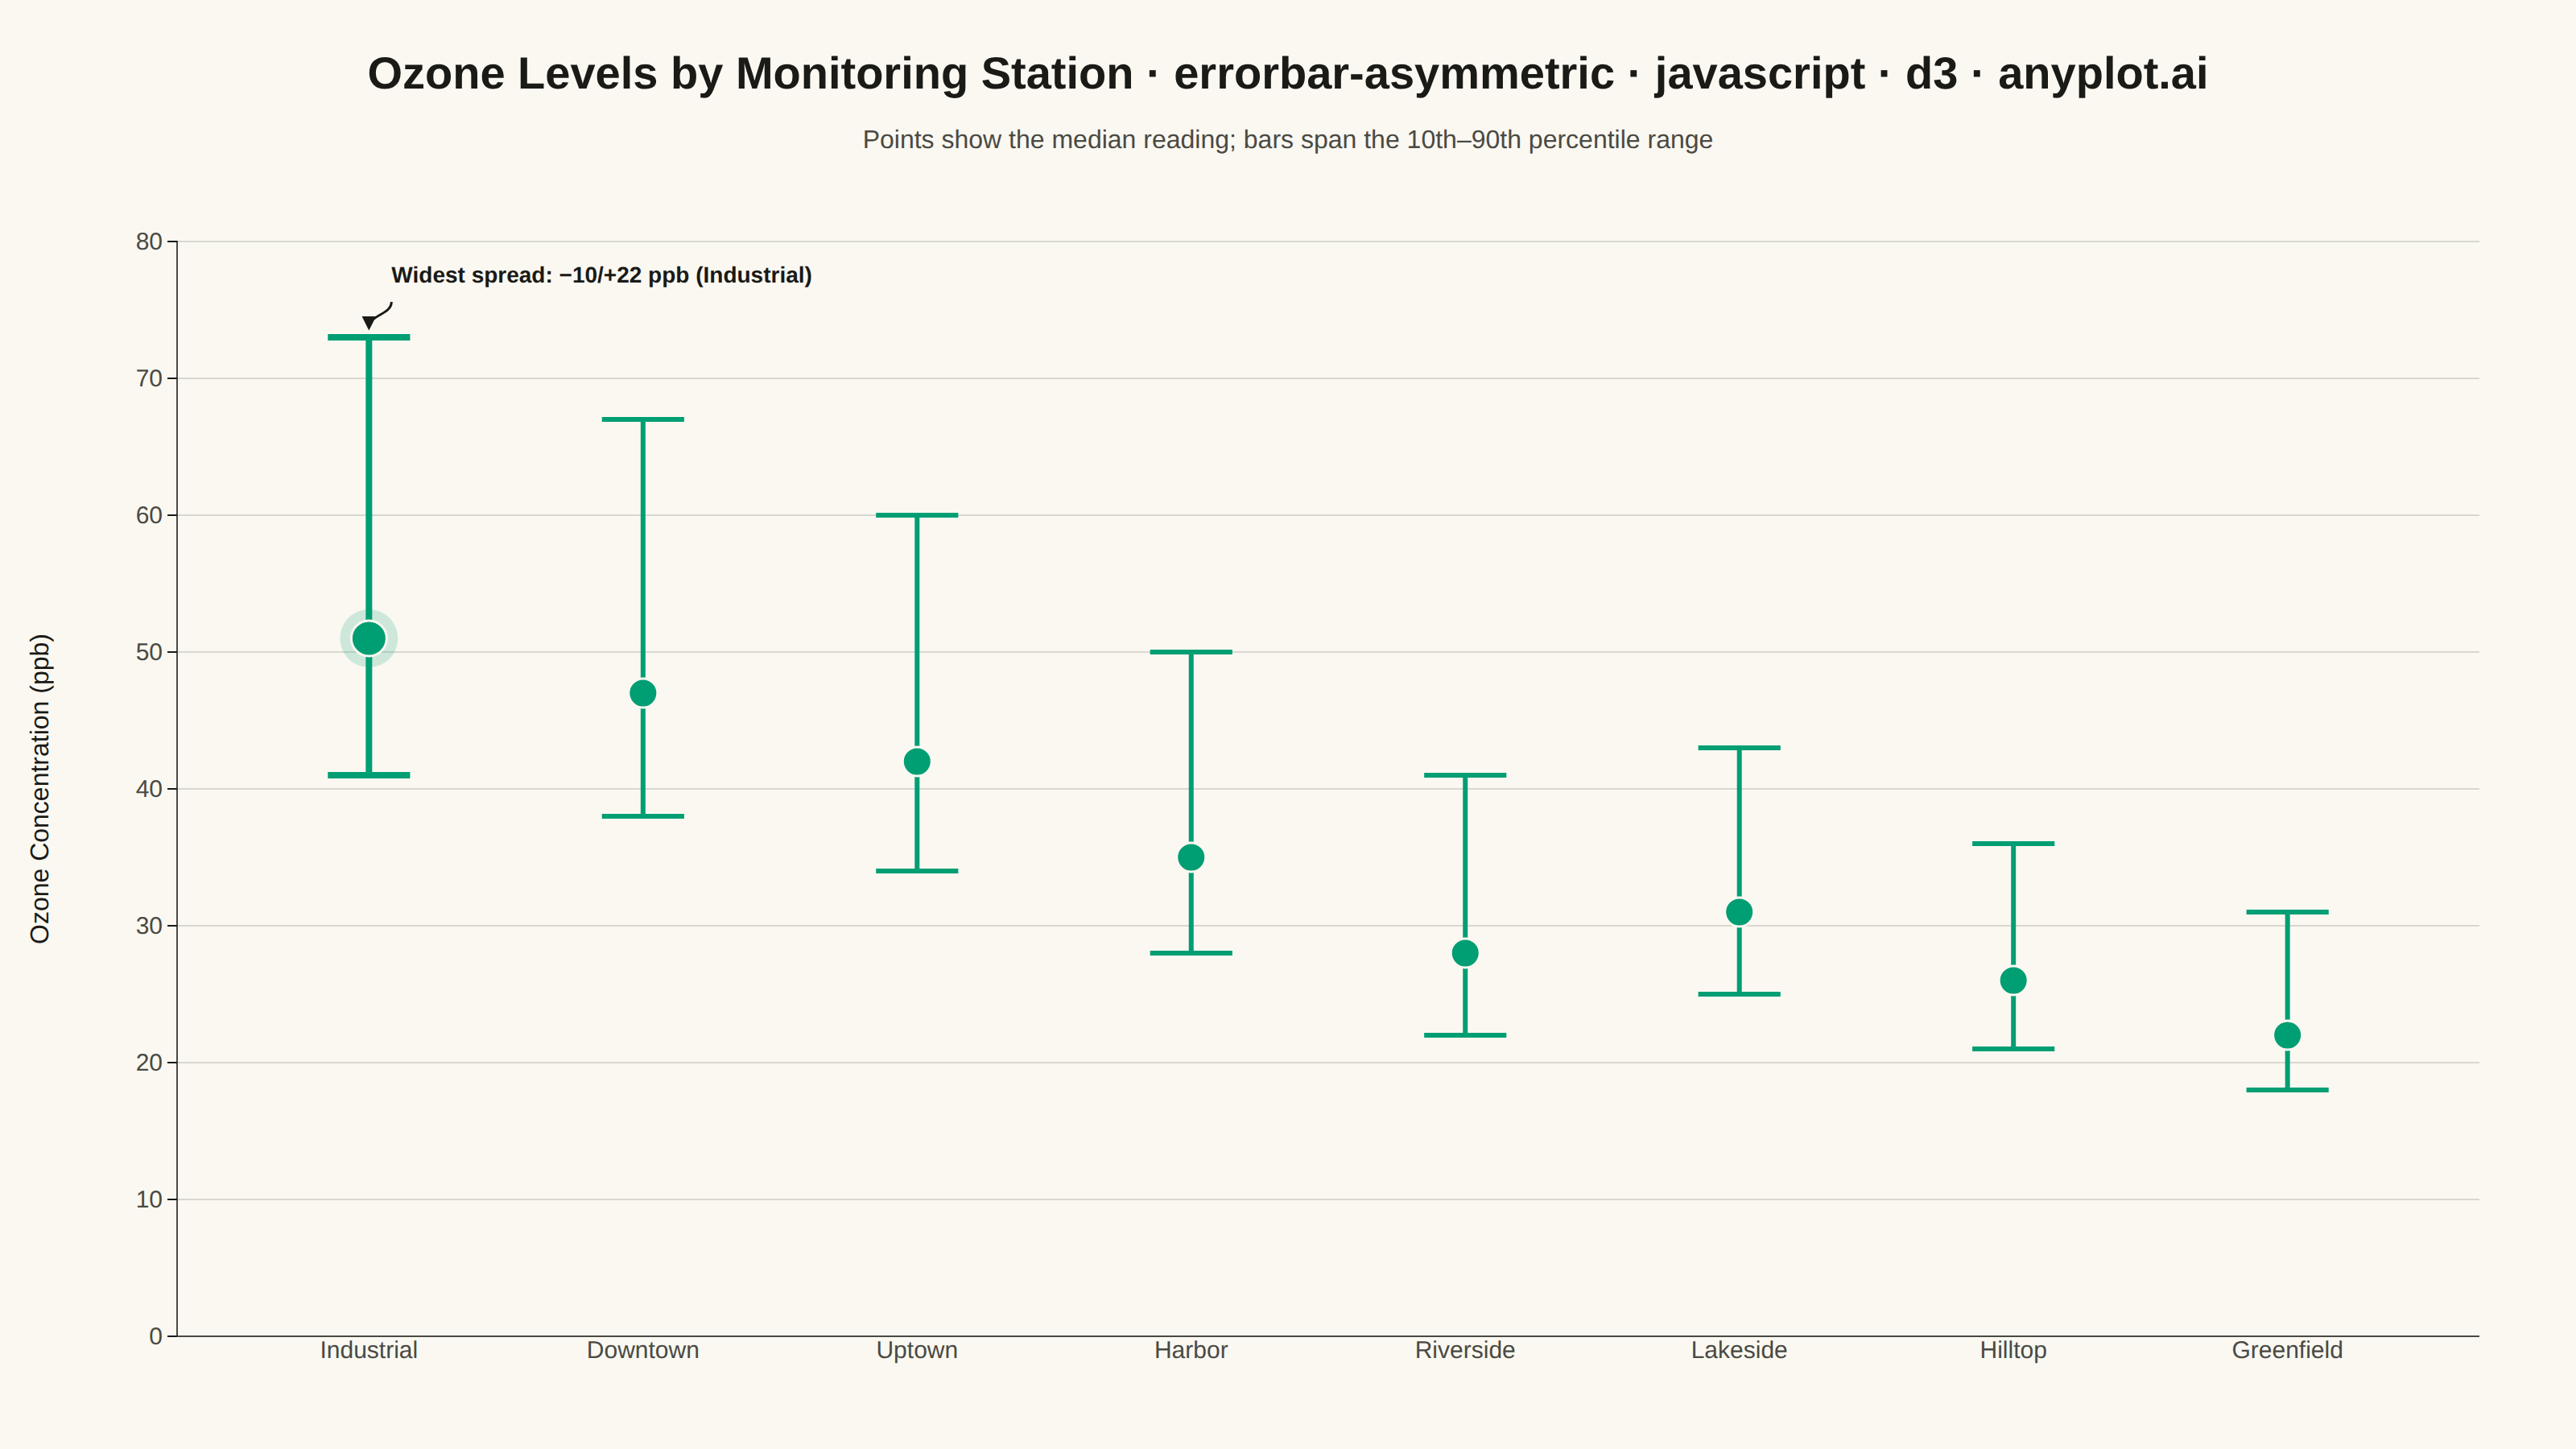
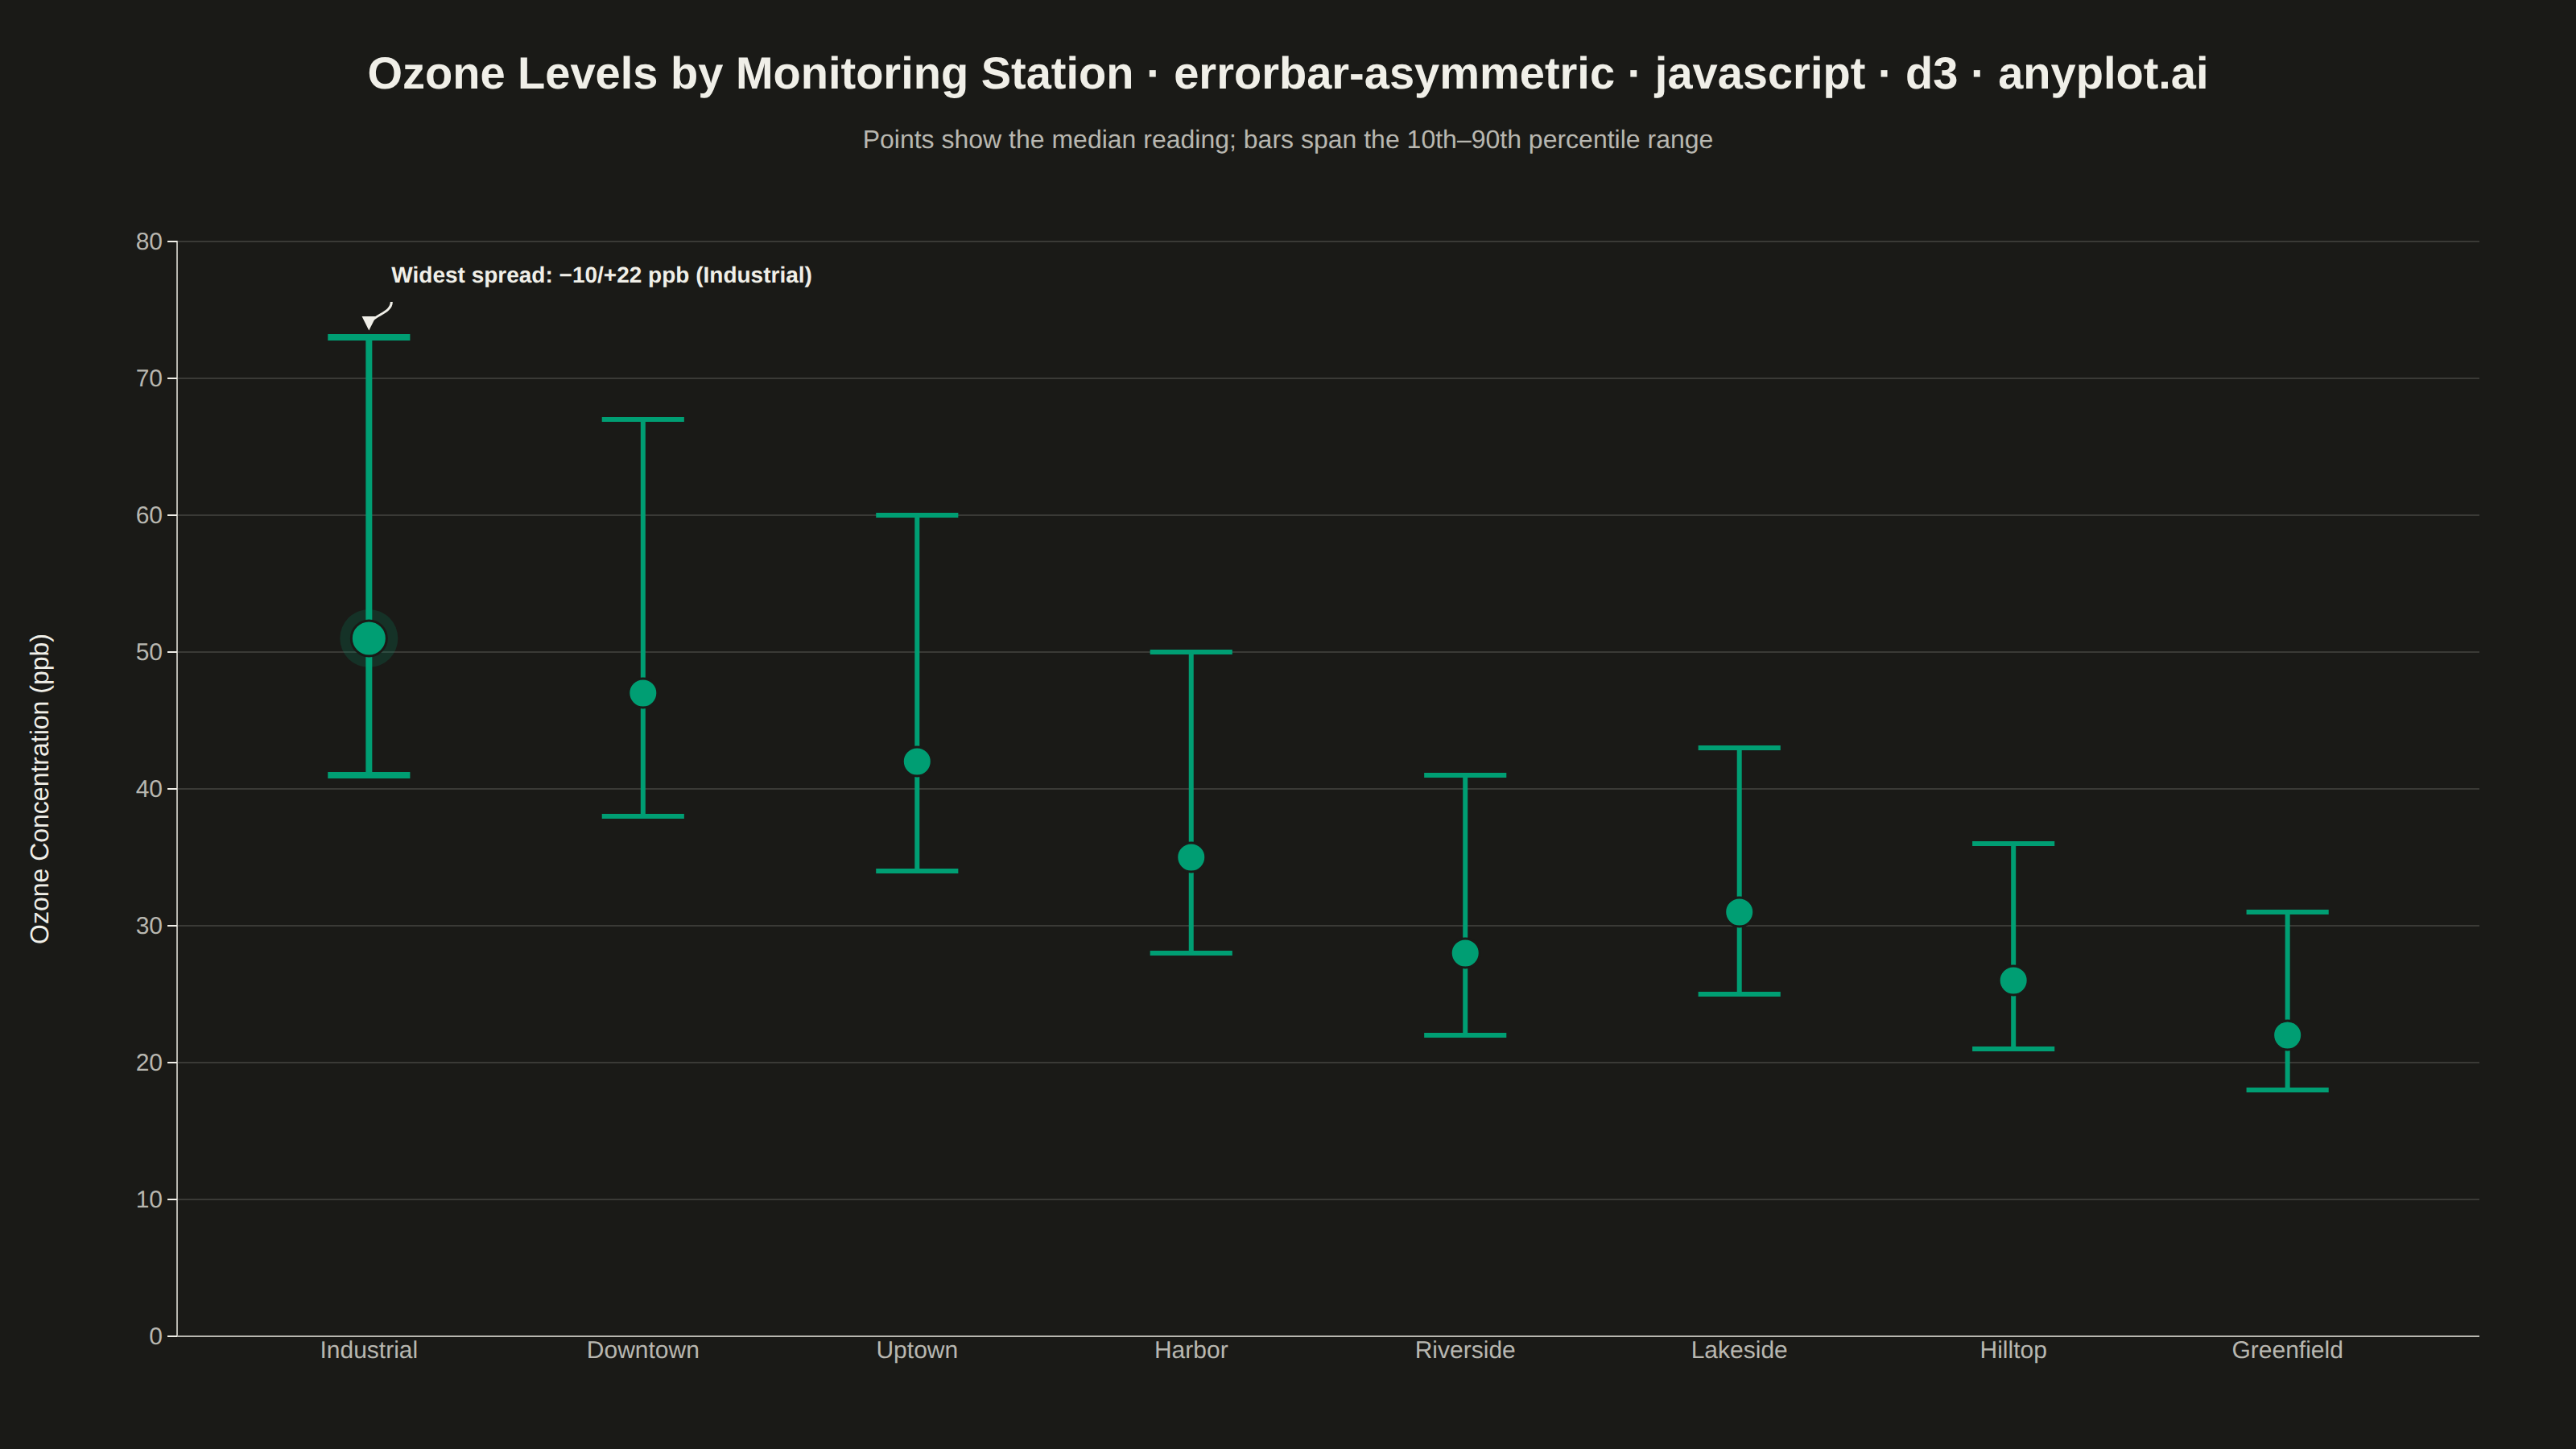
The same plot in 14 other libraries — JavaScript: Chart.js, Apache ECharts, Highcharts, MUI X Charts; Python: Altair, Bokeh, lets-plot, Matplotlib, Plotly, plotnine, Pygal, Seaborn; R: ggplot2; Julia: Makie.jl. Compare all 15 side by side: Asymmetric Error Bars Plot in Python, R, Julia and JavaScript.
An asymmetric error bar plot displays data points with separate upper and lower error magnitudes, allowing different-sized bars extending above and below each point. This visualization is essential for representing skewed distributions, non-symmetric confidence intervals, or data where uncertainty differs in positive and negative directions. Common applications include percentile-based intervals, log-transformed data, and Bayesian credible intervals.
// anyplot.ai
// errorbar-asymmetric: Asymmetric Error Bars Plot
// Library: d3 7.9.0 | JavaScript 22.23.2
// Quality: 91/100 | Created: 2026-09-05

const t = window.ANYPLOT_TOKENS;
const { width, height } = window.ANYPLOT_SIZE;
const margin = { top: 150, right: 60, bottom: 70, left: 110 };
const iw = width - margin.left - margin.right;
const ih = height - margin.top - margin.bottom;

// --- Data: ozone readings per station, 10th-90th percentile bounds ---------
// Right-skewed spread (pollution spikes push the upper tail out further
// than the lower tail) — a canonical case for asymmetric error bars.
// Sorted by total spread (upper + lower) descending so the eye moves from
// the least-certain reading to the most-certain one, left to right.
const stations = [
  { station: "Riverside", median: 28, lower: 6, upper: 13 },
  { station: "Uptown", median: 42, lower: 8, upper: 18 },
  { station: "Harbor", median: 35, lower: 7, upper: 15 },
  { station: "Industrial", median: 51, lower: 10, upper: 22 },
  { station: "Greenfield", median: 22, lower: 4, upper: 9 },
  { station: "Lakeside", median: 31, lower: 6, upper: 12 },
  { station: "Downtown", median: 47, lower: 9, upper: 20 },
  { station: "Hilltop", median: 26, lower: 5, upper: 10 },
].sort((a, b) => b.upper + b.lower - (a.upper + a.lower));

// Station with the widest asymmetric spread — the focal point of the chart.
const focus = stations[0];

// --- SVG mount ---------------------------------------------------------------
const svg = d3
  .select("#container")
  .append("svg")
  .attr("width", width)
  .attr("height", height);
const g = svg
  .append("g")
  .attr("transform", `translate(${margin.left},${margin.top})`);

// --- Scales --------------------------------------------------------------------
const x = d3
  .scaleBand()
  .domain(stations.map((d) => d.station))
  .range([0, iw])
  .padding(0.4);
const y = d3
  .scaleLinear()
  .domain([0, d3.max(stations, (d) => d.median + d.upper)])
  .nice()
  .range([ih, 0]);

// --- Gridlines (y-axis only) ---------------------------------------------------
g.append("g")
  .call(d3.axisLeft(y).tickSize(-iw).tickFormat(""))
  .call((sel) => sel.select(".domain").remove())
  .selectAll("line")
  .attr("stroke", t.grid);

// --- Axes ------------------------------------------------------------------
const xAxis = g
  .append("g")
  .attr("transform", `translate(0,${ih})`)
  .call(d3.axisBottom(x).tickSize(0));
const yAxis = g.append("g").call(d3.axisLeft(y).ticks(6));
for (const ax of [xAxis, yAxis]) {
  ax.selectAll("text").attr("fill", t.inkSoft).style("font-size", "15px");
  ax.select(".domain").attr("stroke", t.inkSoft);
}
xAxis.select(".domain").attr("stroke", t.inkSoft);
g.append("text")
  .attr("transform", "rotate(-90)")
  .attr("x", -ih / 2)
  .attr("y", -80)
  .attr("text-anchor", "middle")
  .attr("fill", t.ink)
  .style("font-size", "16px")
  .text("Ozone Concentration (ppb)");

// --- Asymmetric error bars ------------------------------------------------
const capWidth = x.bandwidth() * 0.5;
const bar = g
  .selectAll(".errorbar")
  .data(stations)
  .join("g")
  .attr("class", "errorbar")
  .attr("transform", (d) => `translate(${x(d.station) + x.bandwidth() / 2},0)`);

bar
  .append("line")
  .attr("y1", (d) => y(d.median - d.lower))
  .attr("y2", (d) => y(d.median + d.upper))
  .attr("stroke", t.palette[0])
  .attr("stroke-width", (d) => (d === focus ? 4 : 3));

bar
  .append("line")
  .attr("x1", -capWidth / 2)
  .attr("x2", capWidth / 2)
  .attr("y1", (d) => y(d.median - d.lower))
  .attr("y2", (d) => y(d.median - d.lower))
  .attr("stroke", t.palette[0])
  .attr("stroke-width", (d) => (d === focus ? 4 : 3));

bar
  .append("line")
  .attr("x1", -capWidth / 2)
  .attr("x2", capWidth / 2)
  .attr("y1", (d) => y(d.median + d.upper))
  .attr("y2", (d) => y(d.median + d.upper))
  .attr("stroke", t.palette[0])
  .attr("stroke-width", (d) => (d === focus ? 4 : 3));

// Soft halo behind the focal station's marker — the visual entry point.
bar
  .filter((d) => d === focus)
  .append("circle")
  .attr("cy", (d) => y(d.median))
  .attr("r", 18)
  .attr("fill", t.palette[0])
  .attr("fill-opacity", 0.18);

bar
  .append("circle")
  .attr("cy", (d) => y(d.median))
  .attr("r", (d) => (d === focus ? 11 : 9))
  .attr("fill", t.palette[0])
  .attr("stroke", t.pageBg)
  .attr("stroke-width", 1.5);

// --- Callout annotation for the widest-spread station -----------------------
// Built with d3-shape's linkVertical() — the same connector generator used
// for tree/hierarchy edges — repurposed here to draw a genuine D3-authored
// annotation arrow rather than a static line.
const focusX = x(focus.station) + x.bandwidth() / 2;
const focusCapY = y(focus.median + focus.upper);
const calloutSide = focusX < iw / 2 ? 1 : -1;
const labelX = focusX + calloutSide * 14;
const labelY = Math.max(focusCapY - 34, 14);

svg
  .append("defs")
  .append("marker")
  .attr("id", "calloutArrow")
  .attr("viewBox", "0 0 10 10")
  .attr("refX", 8)
  .attr("refY", 5)
  .attr("markerWidth", 6)
  .attr("markerHeight", 6)
  .attr("orient", "auto-start-reverse")
  .append("path")
  .attr("d", "M0,0L10,5L0,10z")
  .attr("fill", t.ink);

const calloutLink = d3
  .linkVertical()
  .x((p) => p.x)
  .y((p) => p.y);
g.append("path")
  .attr(
    "d",
    calloutLink({
      source: { x: labelX, y: labelY + 12 },
      target: { x: focusX, y: focusCapY - 6 },
    }),
  )
  .attr("fill", "none")
  .attr("stroke", t.ink)
  .attr("stroke-width", 1.5)
  .attr("marker-end", "url(#calloutArrow)");

g.append("text")
  .attr("x", labelX)
  .attr("y", labelY)
  .attr("text-anchor", calloutSide === 1 ? "start" : "end")
  .attr("fill", t.ink)
  .style("font-size", "14px")
  .style("font-weight", "600")
  .text(`Widest spread: −${focus.lower}/+${focus.upper} ppb (${focus.station})`);

// --- Title + subtitle --------------------------------------------------------
const title =
  "Ozone Levels by Monitoring Station · errorbar-asymmetric · javascript · d3 · anyplot.ai";
const titleFontSize = Math.round(36 * Math.min(1, 67 / title.length));
svg
  .append("text")
  .attr("x", width / 2)
  .attr("y", 55)
  .attr("text-anchor", "middle")
  .attr("fill", t.ink)
  .style("font-size", `${titleFontSize}px`)
  .style("font-weight", "600")
  .text(title);

svg
  .append("text")
  .attr("x", width / 2)
  .attr("y", 92)
  .attr("text-anchor", "middle")
  .attr("fill", t.inkSoft)
  .style("font-size", "16px")
  .text(
    "Points show the median reading; bars span the 10th–90th percentile range",
  );
Runnable source as JSON, for any HTTP client: https://api.anyplot.ai/specs/errorbar-asymmetric/d3/code. Any spec id and library id listed in llms-full.txt fit the same URL shape; every URL below is complete and callable.
{
  "spec_id": "errorbar-asymmetric",
  "language": "javascript",
  "library": "d3",
  "page": "https://anyplot.ai/errorbar-asymmetric/javascript/d3",
  "hub": "https://anyplot.ai/errorbar-asymmetric",
  "code_json": "https://api.anyplot.ai/specs/errorbar-asymmetric/d3/code",
  "spec_json": "https://api.anyplot.ai/specs/errorbar-asymmetric",
  "render_light_png": "https://storage.googleapis.com/anyplot-images/plots/errorbar-asymmetric/javascript/d3/plot-light.png",
  "render_dark_png": "https://storage.googleapis.com/anyplot-images/plots/errorbar-asymmetric/javascript/d3/plot-dark.png",
  "interactive_light_html": "https://storage.googleapis.com/anyplot-images/plots/errorbar-asymmetric/javascript/d3/plot-light.html",
  "interactive_dark_html": "https://storage.googleapis.com/anyplot-images/plots/errorbar-asymmetric/javascript/d3/plot-dark.html",
  "quality_score": 91.0,
  "license": "MIT",
  "guide": "https://anyplot.ai/llms.txt"
}
Part of Asymmetric Error Bars Plot on anyplot.ai.