The same plot in 14 other libraries — JavaScript: Chart.js, D3.js, Apache ECharts, MUI X Charts; Python: Altair, Bokeh, lets-plot, Matplotlib, Plotly, plotnine, Pygal, Seaborn; R: ggplot2; Julia: Makie.jl. Compare all 15 side by side: Asymmetric Error Bars Plot in Python, R, Julia and JavaScript.
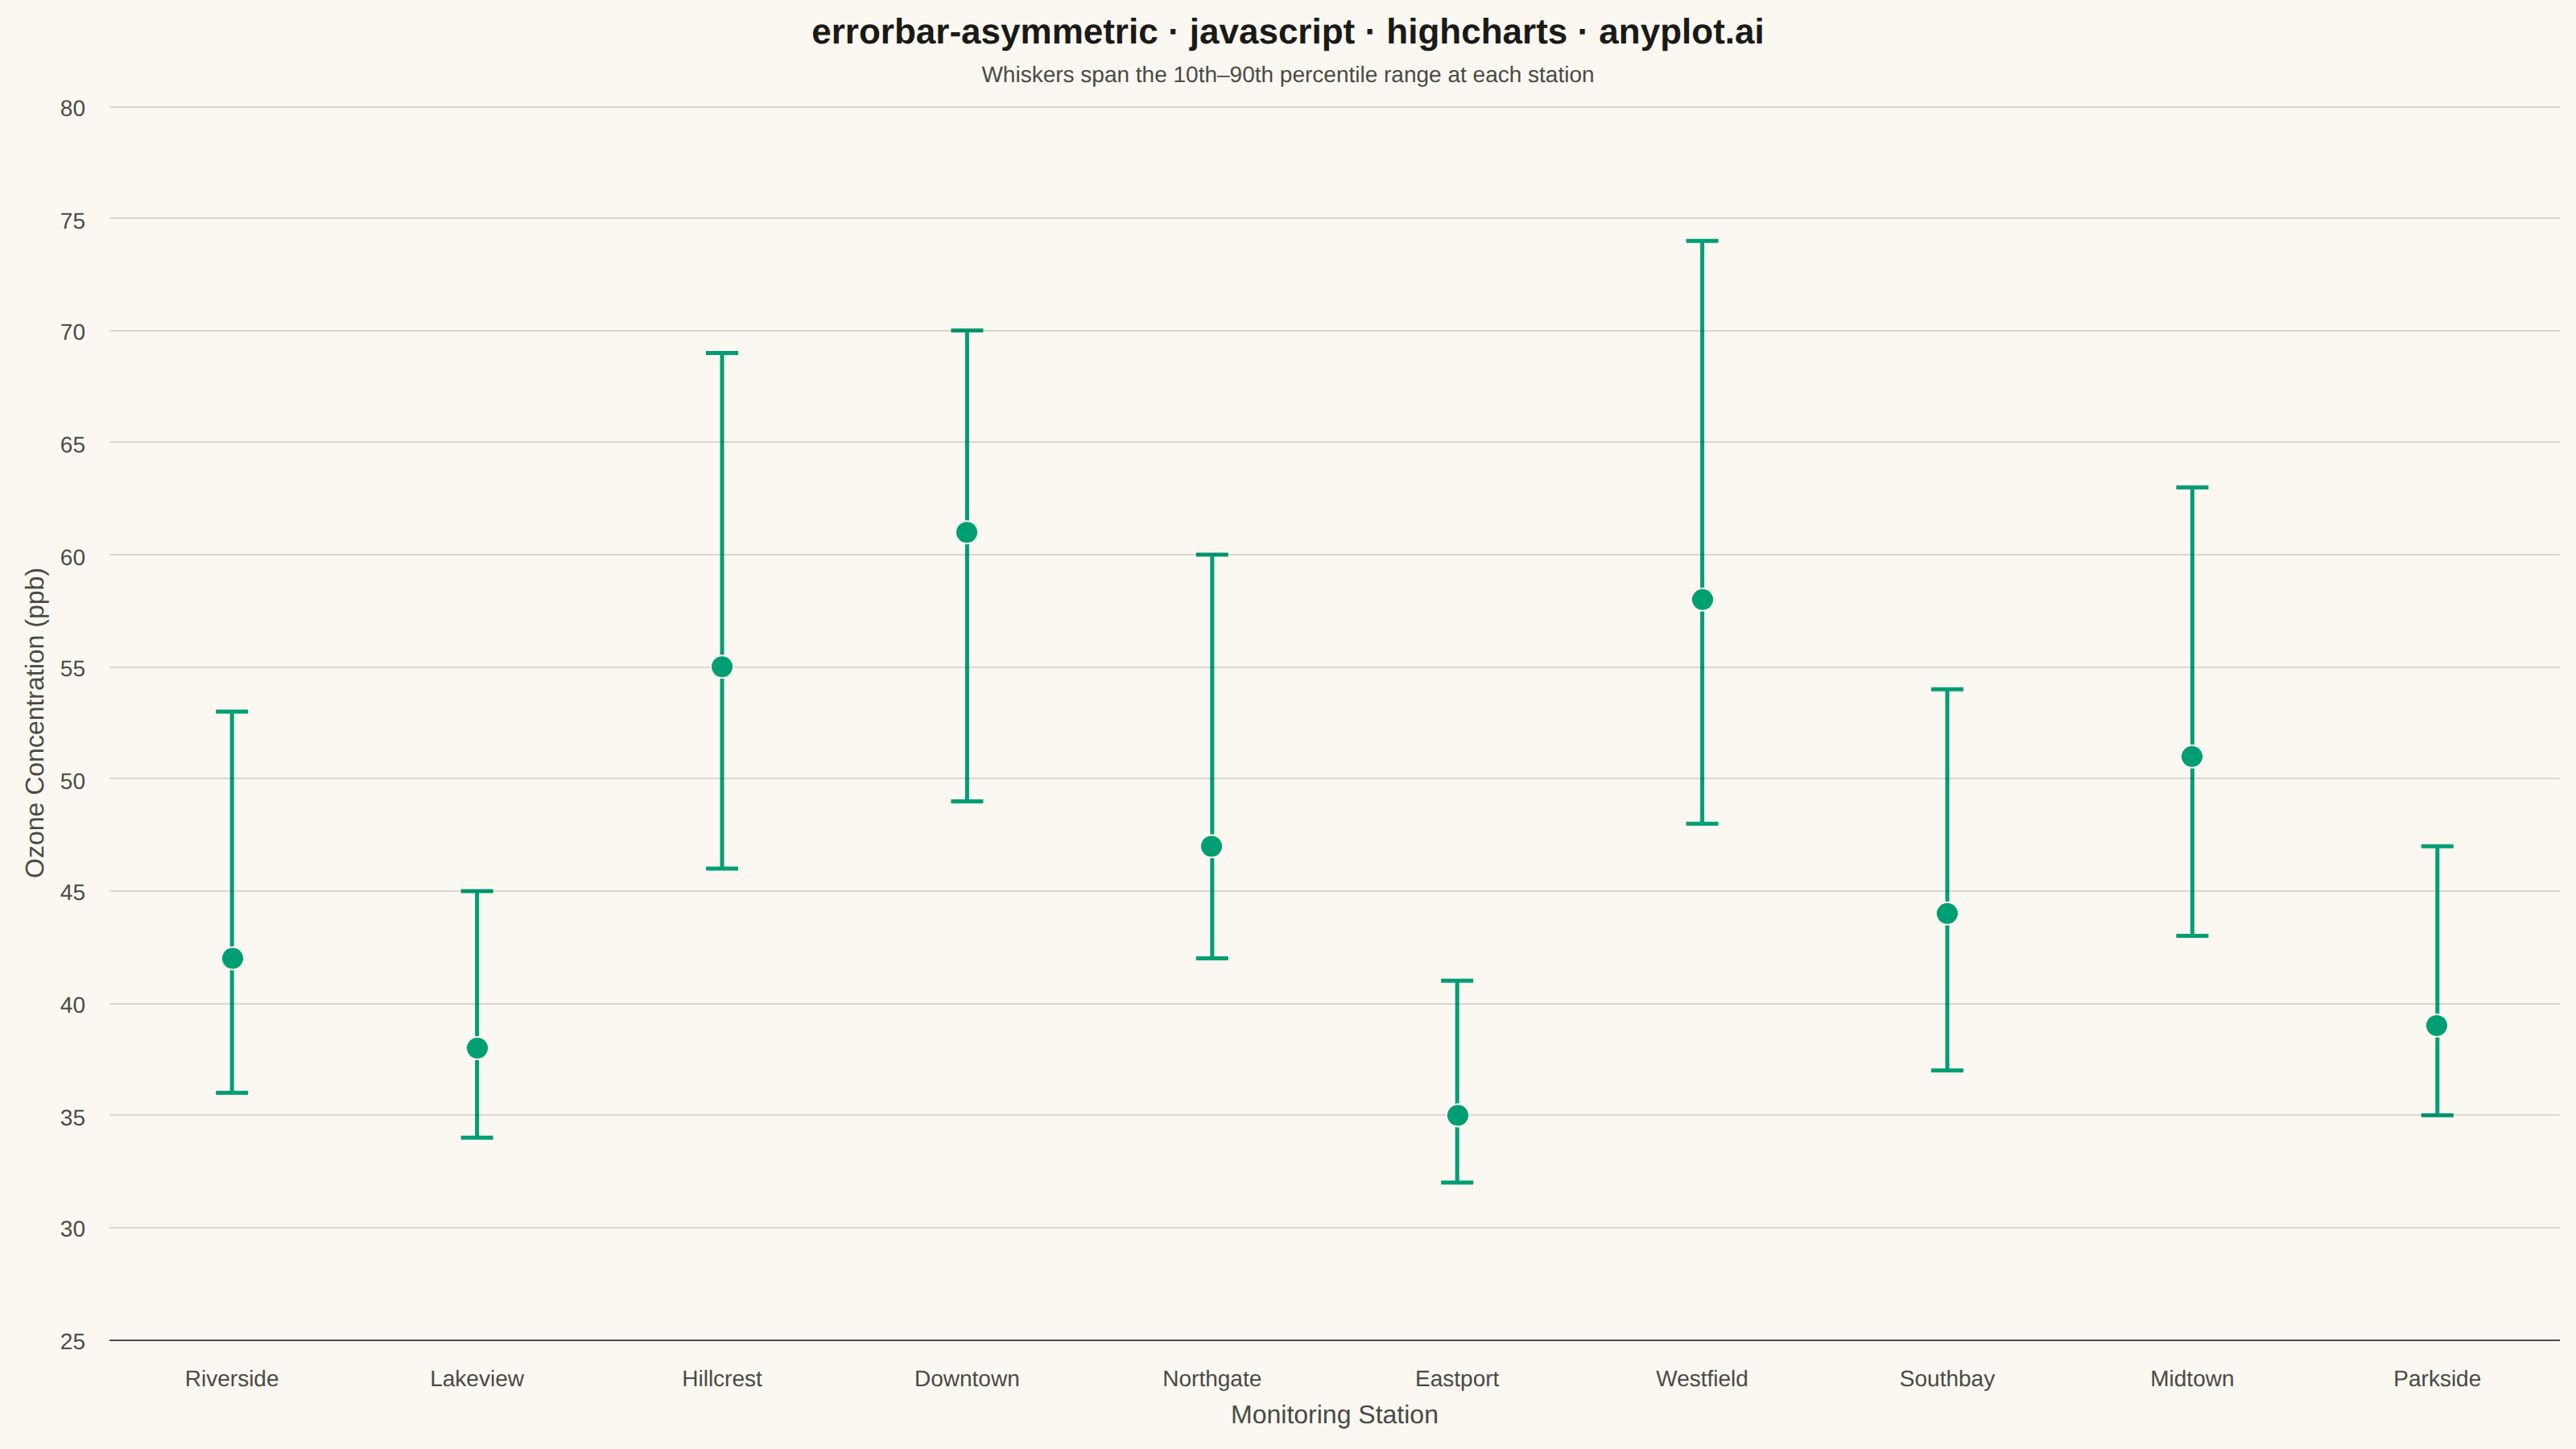
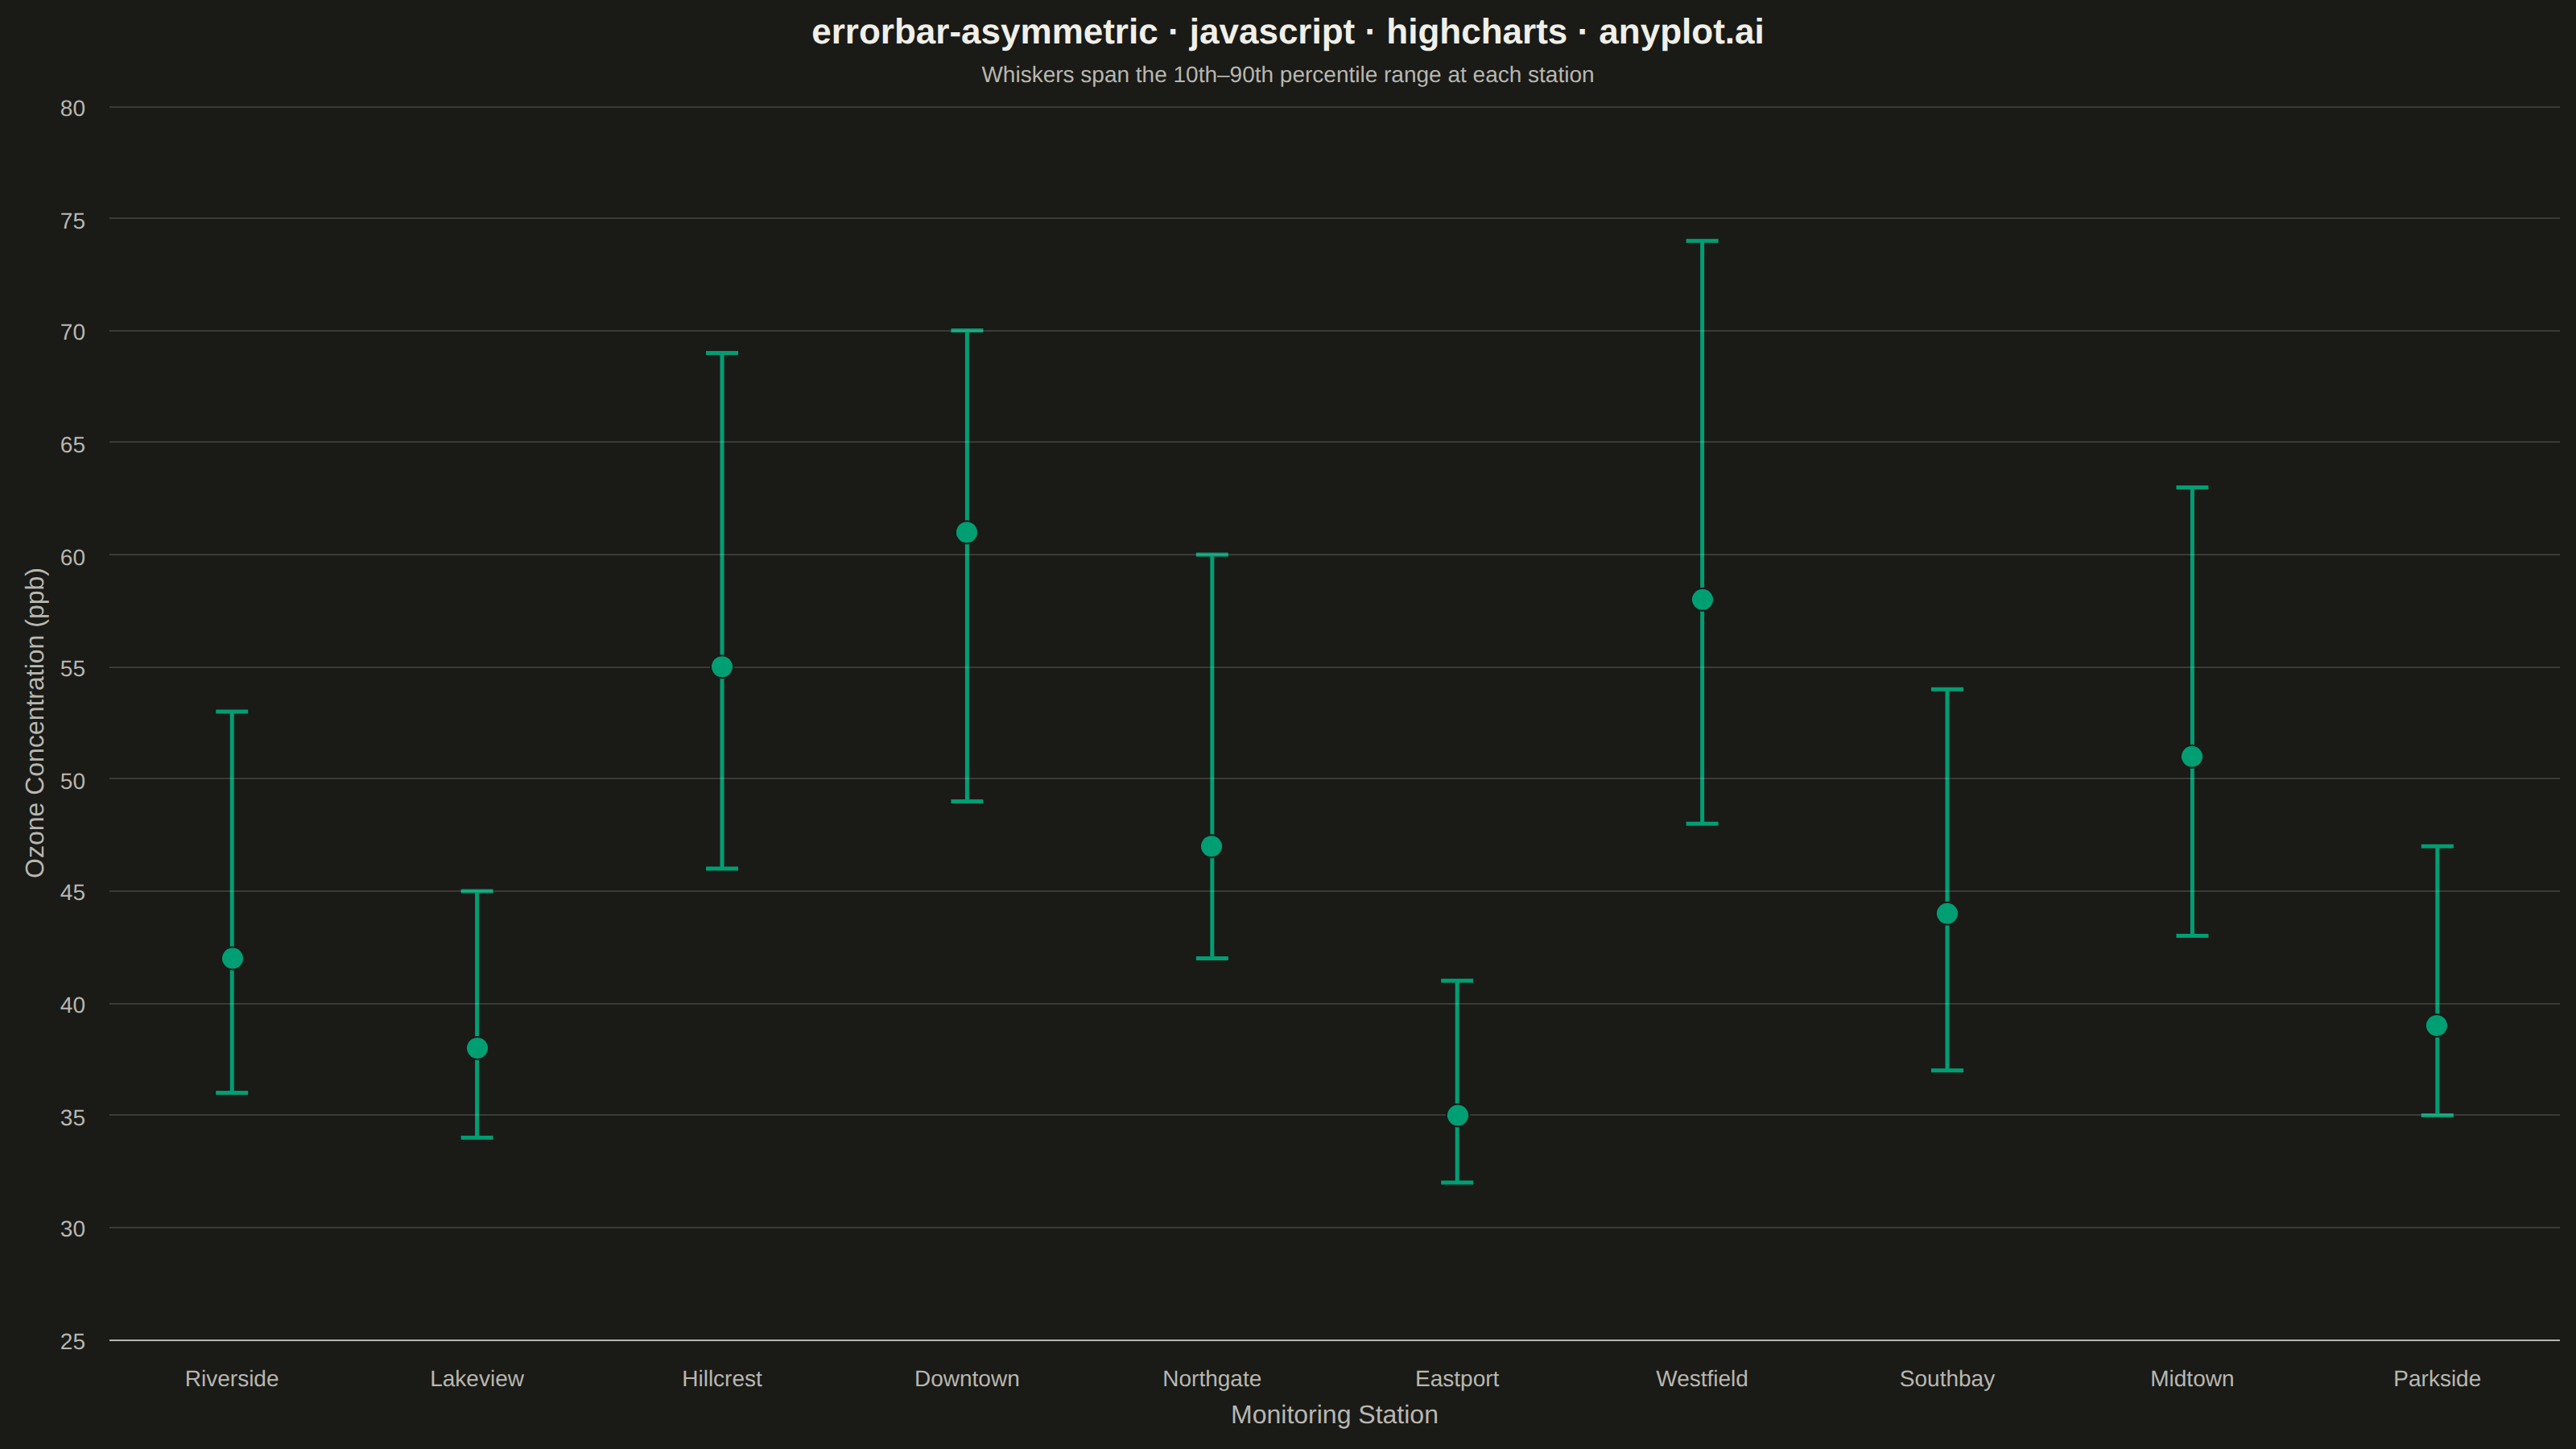
An asymmetric error bar plot displays data points with separate upper and lower error magnitudes, allowing different-sized bars extending above and below each point. This visualization is essential for representing skewed distributions, non-symmetric confidence intervals, or data where uncertainty differs in positive and negative directions. Common applications include percentile-based intervals, log-transformed data, and Bayesian credible intervals.
// anyplot.ai
// errorbar-asymmetric: Asymmetric Error Bars Plot
// Library: highcharts 12.6.0 | JavaScript 22.23.2
// Quality: 90/100 | Created: 2026-09-05

//# anyplot-orientation: landscape
const t = window.ANYPLOT_TOKENS;

// --- Data (in-memory, deterministic) ----------------------------------------
// Ozone readings at 10 monitoring stations. Bounds are asymmetric because the
// instrument's detection ceiling clips high excursions more than low ones.
const stations = [
  "Riverside", "Lakeview", "Hillcrest", "Downtown", "Northgate",
  "Eastport", "Westfield", "Southbay", "Midtown", "Parkside",
];
const ozoneLevels = [42, 38, 55, 61, 47, 35, 58, 44, 51, 39]; // ppb, median reading
const lowerBounds = [6, 4, 9, 12, 5, 3, 10, 7, 8, 4]; // ppb below median (10th pct)
const upperBounds = [11, 7, 14, 9, 13, 6, 16, 10, 12, 8]; // ppb above median (90th pct)

const lowerValues = ozoneLevels.map((v, i) => v - lowerBounds[i]);
const upperValues = ozoneLevels.map((v, i) => v + upperBounds[i]);
const rangePad = (Math.max(...upperValues) - Math.min(...lowerValues)) * 0.08;

// --- Custom whiskers ---------------------------------------------------------
// The core bundle has no errorbar series (that lives in highcharts-more, which
// is not loaded), so the asymmetric whiskers are drawn with the renderer,
// positioned through the real axis-to-pixel mapping on every chart render.
const capHalfWidth = 10;

const drawErrorBars = (chart) => {
  if (chart.errorBarGroup) chart.errorBarGroup.destroy();
  const group = chart.renderer.g("error-bars").add();
  const xAxis = chart.xAxis[0];
  const yAxis = chart.yAxis[0];

  stations.forEach((_, i) => {
    const xPixel = xAxis.toPixels(i);
    const yTop = yAxis.toPixels(upperValues[i]);
    const yBottom = yAxis.toPixels(lowerValues[i]);

    [
      ["M", xPixel, yTop, "L", xPixel, yBottom],
      ["M", xPixel - capHalfWidth, yTop, "L", xPixel + capHalfWidth, yTop],
      ["M", xPixel - capHalfWidth, yBottom, "L", xPixel + capHalfWidth, yBottom],
    ].forEach((path) => {
      chart.renderer.path(path).attr({ "stroke-width": 2.5, stroke: t.palette[0] }).add(group);
    });
  });

  chart.errorBarGroup = group;
};

// --- Chart -------------------------------------------------------------------
Highcharts.chart("container", {
  chart: {
    type: "scatter",
    backgroundColor: "transparent",
    animation: false,
    style: { fontFamily: "inherit" },
    events: { render: function () { drawErrorBars(this); } },
  },
  credits: { enabled: false },
  colors: t.palette,
  title: {
    text: "errorbar-asymmetric · javascript · highcharts · anyplot.ai",
    style: { color: t.ink, fontSize: "22px", fontWeight: "600" },
  },
  subtitle: {
    text: "Whiskers span the 10th–90th percentile range at each station",
    style: { color: t.inkSoft, fontSize: "14px" },
  },
  xAxis: {
    categories: stations,
    lineColor: t.inkSoft,
    tickColor: t.inkSoft,
    labels: { style: { color: t.inkSoft, fontSize: "14px" } },
    title: { text: "Monitoring Station", style: { color: t.inkSoft, fontSize: "16px" } },
  },
  yAxis: {
    min: Math.floor(Math.min(...lowerValues) - rangePad),
    max: Math.ceil(Math.max(...upperValues) + rangePad),
    gridLineColor: t.grid,
    labels: { style: { color: t.inkSoft, fontSize: "14px" } },
    title: { text: "Ozone Concentration (ppb)", style: { color: t.inkSoft, fontSize: "16px" } },
  },
  legend: { enabled: false },
  tooltip: {
    backgroundColor: t.elevatedBg,
    borderColor: t.inkSoft,
    style: { color: t.ink, fontSize: "14px" },
    formatter: function () {
      const i = this.point.index;
      return `<b>${stations[i]}</b><br/>Median: ${ozoneLevels[i]} ppb<br/>` +
        `10th–90th pct: ${lowerValues[i]}–${upperValues[i]} ppb`;
    },
  },
  plotOptions: {
    series: { animation: false },
    scatter: { marker: { radius: 7, fillColor: t.palette[0], lineColor: t.pageBg, lineWidth: 1 } },
  },
  series: [{
    name: "Median ozone level",
    data: stations.map((_, i) => ({ x: i, y: ozoneLevels[i] })),
    color: t.palette[0],
  }],
});
Runnable source as JSON, for any HTTP client: https://api.anyplot.ai/specs/errorbar-asymmetric/highcharts/code. Any spec id and library id listed in llms-full.txt fit the same URL shape; every URL below is complete and callable.
{
  "spec_id": "errorbar-asymmetric",
  "language": "javascript",
  "library": "highcharts",
  "page": "https://anyplot.ai/errorbar-asymmetric/javascript/highcharts",
  "hub": "https://anyplot.ai/errorbar-asymmetric",
  "code_json": "https://api.anyplot.ai/specs/errorbar-asymmetric/highcharts/code",
  "spec_json": "https://api.anyplot.ai/specs/errorbar-asymmetric",
  "render_light_png": "https://storage.googleapis.com/anyplot-images/plots/errorbar-asymmetric/javascript/highcharts/plot-light.png",
  "render_dark_png": "https://storage.googleapis.com/anyplot-images/plots/errorbar-asymmetric/javascript/highcharts/plot-dark.png",
  "interactive_light_html": "https://storage.googleapis.com/anyplot-images/plots/errorbar-asymmetric/javascript/highcharts/plot-light.html",
  "interactive_dark_html": "https://storage.googleapis.com/anyplot-images/plots/errorbar-asymmetric/javascript/highcharts/plot-dark.html",
  "quality_score": 90.0,
  "license": "MIT",
  "guide": "https://anyplot.ai/llms.txt"
}
Part of Asymmetric Error Bars Plot on anyplot.ai.