The same plot in 14 other libraries — JavaScript: D3.js, Apache ECharts, Highcharts, MUI X Charts; Python: Altair, Bokeh, lets-plot, Matplotlib, Plotly, plotnine, Pygal, Seaborn; R: ggplot2; Julia: Makie.jl. Compare all 15 side by side: Feynman Diagram for Particle Interactions in Python, R, Julia and JavaScript.
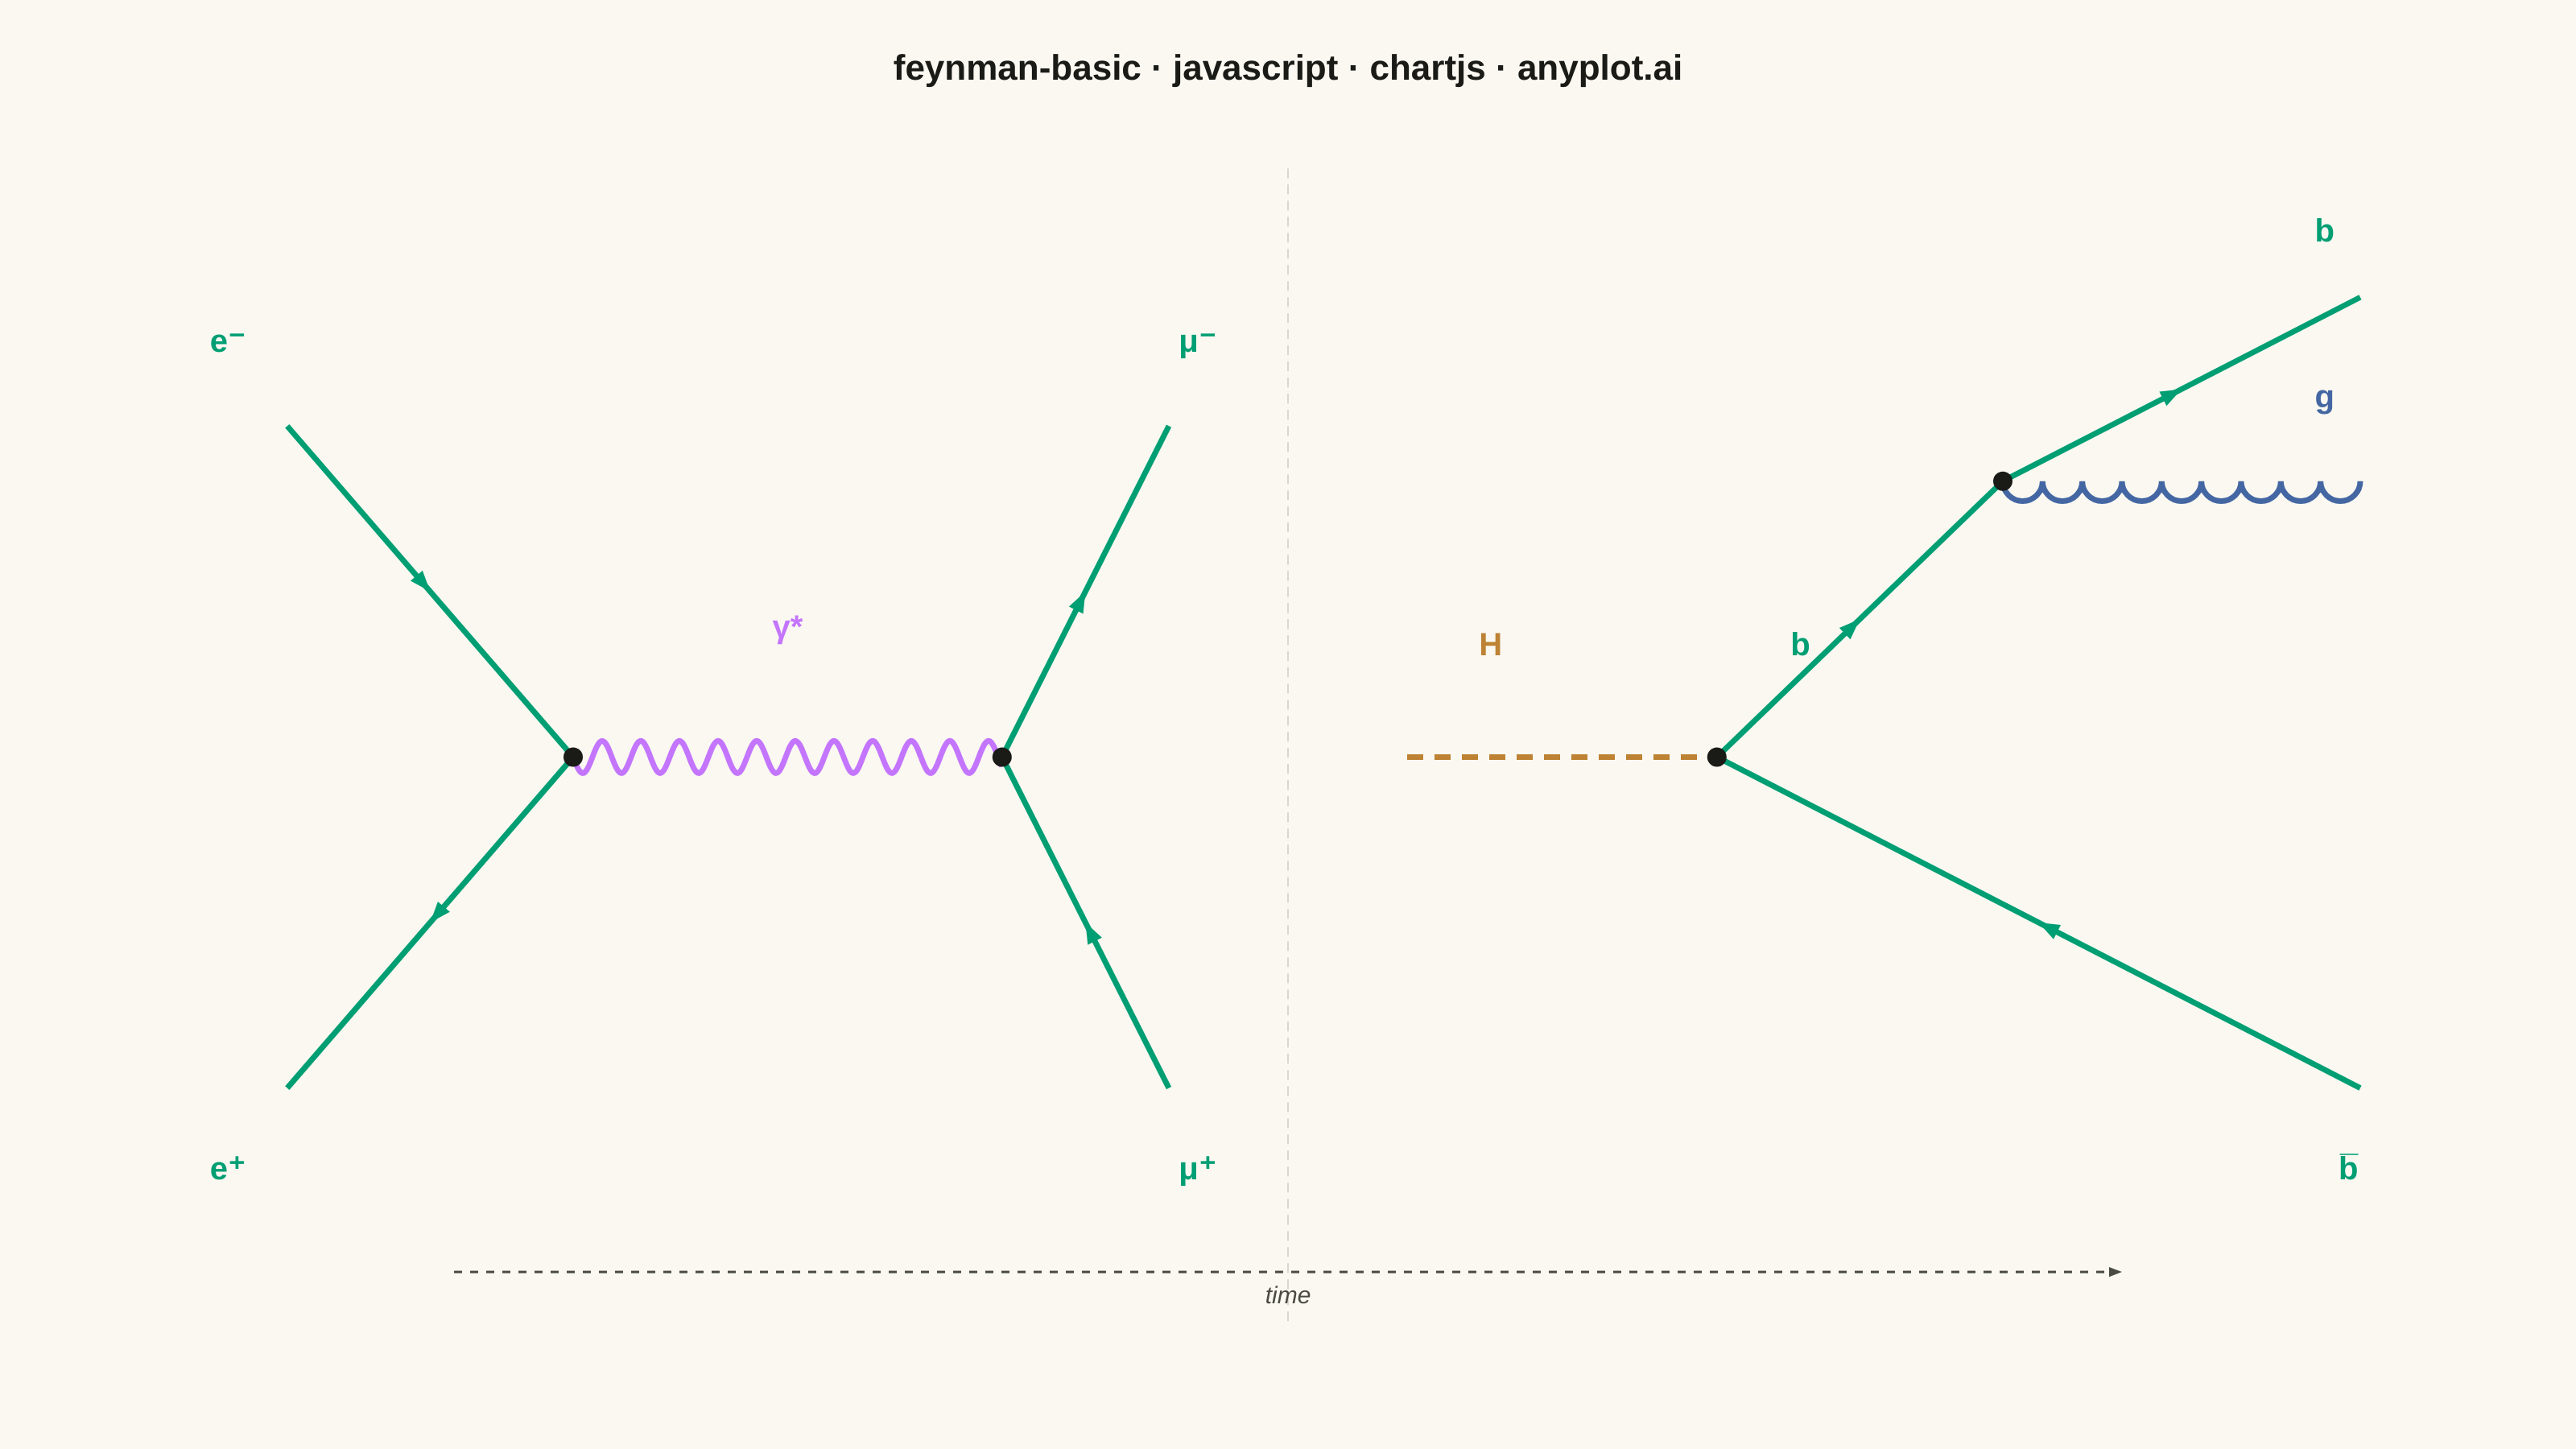
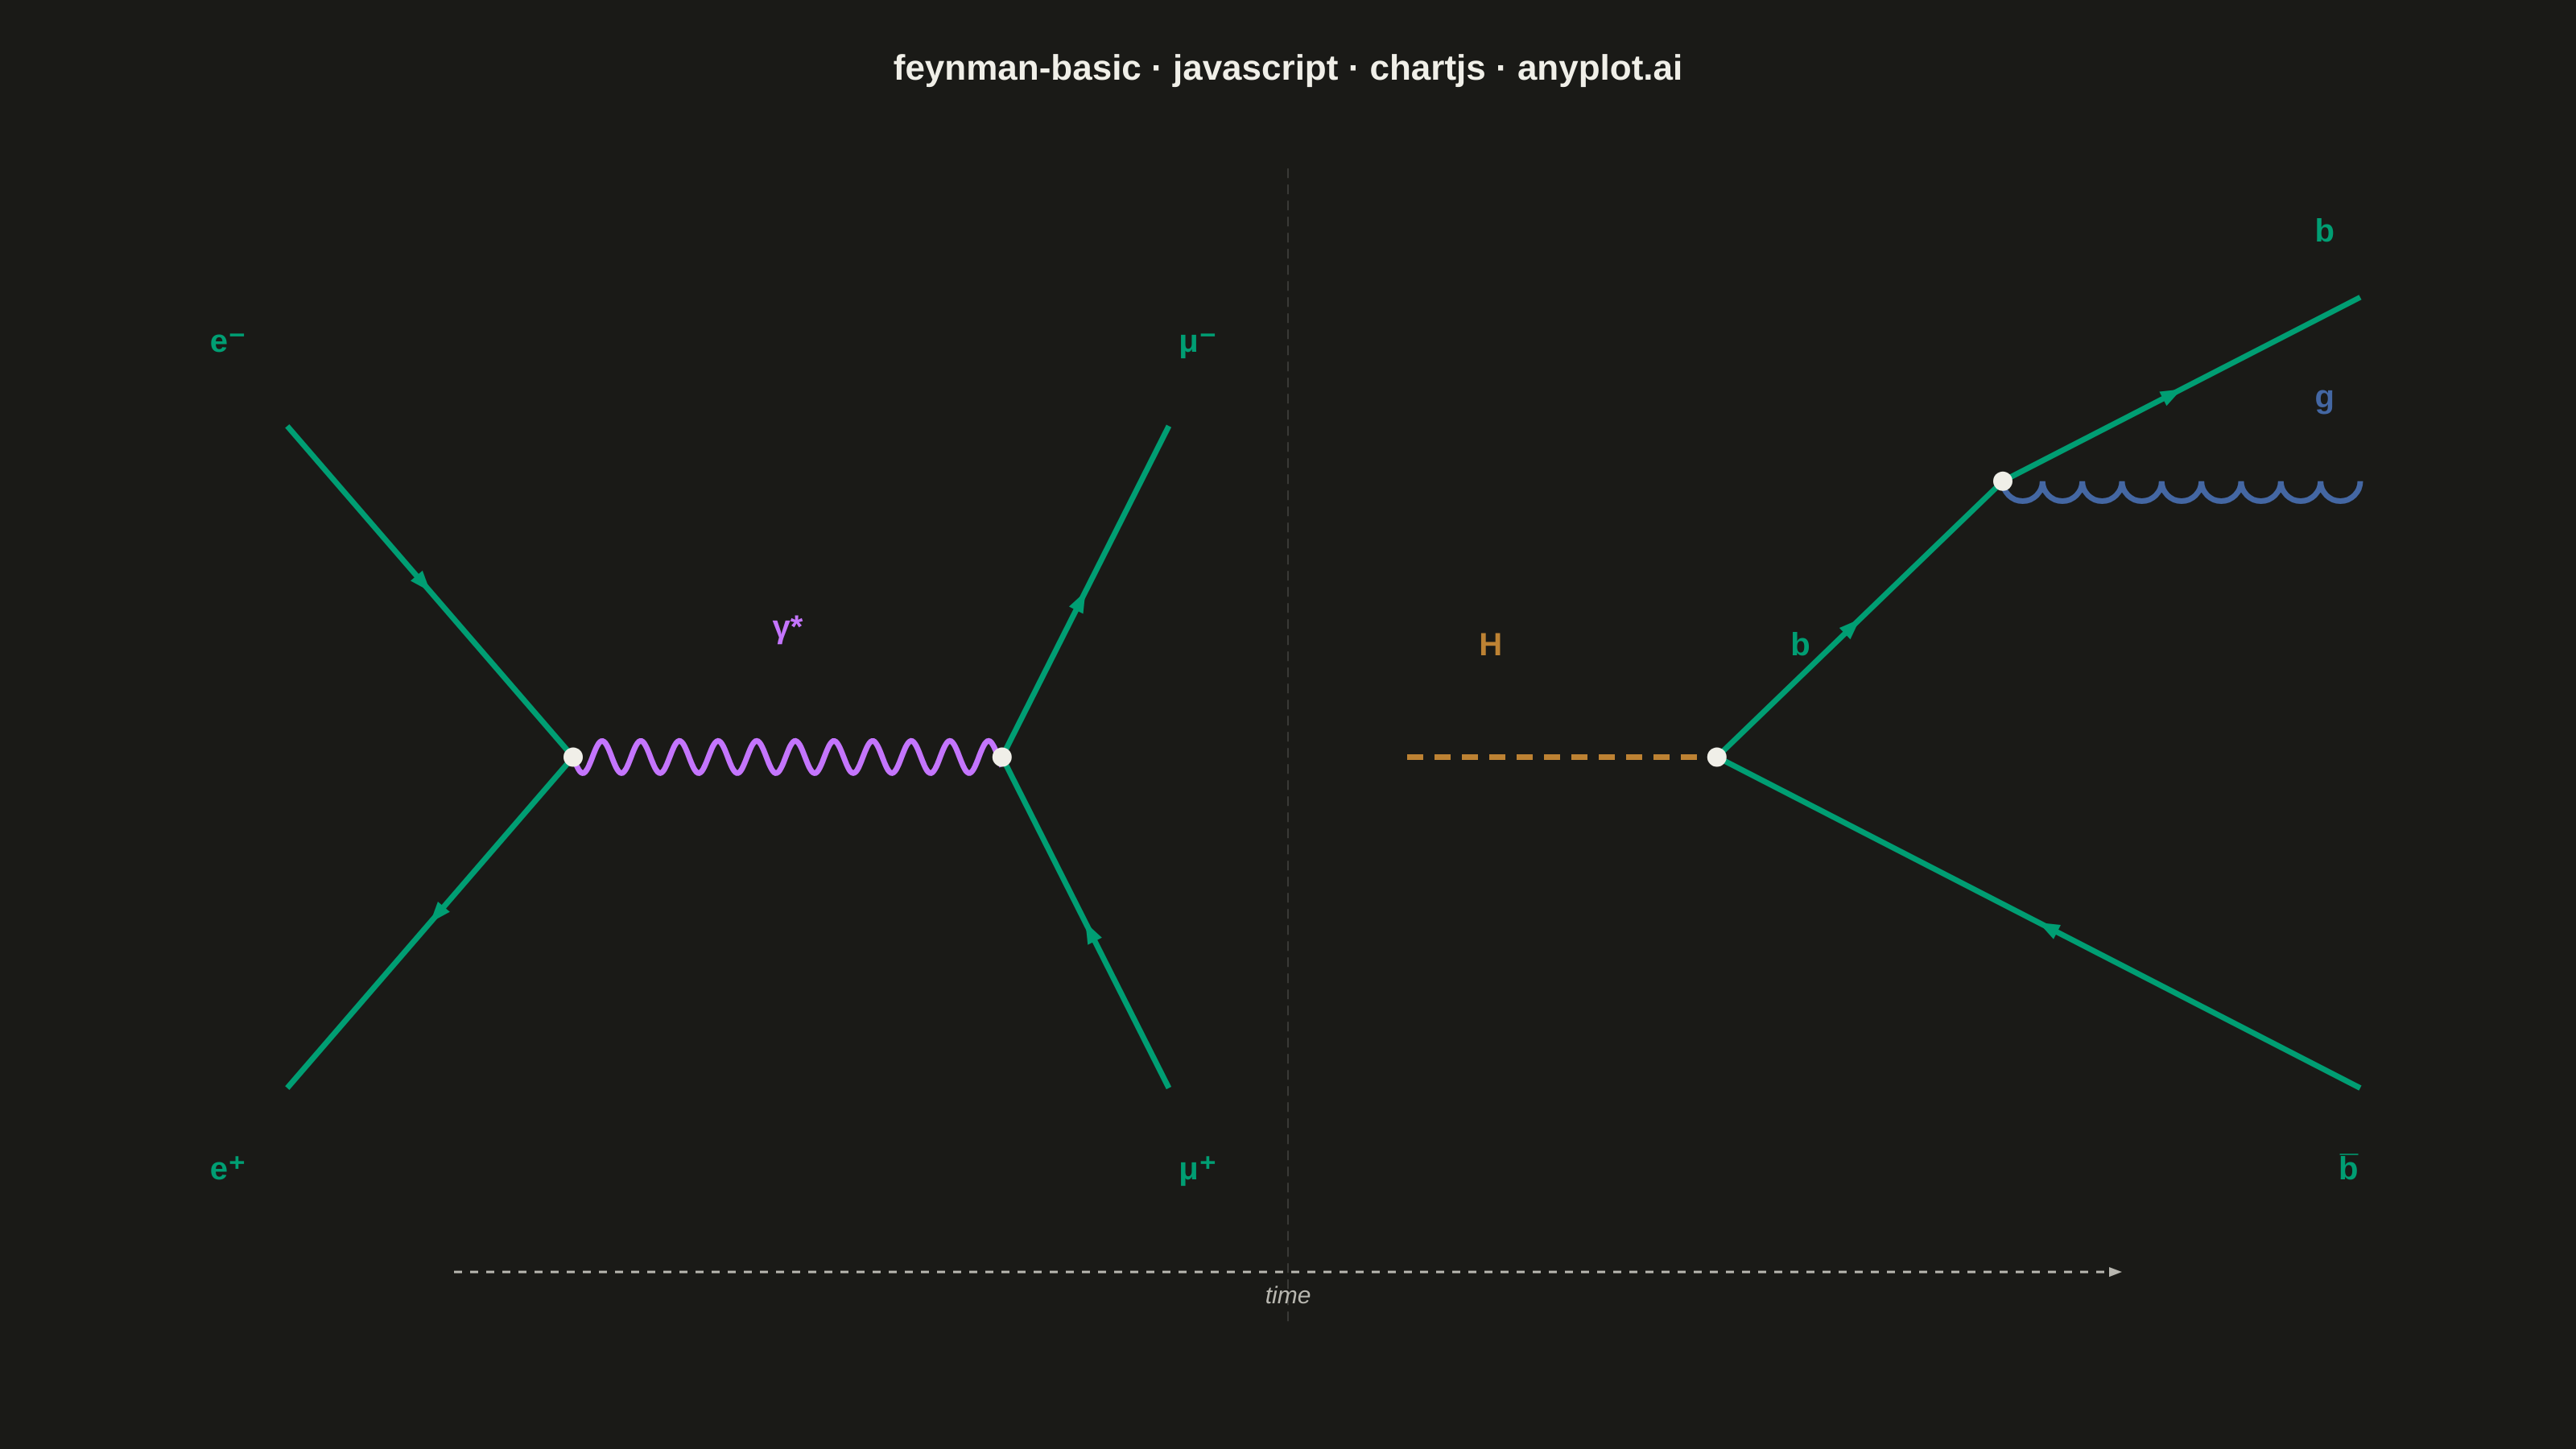
A Feynman diagram visualizes interactions between subatomic particles in quantum field theory. Different line styles represent different particle types: straight lines for fermions (electrons, quarks), wavy lines for photons, curly/looped lines for gluons, and dashed lines for scalar bosons (e.g., Higgs). Lines meet at vertices representing interaction points. Invented by Richard Feynman, these diagrams are both a computational tool and a cultural icon of modern physics.
// anyplot.ai
// feynman-basic: Feynman Diagram for Particle Interactions
// Library: chartjs 4.4.7 | JavaScript 22.22.3
// Quality: 88/100 | Created: 2026-06-03

const t = window.ANYPLOT_TOKENS;

// Imprint palette: fermion=green, photon=lavender, gluon=blue, scalar boson=ochre
const FERMION_COLOR = t.palette[0]; // #009E73
const PHOTON_COLOR  = t.palette[1]; // #C475FD
const GLUON_COLOR   = t.palette[2]; // #4467A3
const BOSON_COLOR   = t.palette[3]; // #BD8233

// Two processes showing all 4 Feynman particle line types:
// Left:  e⁺e⁻ → γ* → μ⁺μ⁻  (fermion solid+arrow, photon wavy)
// Right: H → b b̄ g           (scalar boson dashed, fermion, gluon curly)

const vertices = [
  { x: 2.0, y: 3.5 }, // V1: e+e- annihilation
  { x: 3.8, y: 3.5 }, // V2: γ* → μ+μ- pair creation
  { x: 6.8, y: 3.5 }, // V3: H → bb̄ decay
  { x: 8.0, y: 5.0 }, // V4: b → b + g gluon emission
];

const lines = [
  // (a) QED: e+e- → γ* → μ+μ-
  { from: [0.8, 5.3], to: [2.0, 3.5], type: "fermion", color: FERMION_COLOR, arrowDir: "forward",  label: "e⁻",   labelAt: [0.55, 5.75] },
  { from: [0.8, 1.7], to: [2.0, 3.5], type: "fermion", color: FERMION_COLOR, arrowDir: "backward", label: "e⁺",   labelAt: [0.55, 1.25] },
  { from: [2.0, 3.5], to: [3.8, 3.5], type: "photon",  color: PHOTON_COLOR,  arrowDir: "none",     label: "γ*",   labelAt: [2.9,  4.2]  },
  { from: [3.8, 3.5], to: [4.5, 5.3], type: "fermion", color: FERMION_COLOR, arrowDir: "forward",  label: "μ⁻", labelAt: [4.62, 5.75] },
  { from: [3.8, 3.5], to: [4.5, 1.7], type: "fermion", color: FERMION_COLOR, arrowDir: "backward", label: "μ⁺", labelAt: [4.62, 1.25] },
  // (b) QCD+Higgs: H → b b̄ g
  { from: [5.5, 3.5], to: [6.8, 3.5], type: "boson",   color: BOSON_COLOR,   arrowDir: "none",     label: "H",         labelAt: [5.85, 4.1]  },
  { from: [6.8, 3.5], to: [8.0, 5.0], type: "fermion", color: FERMION_COLOR, arrowDir: "forward",  label: "b",         labelAt: [7.15, 4.1]  },
  { from: [8.0, 5.0], to: [9.5, 6.0], type: "fermion", color: FERMION_COLOR, arrowDir: "forward",  label: "b",         labelAt: [9.35, 6.35] },
  { from: [8.0, 5.0], to: [9.5, 5.0], type: "gluon",   color: GLUON_COLOR,   arrowDir: "none",     label: "g",         labelAt: [9.35, 5.45] },
  { from: [6.8, 3.5], to: [9.5, 1.7], type: "fermion", color: FERMION_COLOR, arrowDir: "backward", label: "b̅",   labelAt: [9.45, 1.25] },
];

function toPx(chart, dx, dy) {
  return [chart.scales.x.getPixelForValue(dx), chart.scales.y.getPixelForValue(dy)];
}

function arrowHead(ctx, mx, my, ax, ay, bx, by, color, sz) {
  const angle = Math.atan2(by - ay, bx - ax);
  ctx.save();
  ctx.translate(mx, my);
  ctx.rotate(angle);
  ctx.beginPath();
  ctx.moveTo(0, 0);
  ctx.lineTo(-sz, -sz * 0.38);
  ctx.lineTo(-sz,  sz * 0.38);
  ctx.closePath();
  ctx.fillStyle = color;
  ctx.fill();
  ctx.restore();
}

function fermionLine(ctx, x1, y1, x2, y2, color, lw, arrowDir) {
  ctx.save();
  ctx.beginPath();
  ctx.moveTo(x1, y1);
  ctx.lineTo(x2, y2);
  ctx.strokeStyle = color;
  ctx.lineWidth = lw;
  ctx.setLineDash([]);
  ctx.stroke();
  const mx = (x1 + x2) / 2;
  const my = (y1 + y2) / 2;
  if (arrowDir === "forward")  arrowHead(ctx, mx, my, x1, y1, x2, y2, color, 13);
  if (arrowDir === "backward") arrowHead(ctx, mx, my, x2, y2, x1, y1, color, 13);
  ctx.restore();
}

function photonLine(ctx, x1, y1, x2, y2, color, lw) {
  const dx = x2 - x1, dy = y2 - y1;
  const length = Math.sqrt(dx * dx + dy * dy);
  const angle  = Math.atan2(dy, dx);
  const amp = 10, wl = 24;
  const steps = Math.ceil(length * 1.2);
  ctx.save();
  ctx.translate(x1, y1);
  ctx.rotate(angle);
  ctx.beginPath();
  ctx.moveTo(0, 0);
  for (let i = 1; i <= steps; i++) {
    const xp = (i / steps) * length;
    ctx.lineTo(xp, amp * Math.sin(2 * Math.PI * xp / wl));
  }
  ctx.strokeStyle = color;
  ctx.lineWidth = lw;
  ctx.setLineDash([]);
  ctx.stroke();
  ctx.restore();
}

// Gluon: curly/looped line — series of semicircular arcs below the line axis
function gluonLine(ctx, x1, y1, x2, y2, color, lw) {
  const dx = x2 - x1, dy = y2 - y1;
  const length = Math.sqrt(dx * dx + dy * dy);
  const angle = Math.atan2(dy, dx);
  const loopR = 11;
  const nLoops = Math.max(4, Math.round(length / (2.2 * loopR)));
  const step = length / nLoops;
  const r = step / 2;

  ctx.save();
  ctx.translate(x1, y1);
  ctx.rotate(angle);
  ctx.strokeStyle = color;
  ctx.lineWidth = lw;
  ctx.setLineDash([]);
  ctx.beginPath();
  for (let i = 0; i < nLoops; i++) {
    const cx = (i + 0.5) * step;
    // anticlockwise=true in canvas → loops droop below the line axis
    ctx.arc(cx, 0, r, Math.PI, 0, true);
  }
  ctx.stroke();
  ctx.restore();
}

// Scalar boson: dashed straight line
function bosonLine(ctx, x1, y1, x2, y2, color, lw) {
  ctx.save();
  ctx.beginPath();
  ctx.moveTo(x1, y1);
  ctx.lineTo(x2, y2);
  ctx.strokeStyle = color;
  ctx.lineWidth = lw;
  ctx.setLineDash([10, 7]);
  ctx.stroke();
  ctx.setLineDash([]);
  ctx.restore();
}

const feynmanPlugin = {
  id: "feynman",
  beforeDraw(chart) {
    const { ctx } = chart;
    ctx.fillStyle = t.pageBg;
    ctx.fillRect(0, 0, chart.width, chart.height);
  },
  afterDraw(chart) {
    const { ctx } = chart;
    ctx.save();

    const lw = 3.5;

    // Dashed divider between the two processes
    const [divX]        = toPx(chart, 5.0, 0);
    const [, divTop]    = toPx(chart, 0, 6.7);
    const [, divBottom] = toPx(chart, 0, 0.4);
    ctx.beginPath();
    ctx.moveTo(divX, divTop);
    ctx.lineTo(divX, divBottom);
    ctx.strokeStyle = t.grid;
    ctx.lineWidth = 1;
    ctx.setLineDash([6, 4]);
    ctx.stroke();
    ctx.setLineDash([]);

    // Draw propagators
    lines.forEach(line => {
      const [x1, y1] = toPx(chart, line.from[0], line.from[1]);
      const [x2, y2] = toPx(chart, line.to[0],   line.to[1]);
      if      (line.type === "fermion") fermionLine(ctx, x1, y1, x2, y2, line.color, lw, line.arrowDir);
      else if (line.type === "photon")  photonLine( ctx, x1, y1, x2, y2, line.color, lw);
      else if (line.type === "gluon")   gluonLine(  ctx, x1, y1, x2, y2, line.color, lw);
      else if (line.type === "boson")   bosonLine(  ctx, x1, y1, x2, y2, line.color, lw);
    });

    // Vertex dots
    vertices.forEach(v => {
      const [px, py] = toPx(chart, v.x, v.y);
      ctx.beginPath();
      ctx.arc(px, py, 6, 0, 2 * Math.PI);
      ctx.fillStyle = t.ink;
      ctx.fill();
    });

    // Particle labels
    ctx.font = "bold 20px 'Helvetica Neue', Helvetica, Arial, sans-serif";
    ctx.textAlign = "center";
    ctx.textBaseline = "middle";
    lines.forEach(line => {
      const [lx, ly] = toPx(chart, line.labelAt[0], line.labelAt[1]);
      ctx.fillStyle = line.color;
      ctx.fillText(line.label, lx, ly);
    });

    // Time direction indicator
    const [tx1, ty] = toPx(chart, 1.5, 0.7);
    const [tx2]     = toPx(chart, 8.5, 0.7);
    ctx.beginPath();
    ctx.moveTo(tx1, ty);
    ctx.lineTo(tx2 - 6, ty);
    ctx.strokeStyle = t.inkSoft;
    ctx.lineWidth = 1.5;
    ctx.setLineDash([5, 5]);
    ctx.stroke();
    ctx.setLineDash([]);
    arrowHead(ctx, tx2, ty, tx1, ty, tx2, ty, t.inkSoft, 8);
    ctx.font = "italic 15px 'Helvetica Neue', Helvetica, Arial, sans-serif";
    ctx.fillStyle = t.inkSoft;
    ctx.textAlign = "center";
    ctx.textBaseline = "top";
    ctx.fillText("time", (tx1 + tx2) / 2, ty + 8);

    ctx.restore();
  },
};

const canvas = document.createElement("canvas");
document.getElementById("container").appendChild(canvas);

new Chart(canvas, {
  type: "scatter",
  data: {
    datasets: [{
      data: [{ x: 0, y: 0 }, { x: 10, y: 7 }],
      pointRadius: 0,
      borderWidth: 0,
      backgroundColor: "transparent",
    }],
  },
  options: {
    responsive: true,
    maintainAspectRatio: false,
    animation: false,
    plugins: {
      title: {
        display: true,
        text: "feynman-basic · javascript · chartjs · anyplot.ai",
        color: t.ink,
        font: { size: 22, weight: "600" },
        padding: { top: 20, bottom: 14 },
      },
      legend: { display: false },
    },
    scales: {
      x: { min: 0, max: 10, display: false },
      y: { min: 0, max: 7,  display: false },
    },
    layout: {
      padding: { left: 60, right: 60, top: 10, bottom: 30 },
    },
  },
  plugins: [feynmanPlugin],
});
Runnable source as JSON, for any HTTP client: https://api.anyplot.ai/specs/feynman-basic/chartjs/code. Any spec id and library id listed in llms-full.txt fit the same URL shape; every URL below is complete and callable.
{
  "spec_id": "feynman-basic",
  "language": "javascript",
  "library": "chartjs",
  "page": "https://anyplot.ai/feynman-basic/javascript/chartjs",
  "hub": "https://anyplot.ai/feynman-basic",
  "code_json": "https://api.anyplot.ai/specs/feynman-basic/chartjs/code",
  "spec_json": "https://api.anyplot.ai/specs/feynman-basic",
  "render_light_png": "https://storage.googleapis.com/anyplot-images/plots/feynman-basic/javascript/chartjs/plot-light.png",
  "render_dark_png": "https://storage.googleapis.com/anyplot-images/plots/feynman-basic/javascript/chartjs/plot-dark.png",
  "interactive_light_html": "https://storage.googleapis.com/anyplot-images/plots/feynman-basic/javascript/chartjs/plot-light.html",
  "interactive_dark_html": "https://storage.googleapis.com/anyplot-images/plots/feynman-basic/javascript/chartjs/plot-dark.html",
  "quality_score": 88.0,
  "license": "MIT",
  "guide": "https://anyplot.ai/llms.txt"
}
Part of Feynman Diagram for Particle Interactions on anyplot.ai.