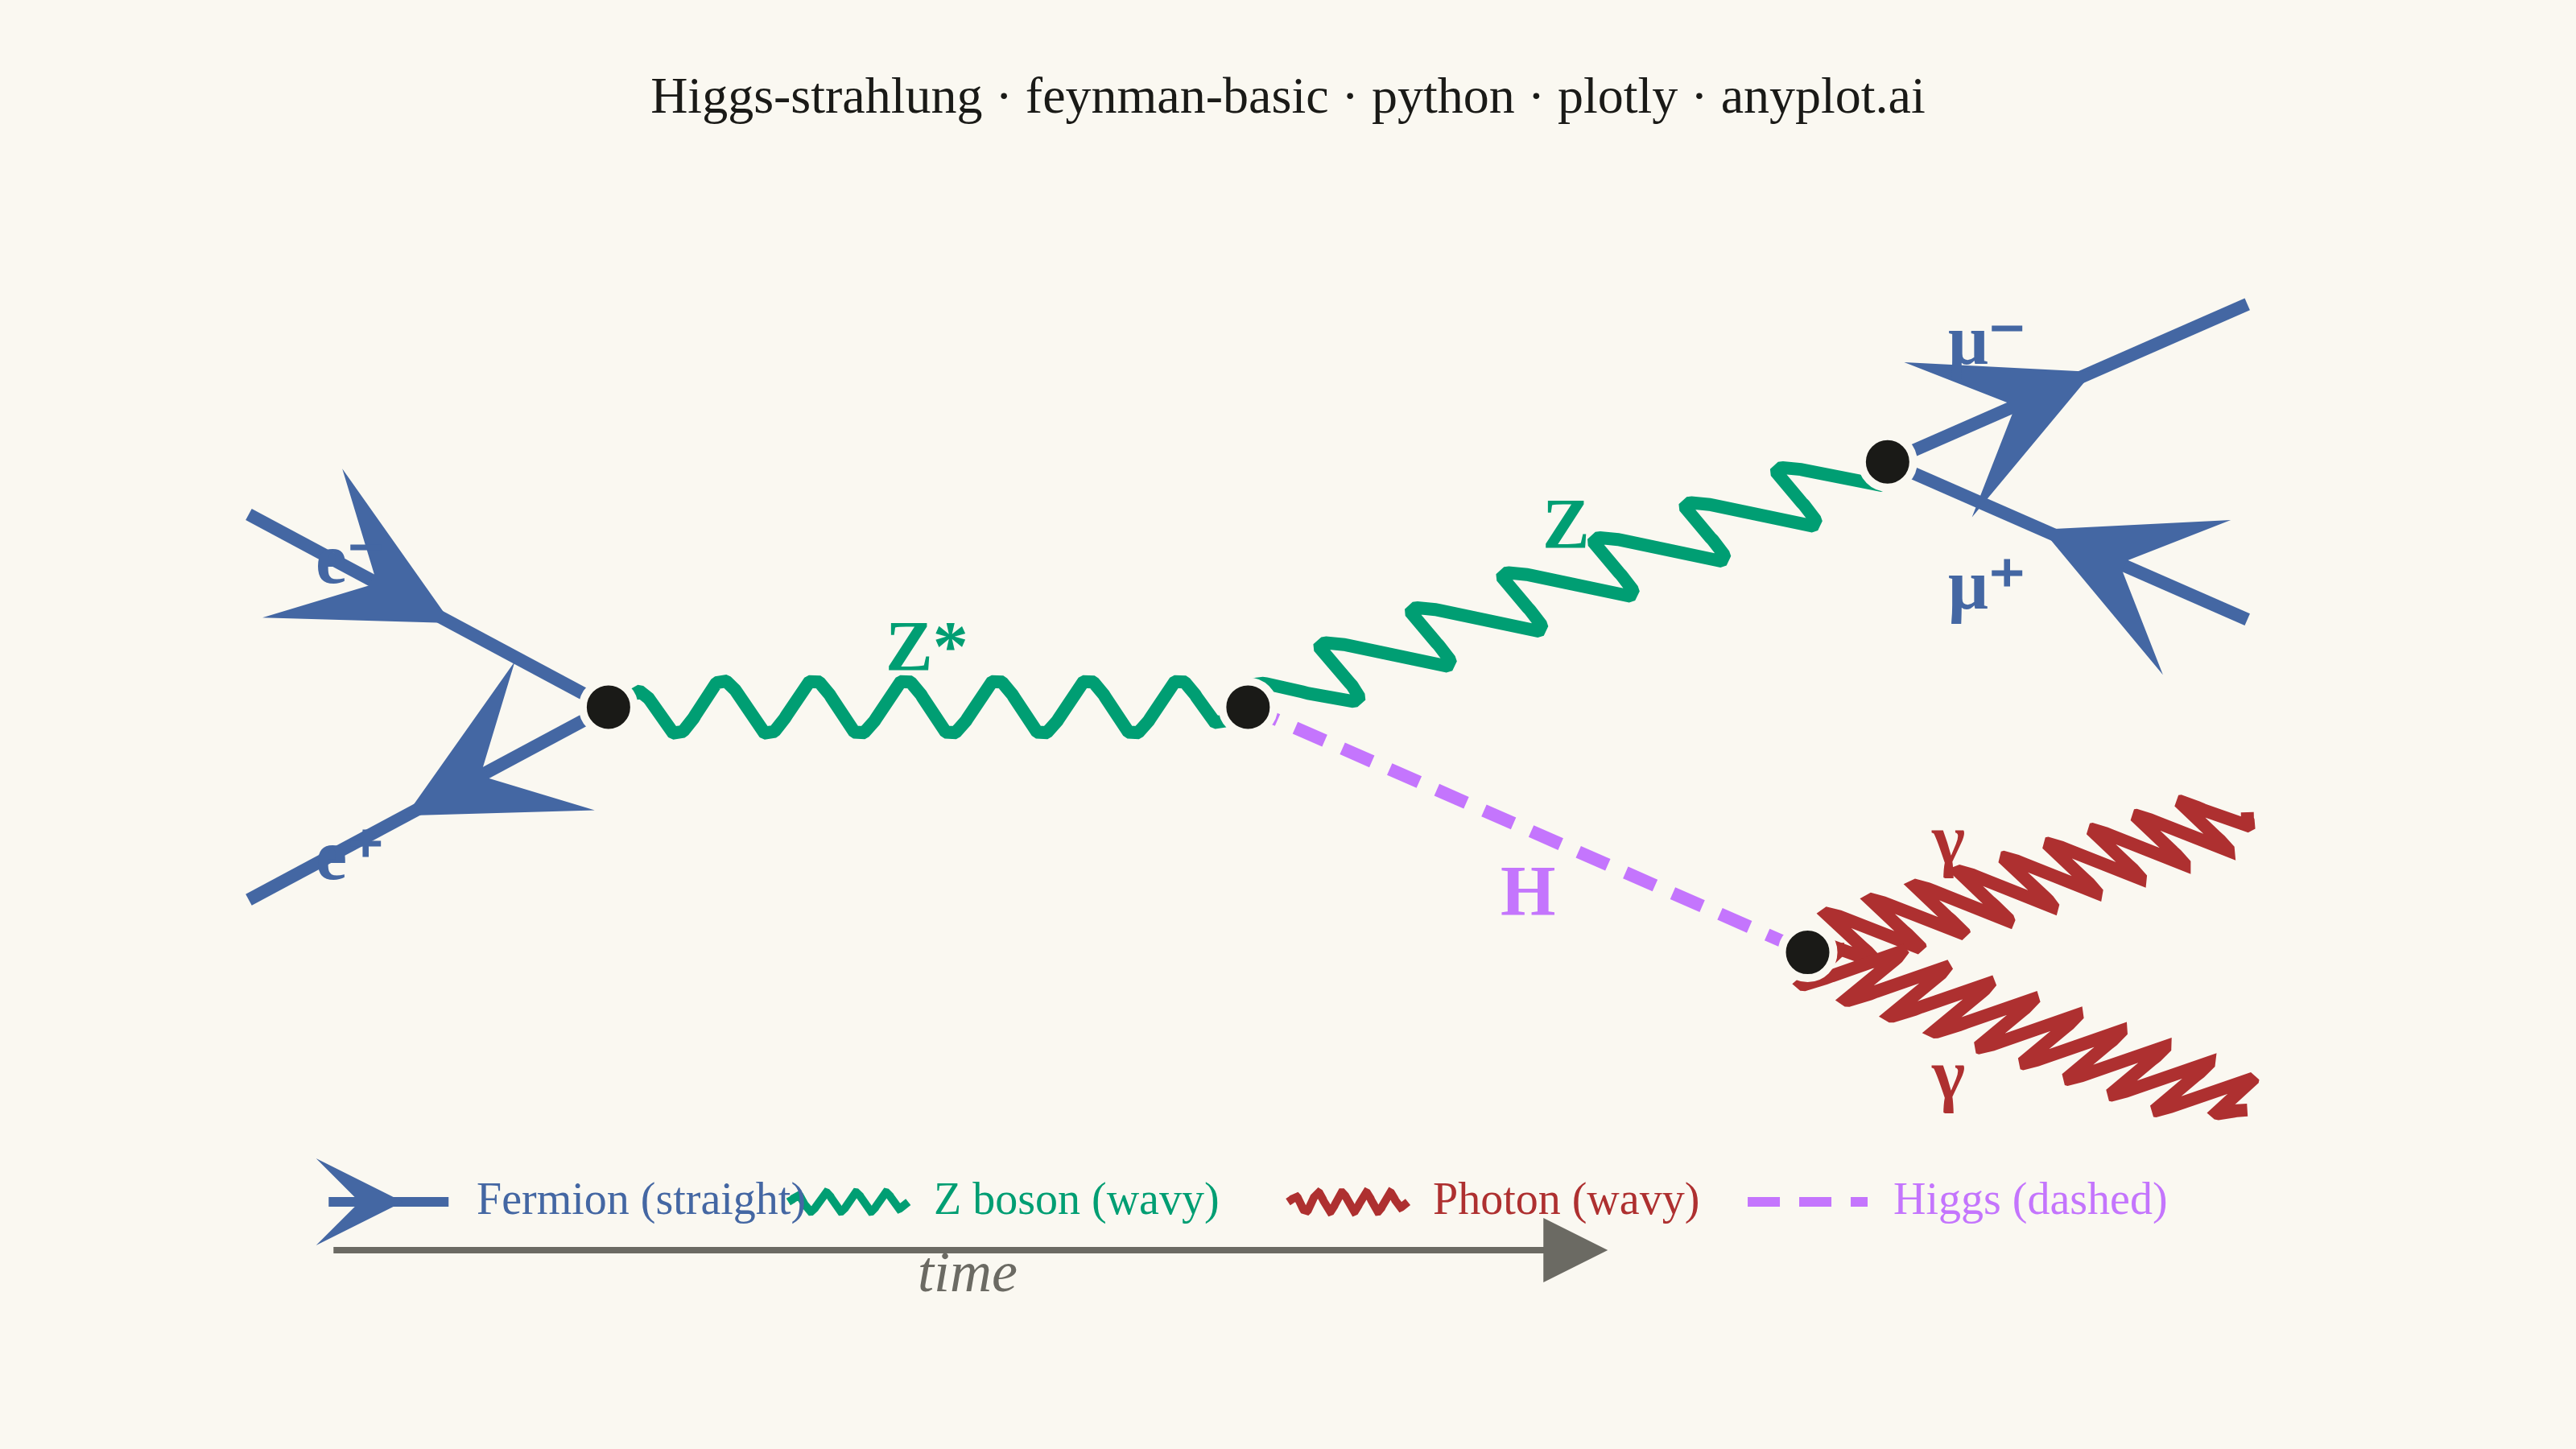
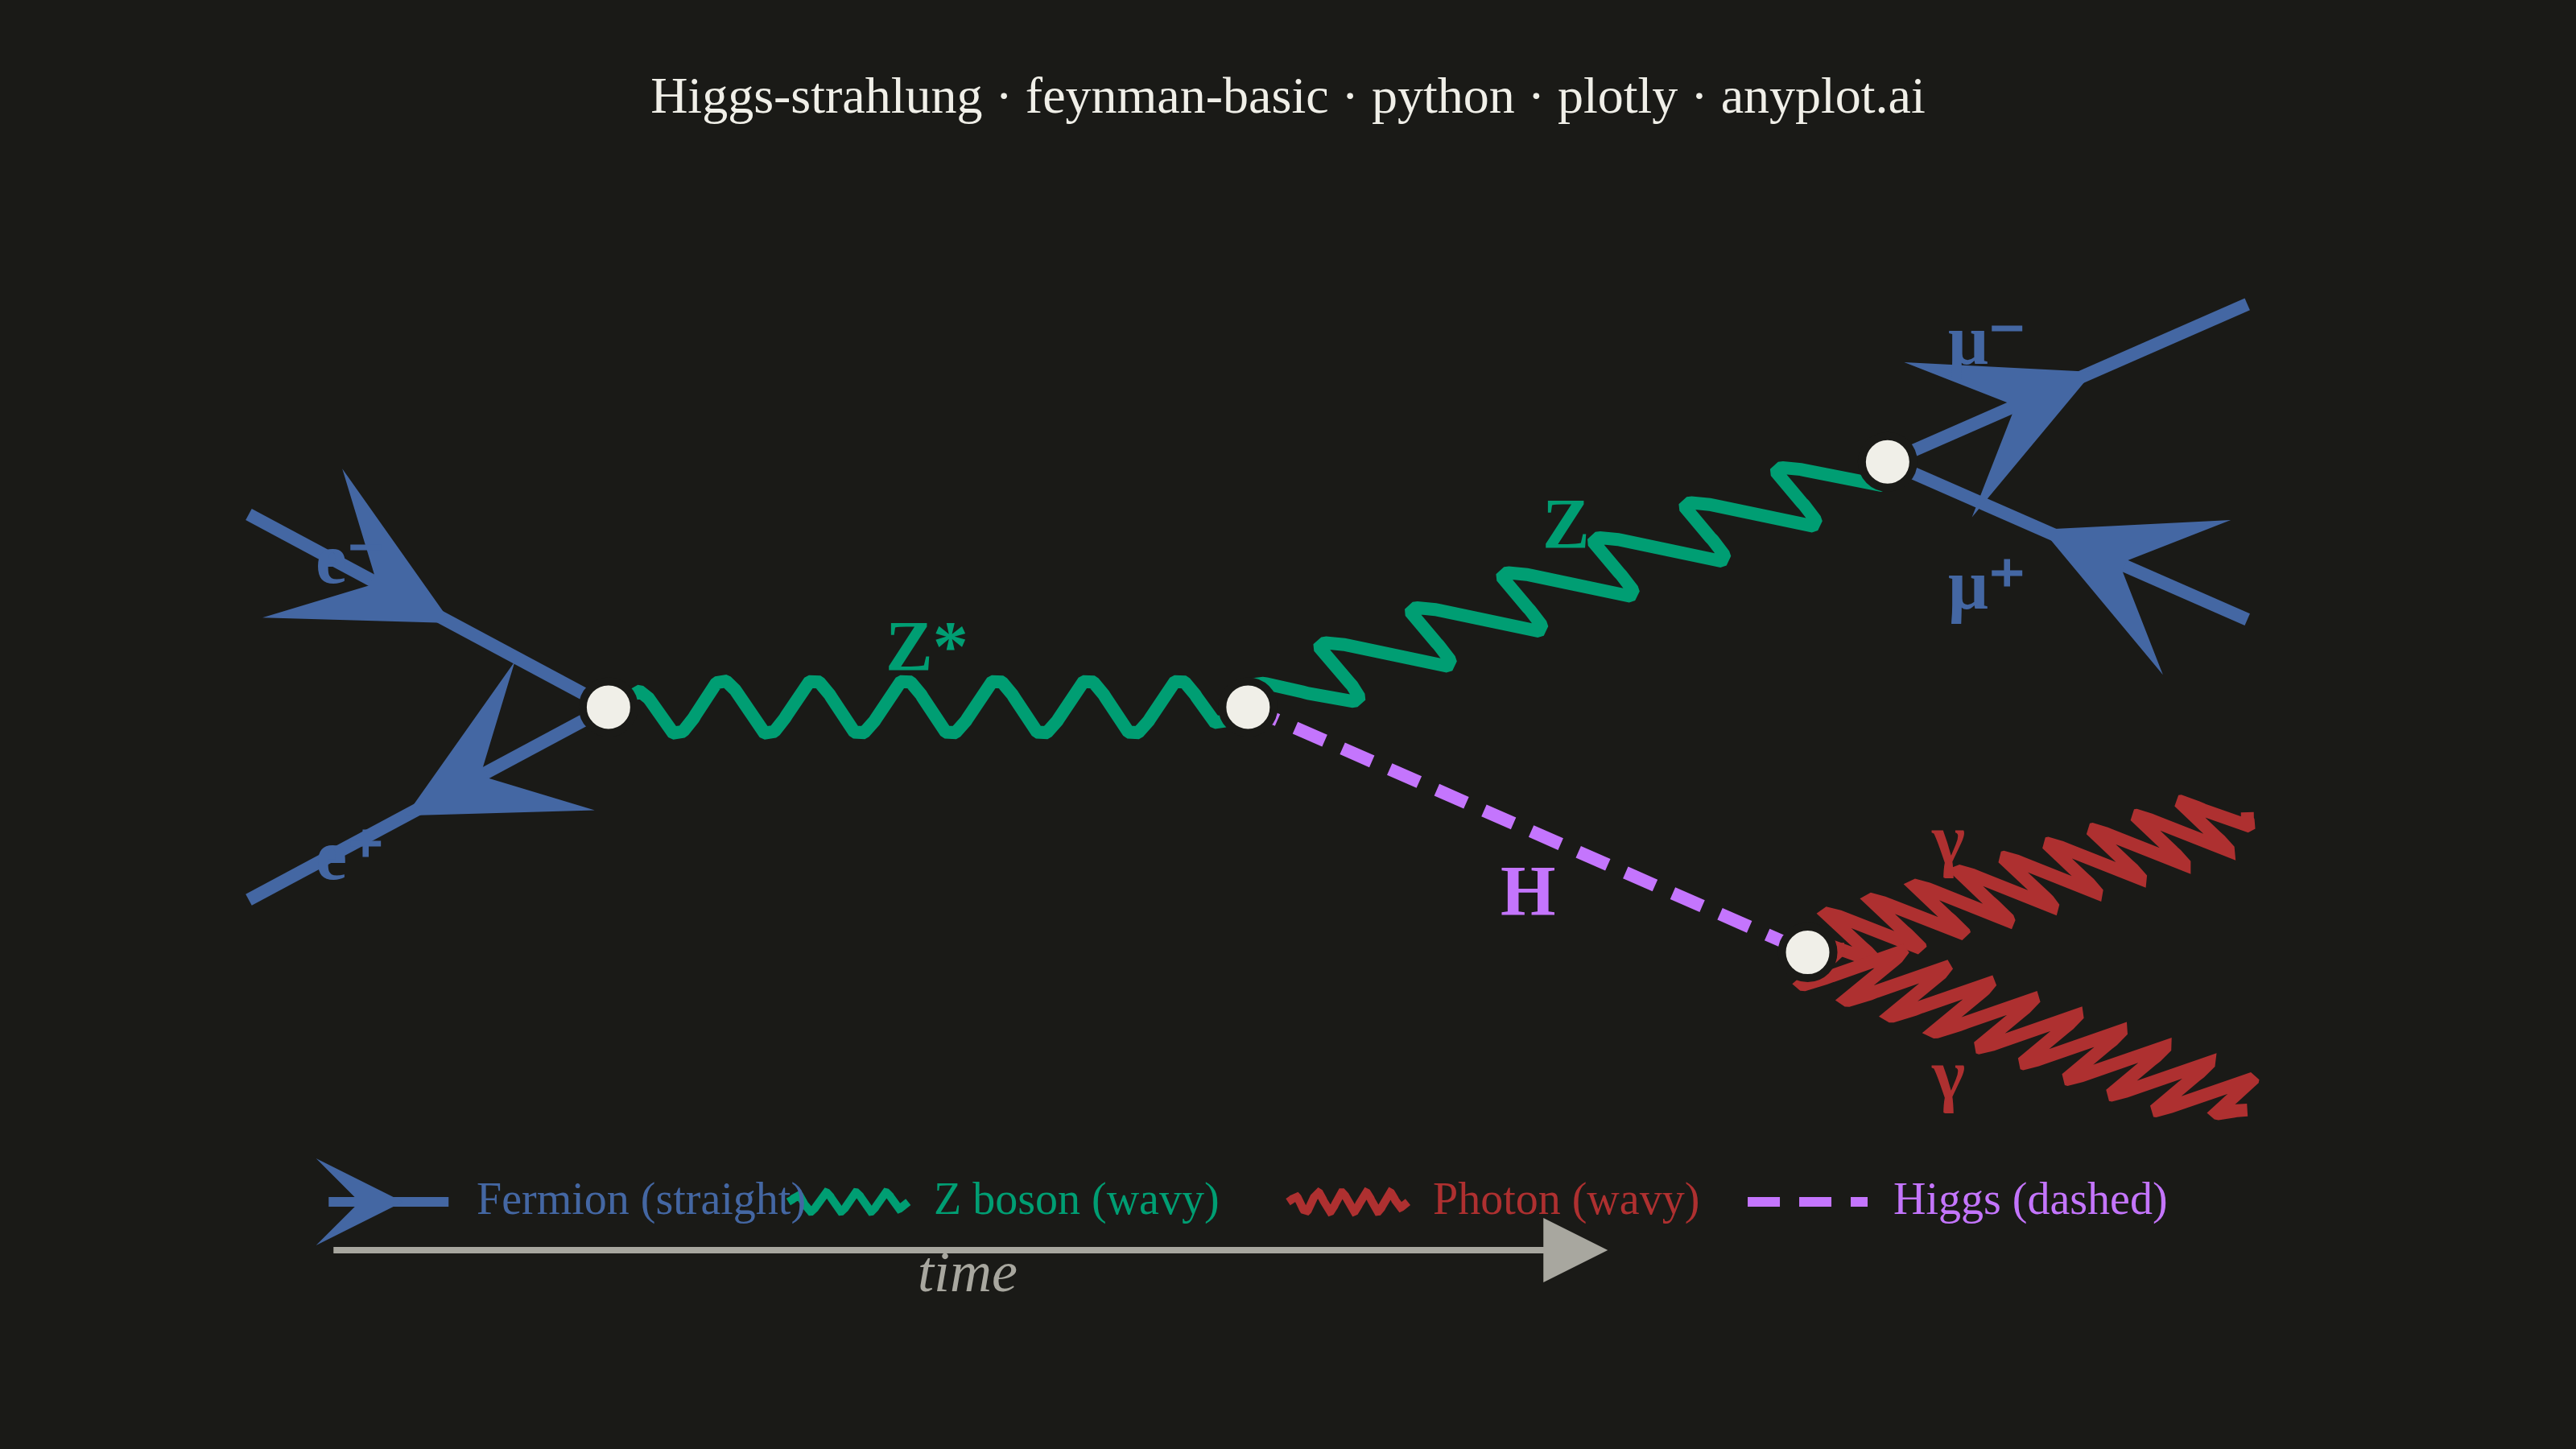
A Feynman diagram visualizes interactions between subatomic particles in quantum field theory. Different line styles represent different particle types: straight lines for fermions (electrons, quarks), wavy lines for photons, curly/looped lines for gluons, and dashed lines for scalar bosons (e.g., Higgs). Lines meet at vertices representing interaction points. Invented by Richard Feynman, these diagrams are both a computational tool and a cultural icon of modern physics.
""" anyplot.ai
feynman-basic: Feynman Diagram for Particle Interactions
Library: plotly 6.7.0 | Python 3.13.13
Quality: 89/100 | Updated: 2026-06-03
"""

import os

import numpy as np
import plotly.graph_objects as go


# Theme tokens
THEME = os.getenv("ANYPLOT_THEME", "light")
PAGE_BG = "#FAF8F1" if THEME == "light" else "#1A1A17"
ELEVATED_BG = "#FFFDF6" if THEME == "light" else "#242420"
INK = "#1A1A17" if THEME == "light" else "#F0EFE8"
INK_SOFT = "#4A4A44" if THEME == "light" else "#B8B7B0"
INK_MUTED = "#6B6A63" if THEME == "light" else "#A8A79F"

# Imprint palette — particle type colors
# Semantic exception: fermion lines use #4467A3 (Imprint blue) rather than #009E73.
# Blue = universally established color for electron/fermion lines in Feynman diagram
# tools (FeynCalc, JaxoDraw, TikZ-Feynman) — a recognized physics-domain convention
# analogous to financial red/green. Z boson (vector) takes #009E73 as second series.
COLORS = {
    "fermion": "#4467A3",  # Imprint blue — electrons / muons (physics convention)
    "vector": "#009E73",  # Imprint green — Z boson (vector, wavy)
    "photon": "#AE3030",  # Imprint matte red — photons (wavy)
    "boson": "#C475FD",  # Imprint lavender — Higgs scalar (dashed)
}
LINE_W = 4

# Data — Higgs-strahlung: e+e- → Z* → ZH → μ+μ- γγ (lepton collider)
# Showcases all 4 line types: fermion (straight + arrow), vector Z (wavy),
# photon (wavy), scalar H (dashed)
vertices = {
    "v1": (0.18, 0.50),  # e+e- annihilation → Z*
    "v2": (0.50, 0.50),  # Z* → ZH production
    "v3": (0.82, 0.78),  # Z → μ+μ- decay
    "v4": (0.78, 0.22),  # H → γγ decay
}

propagators = [
    {"from": (0.0, 0.72), "to": "v1", "type": "fermion", "label": "e⁻"},
    {"from": (0.0, 0.28), "to": "v1", "type": "fermion", "label": "e⁺", "anti": True},
    {"from": "v1", "to": "v2", "type": "vector", "label": "Z*"},
    {"from": "v2", "to": "v3", "type": "vector", "label": "Z"},
    {"from": "v2", "to": "v4", "type": "boson", "label": "H"},
    {"from": "v3", "to": (1.0, 0.96), "type": "fermion", "label": "μ⁻"},
    {"from": "v3", "to": (1.0, 0.60), "type": "fermion", "label": "μ⁺", "anti": True},
    {"from": "v4", "to": (1.0, 0.38), "type": "photon", "label": "γ"},
    {"from": "v4", "to": (1.0, 0.04), "type": "photon", "label": "γ"},
]

# Label offsets (dx, dy) from propagator midpoint
label_offsets = [
    (-0.04, 0.06),  # e⁻
    (-0.04, -0.06),  # e⁺
    (0.00, 0.07),  # Z*
    (0.00, 0.07),  # Z
    (0.00, -0.07),  # H
    (-0.04, 0.05),  # μ⁻
    (-0.04, -0.05),  # μ⁺
    (-0.04, 0.05),  # γ upper
    (-0.04, -0.05),  # γ lower
]

fig = go.Figure()

for i, prop in enumerate(propagators):
    p0 = vertices[prop["from"]] if isinstance(prop["from"], str) else prop["from"]
    p1 = vertices[prop["to"]] if isinstance(prop["to"], str) else prop["to"]
    color = COLORS[prop["type"]]
    dx, dy = p1[0] - p0[0], p1[1] - p0[1]
    length = np.sqrt(dx**2 + dy**2)
    ptype = prop["type"]

    if ptype == "fermion":
        fig.add_trace(
            go.Scatter(
                x=[p0[0], p1[0]],
                y=[p0[1], p1[1]],
                mode="lines",
                line={"color": color, "width": LINE_W},
                showlegend=False,
                hovertemplate=f"<b>{prop['label']}</b><extra></extra>",
            )
        )
        mx, my = (p0[0] + p1[0]) / 2, (p0[1] + p1[1]) / 2
        ndx, ndy = dx / length, dy / length
        if prop.get("anti"):
            ndx, ndy = -ndx, -ndy  # antiparticle: arrow reversed
        fig.add_annotation(
            x=mx + 0.018 * ndx,
            y=my + 0.018 * ndy,
            ax=mx - 0.05 * ndx,
            ay=my - 0.05 * ndy,
            xref="x",
            yref="y",
            axref="x",
            ayref="y",
            showarrow=True,
            arrowhead=3,
            arrowsize=2.5,
            arrowwidth=3.5,
            arrowcolor=color,
            text="",
        )

    elif ptype in ("photon", "vector"):
        t = np.linspace(0, 1, 400)
        perp_x, perp_y = -dy / length, dx / length
        amp = 0.030
        freq = 10 if ptype == "photon" else 7  # Z slightly fewer oscillations
        taper = np.minimum(t / 0.07, 1.0) * np.minimum((1 - t) / 0.07, 1.0)
        wave = amp * np.sin(2 * np.pi * freq * t) * taper
        fig.add_trace(
            go.Scatter(
                x=p0[0] + t * dx + wave * perp_x,
                y=p0[1] + t * dy + wave * perp_y,
                mode="lines",
                line={"color": color, "width": LINE_W},
                showlegend=False,
                hovertemplate=f"<b>{prop['label']}</b><extra></extra>",
            )
        )

    elif ptype == "boson":
        fig.add_trace(
            go.Scatter(
                x=[p0[0], p1[0]],
                y=[p0[1], p1[1]],
                mode="lines",
                line={"color": color, "width": LINE_W, "dash": "10px,6px"},
                showlegend=False,
                hovertemplate=f"<b>{prop['label']}</b><extra></extra>",
            )
        )

    # Particle label at propagator midpoint + offset
    lx = (p0[0] + p1[0]) / 2 + label_offsets[i][0]
    ly = (p0[1] + p1[1]) / 2 + label_offsets[i][1]
    fig.add_annotation(
        x=lx,
        y=ly,
        text=f"<b>{prop['label']}</b>",
        showarrow=False,
        font={"size": 22, "color": color, "family": "serif"},
        xanchor="center",
        yanchor="middle",
    )

# Vertex dots (theme-adaptive ink color)
for name, (vx, vy) in vertices.items():
    fig.add_trace(
        go.Scatter(
            x=[vx],
            y=[vy],
            mode="markers",
            marker={"size": 16, "color": INK, "line": {"width": 2.5, "color": PAGE_BG}},
            showlegend=False,
            hovertemplate=f"<b>Vertex {name}</b><br>Interaction point<extra></extra>",
        )
    )

# Legend — 4 particle types with miniature line samples, horizontal row at bottom
leg_items = [
    ("fermion", "Fermion (straight)"),
    ("vector", "Z boson (wavy)"),
    ("photon", "Photon (wavy)"),
    ("boson", "Higgs (dashed)"),
]
legend_ts = np.linspace(0, 1, 200)
legend_taper = np.minimum(legend_ts / 0.1, 1.0) * np.minimum((1 - legend_ts) / 0.1, 1.0)
lw_len = 0.060
x_starts = [0.04, 0.27, 0.52, 0.75]
y_leg = -0.065

for j, (ptype, desc) in enumerate(leg_items):
    lx = x_starts[j]
    ly = y_leg
    col = COLORS[ptype]

    if ptype == "fermion":
        fig.add_shape(type="line", x0=lx, y0=ly, x1=lx + lw_len, y1=ly, line={"color": col, "width": 3})
        fig.add_annotation(
            x=lx + lw_len * 0.62,
            y=ly,
            ax=lx + lw_len * 0.38,
            ay=ly,
            xref="x",
            yref="y",
            axref="x",
            ayref="y",
            showarrow=True,
            arrowhead=3,
            arrowsize=1.8,
            arrowwidth=2.5,
            arrowcolor=col,
            text="",
        )
    elif ptype == "boson":
        fig.add_shape(
            type="line", x0=lx, y0=ly, x1=lx + lw_len, y1=ly, line={"color": col, "width": 3, "dash": "10px,6px"}
        )
    else:
        freq_leg = 5 if ptype == "photon" else 4
        theta_s = 2 * np.pi * freq_leg * legend_ts
        px = lx + legend_ts * lw_len
        py = ly + 0.011 * np.sin(theta_s) * legend_taper
        fig.add_trace(
            go.Scatter(x=px, y=py, mode="lines", line={"color": col, "width": 2.5}, showlegend=False, hoverinfo="skip")
        )

    fig.add_annotation(
        x=lx + lw_len + 0.010,
        y=ly,
        text=desc,
        showarrow=False,
        font={"size": 14, "color": col},
        xanchor="left",
        yanchor="middle",
    )

# Time axis arrow (bottom of diagram)
fig.add_annotation(
    x=0.68,
    y=-0.12,
    ax=0.04,
    ay=-0.12,
    xref="x",
    yref="y",
    axref="x",
    ayref="y",
    showarrow=True,
    arrowhead=2,
    arrowsize=2,
    arrowwidth=2,
    arrowcolor=INK_MUTED,
    text="",
)
fig.add_annotation(
    x=0.36, y=-0.145, text="<i>time</i>", showarrow=False, font={"size": 18, "color": INK_MUTED}, xanchor="center"
)

# Title: 62 chars — under 67, default 16px applies, no scaling needed
title = "Higgs-strahlung · feynman-basic · python · plotly · anyplot.ai"

fig.update_layout(
    autosize=False,
    margin={"l": 40, "r": 40, "t": 70, "b": 40},
    paper_bgcolor=PAGE_BG,
    plot_bgcolor=PAGE_BG,
    font={"color": INK, "family": "serif"},
    title={"text": title, "font": {"size": 16, "family": "serif"}, "x": 0.5, "xanchor": "center"},
    xaxis={"visible": False, "range": [-0.06, 1.10], "fixedrange": True},
    yaxis={"visible": False, "range": [-0.20, 1.05], "fixedrange": True},
    showlegend=False,
)

# Save — canvas: 3200 × 1800 (landscape)
fig.write_image(f"plot-{THEME}.png", width=800, height=450, scale=4)
fig.write_html(f"plot-{THEME}.html", include_plotlyjs="cdn")
Runnable source as JSON, for any HTTP client: https://api.anyplot.ai/specs/feynman-basic/plotly/code. Any spec id and library id listed in llms-full.txt fit the same URL shape; every URL below is complete and callable.
{
  "spec_id": "feynman-basic",
  "language": "python",
  "library": "plotly",
  "page": "https://anyplot.ai/feynman-basic/python/plotly",
  "hub": "https://anyplot.ai/feynman-basic",
  "code_json": "https://api.anyplot.ai/specs/feynman-basic/plotly/code",
  "spec_json": "https://api.anyplot.ai/specs/feynman-basic",
  "render_light_png": "https://storage.googleapis.com/anyplot-images/plots/feynman-basic/python/plotly/plot-light.png",
  "render_dark_png": "https://storage.googleapis.com/anyplot-images/plots/feynman-basic/python/plotly/plot-dark.png",
  "interactive_light_html": "https://storage.googleapis.com/anyplot-images/plots/feynman-basic/python/plotly/plot-light.html",
  "interactive_dark_html": "https://storage.googleapis.com/anyplot-images/plots/feynman-basic/python/plotly/plot-dark.html",
  "quality_score": 89.0,
  "license": "MIT",
  "guide": "https://anyplot.ai/llms.txt"
}
Part of Feynman Diagram for Particle Interactions on anyplot.ai.