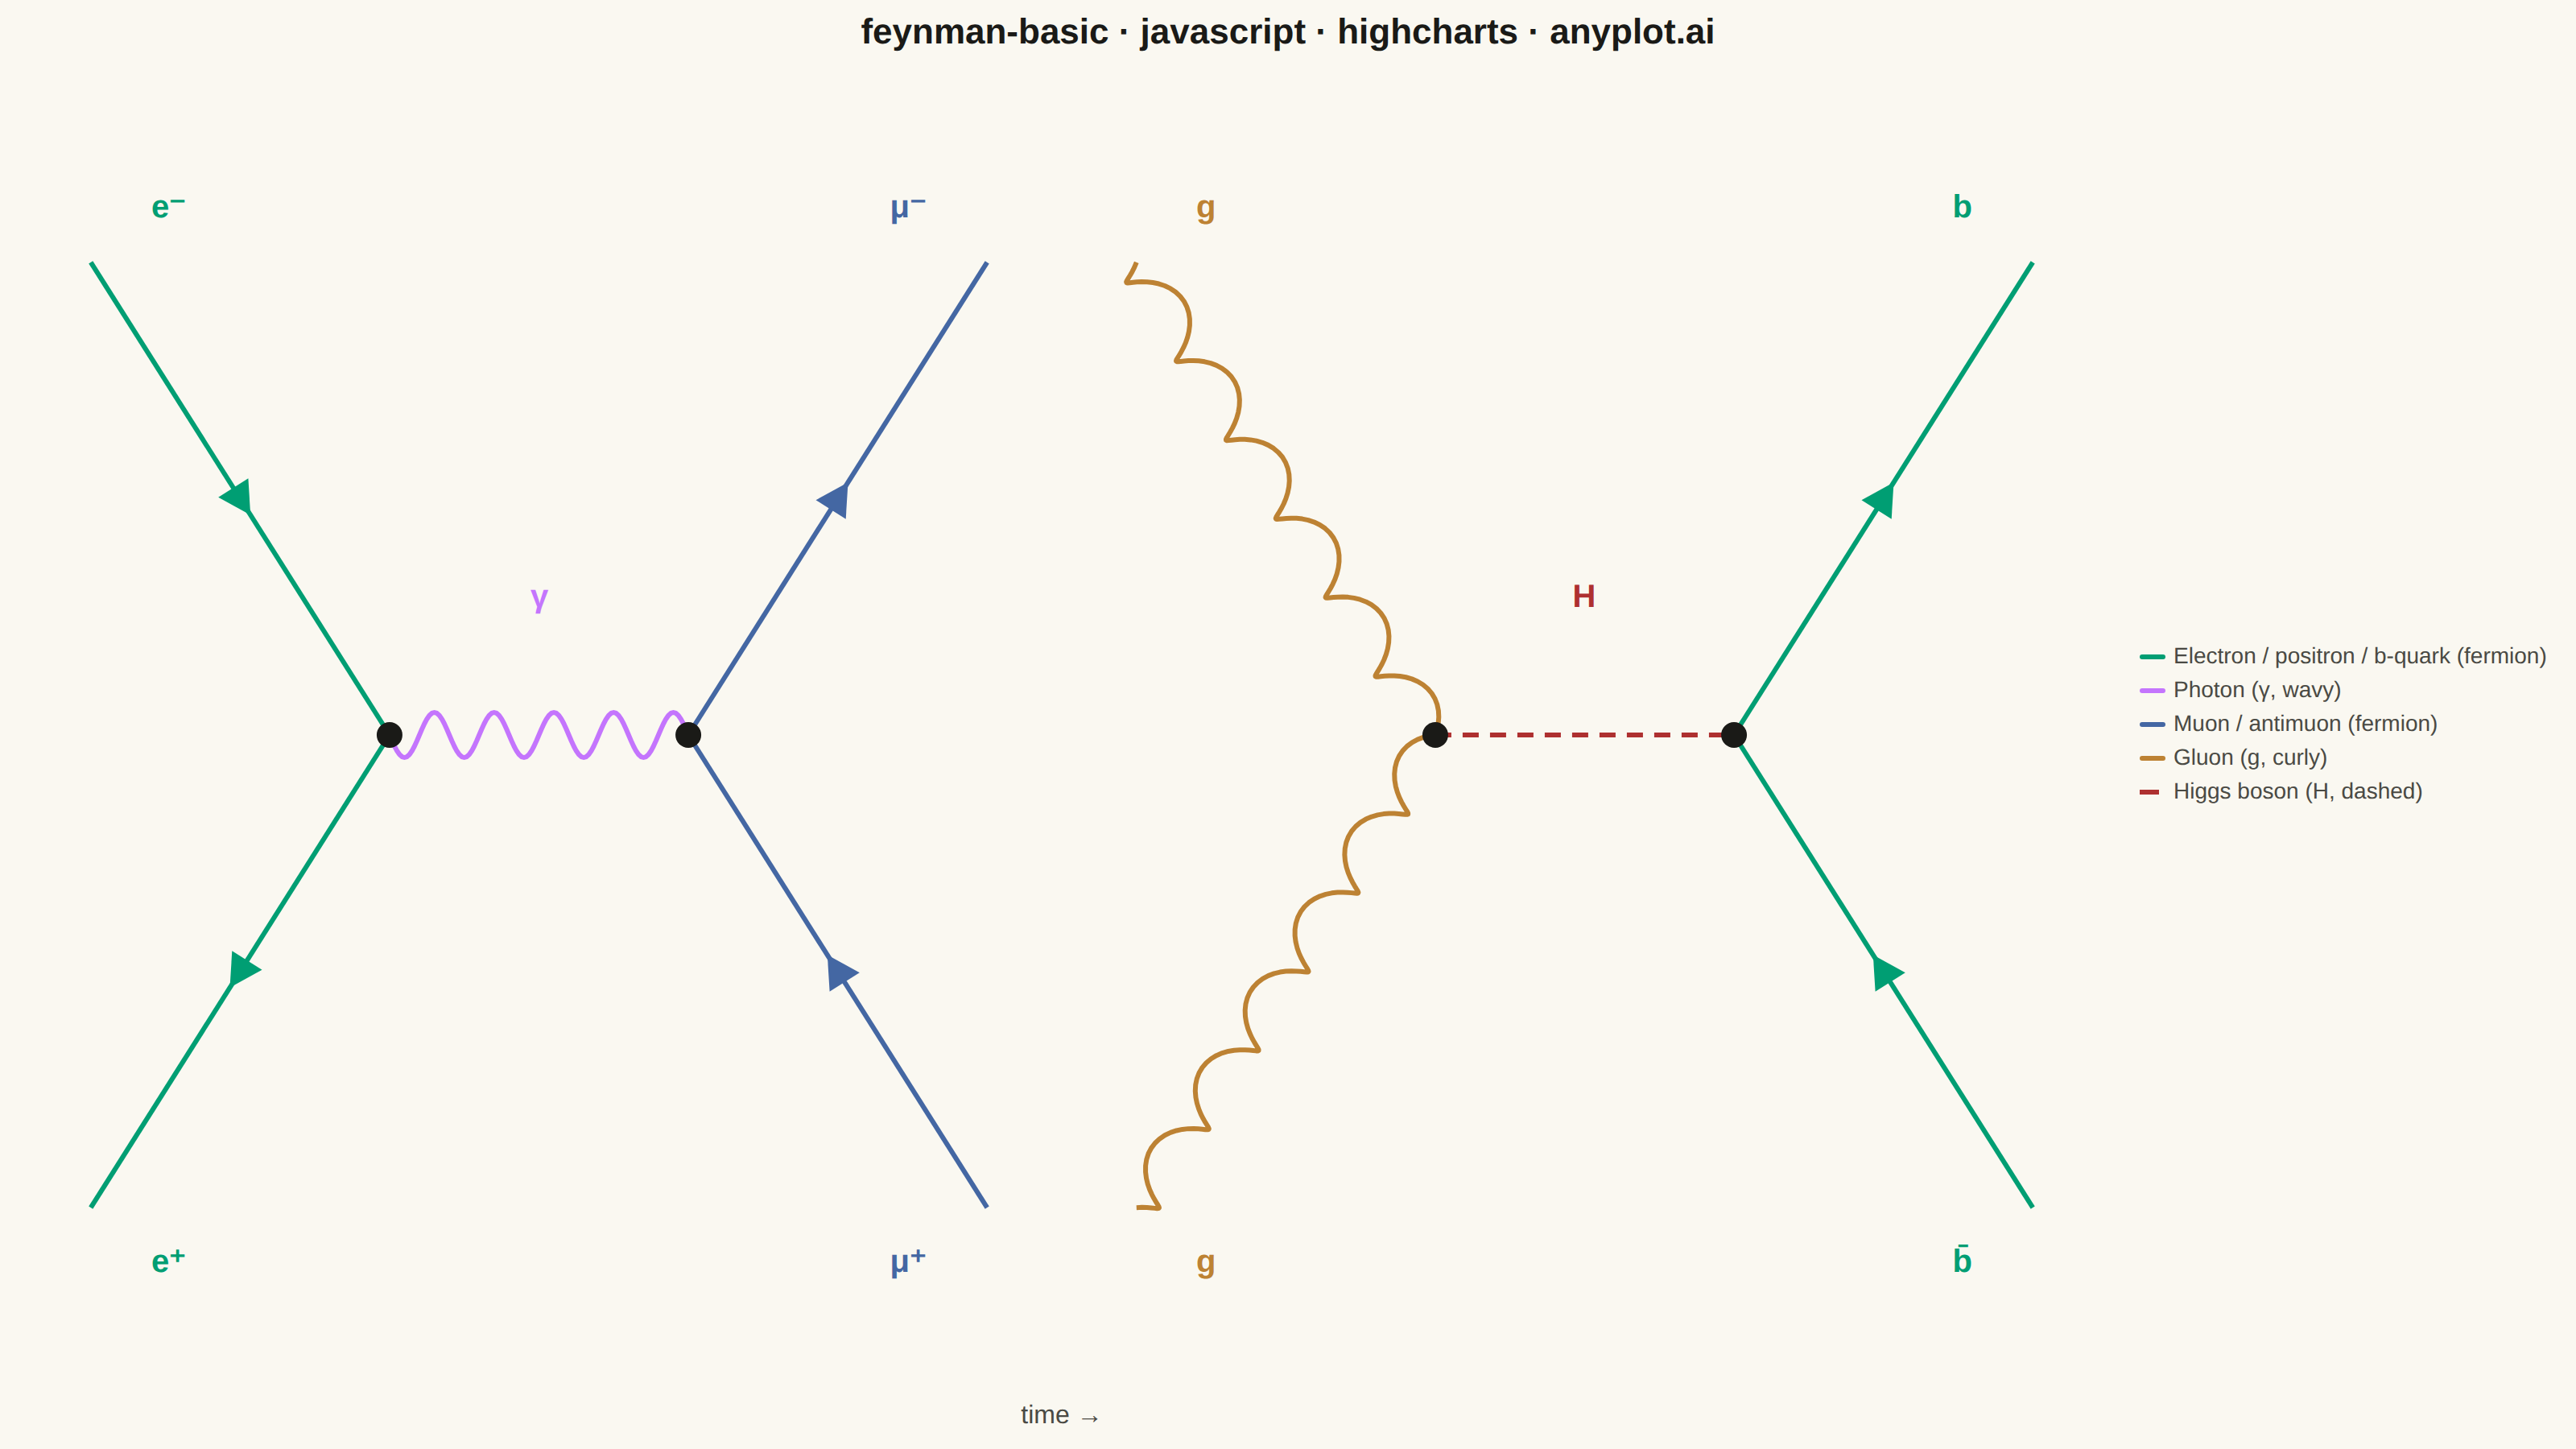
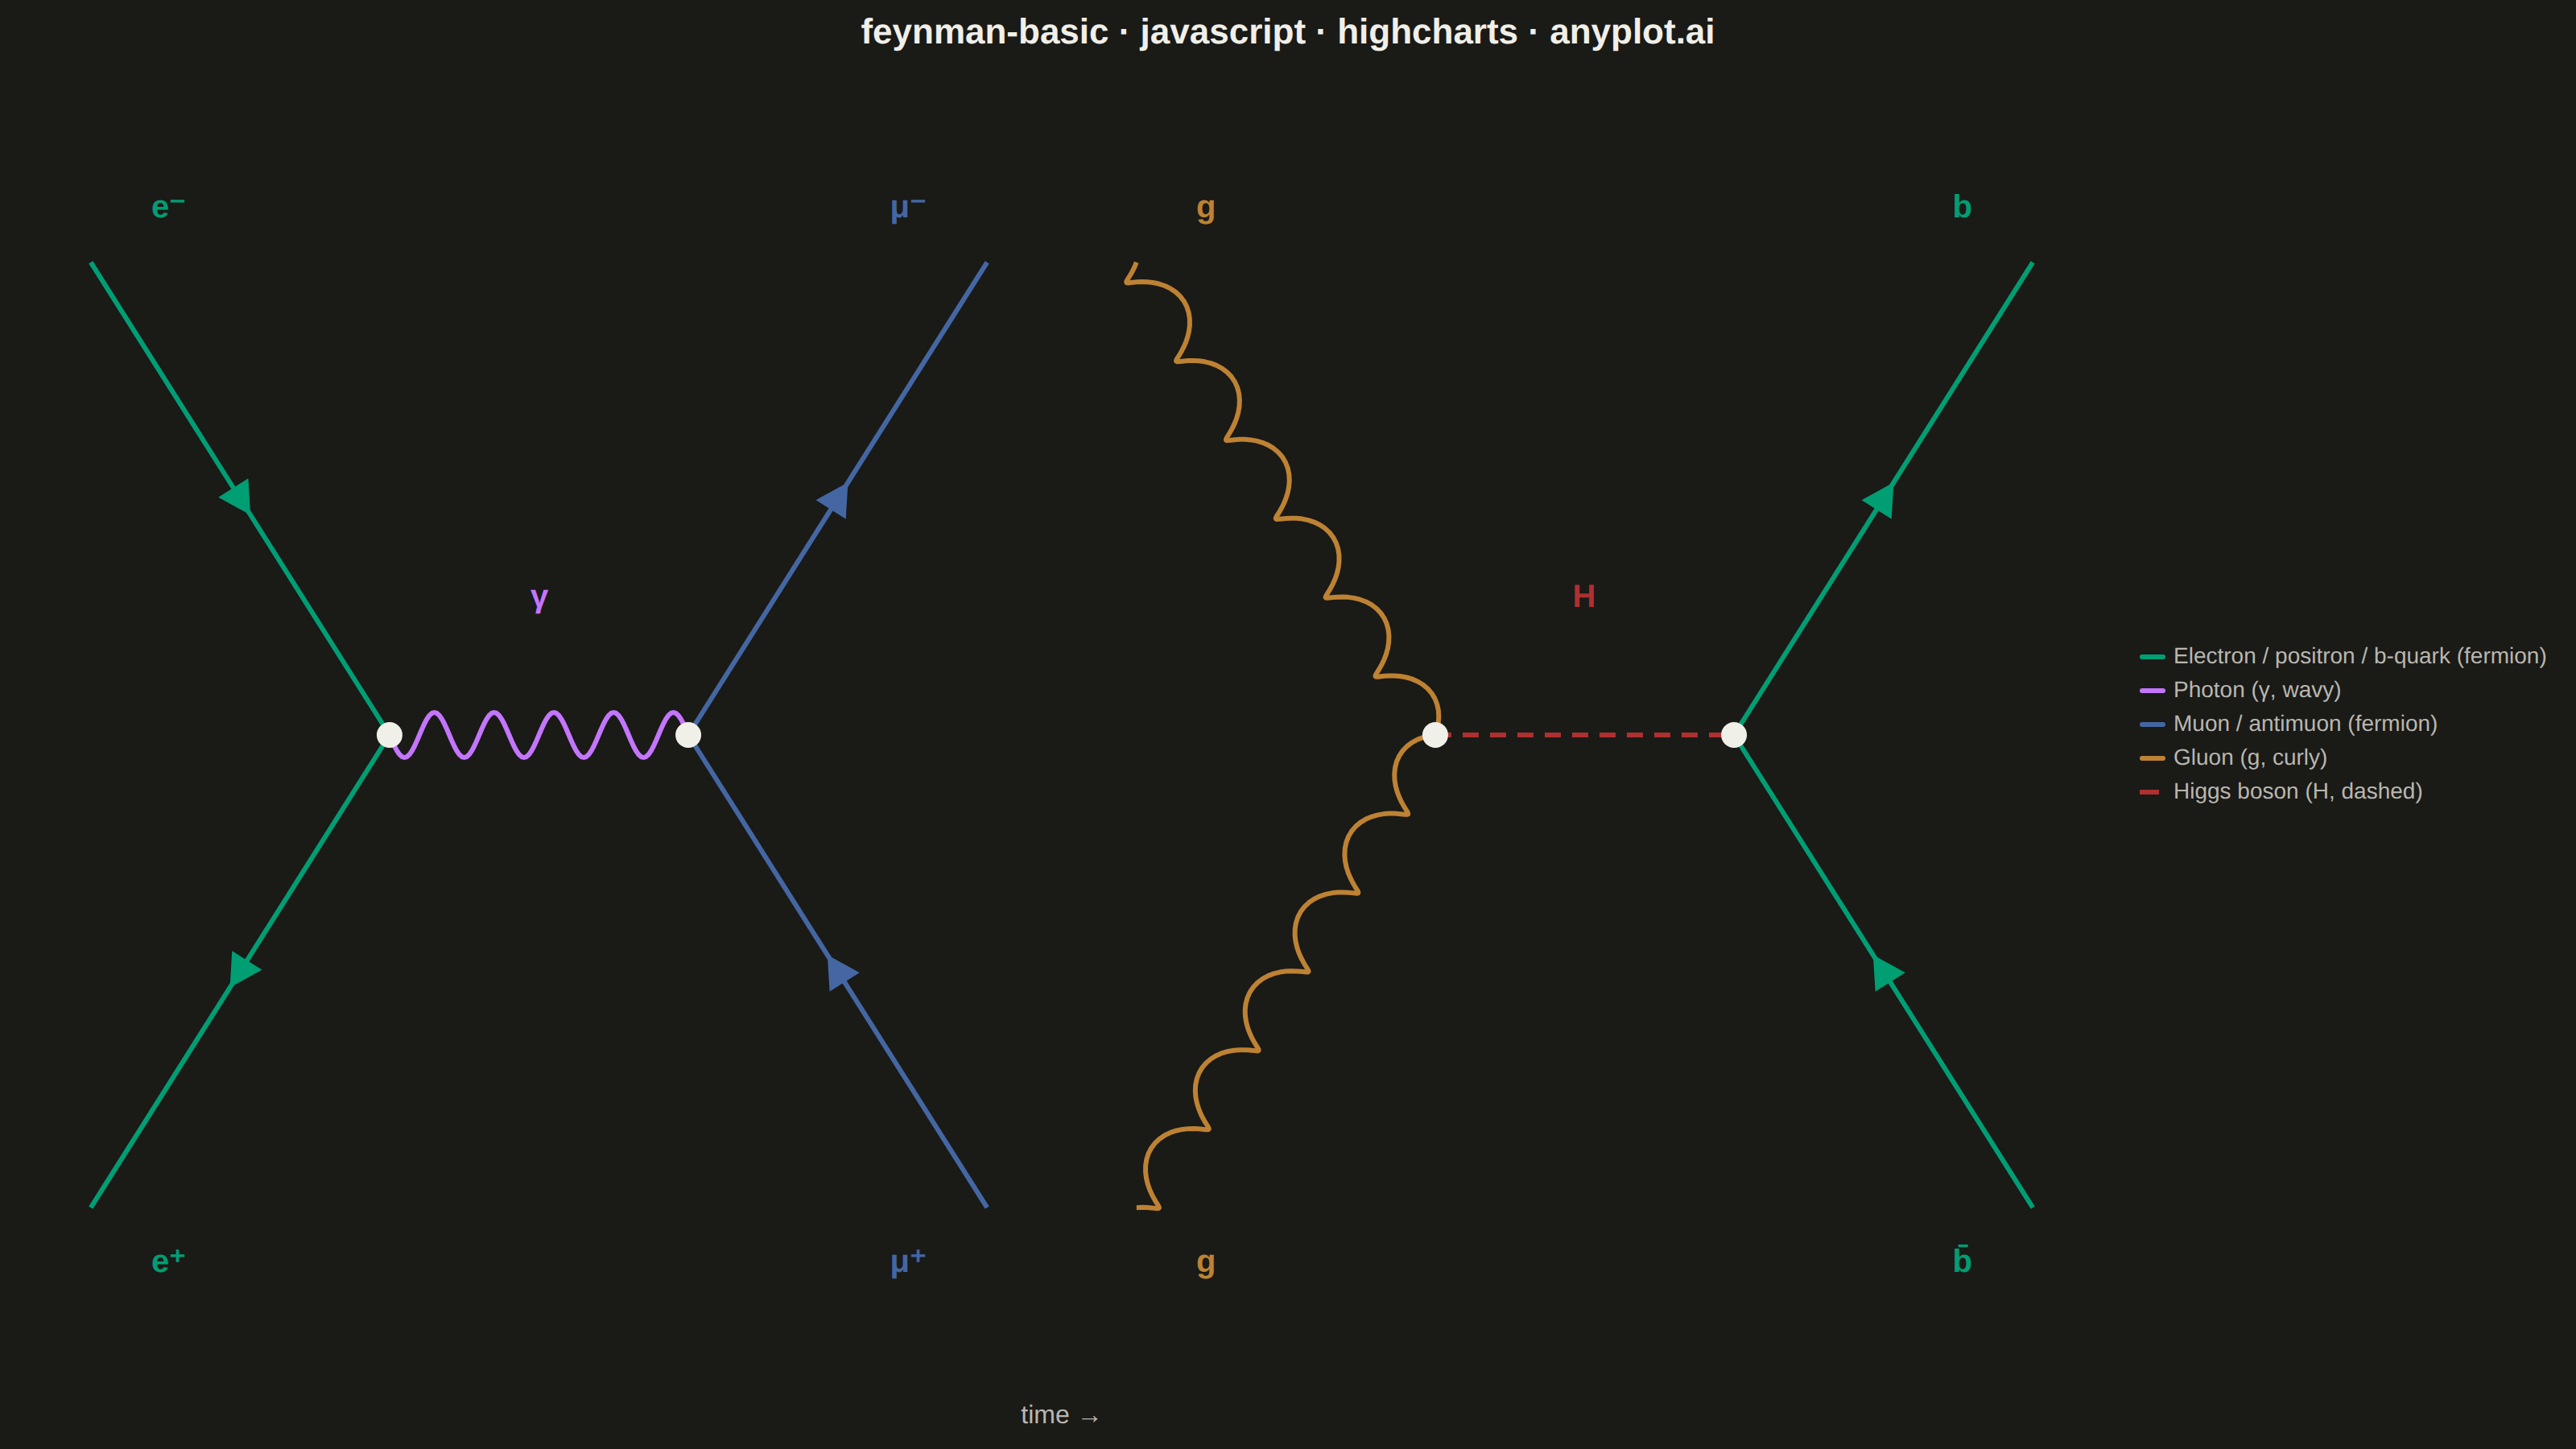
The same plot in 14 other libraries — JavaScript: Chart.js, D3.js, Apache ECharts, MUI X Charts; Python: Altair, Bokeh, lets-plot, Matplotlib, Plotly, plotnine, Pygal, Seaborn; R: ggplot2; Julia: Makie.jl. Compare all 15 side by side: Feynman Diagram for Particle Interactions in Python, R, Julia and JavaScript.
A Feynman diagram visualizes interactions between subatomic particles in quantum field theory. Different line styles represent different particle types: straight lines for fermions (electrons, quarks), wavy lines for photons, curly/looped lines for gluons, and dashed lines for scalar bosons (e.g., Higgs). Lines meet at vertices representing interaction points. Invented by Richard Feynman, these diagrams are both a computational tool and a cultural icon of modern physics.
// anyplot.ai
// feynman-basic: Feynman Diagram for Particle Interactions
// Library: highcharts 12.6.0 | JavaScript 22.23.2
// Quality: 92/100 | Created: 2026-08-20

const t = window.ANYPLOT_TOKENS;

// --- Data: e- + e+ -> gamma -> mu- + mu+ (QED annihilation / pair production) ---
// Vertices are interaction points; propagators connect them (or connect a
// vertex to an external incoming/outgoing leg). Coordinates are a plain
// data-space grid — time runs left to right, as is conventional.
const V1 = { x: 2, y: 0 };
const V2 = { x: 4, y: 0 };
const V3 = { x: 9, y: 0 };
const V4 = { x: 11, y: 0 };

const legs = [
  { from: { x: 0, y: 2.6 }, to: V1, style: "straight", color: t.palette[0],
    label: "e⁻", align: "left", labelPos: { x: 0.4, y: 2.85 }, arrow: "forward" },
  { from: { x: 0, y: -2.6 }, to: V1, style: "straight", color: t.palette[0],
    label: "e⁺", align: "left", labelPos: { x: 0.4, y: -2.95 }, arrow: "backward" },
  { from: V1, to: V2, style: "wavy", color: t.palette[1],
    label: "γ", align: "center", labelPos: { x: 3, y: 0.7 }, arrow: null },
  { from: V2, to: { x: 6, y: 2.6 }, style: "straight", color: t.palette[2],
    label: "μ⁻", align: "right", labelPos: { x: 5.6, y: 2.85 }, arrow: "forward" },
  { from: V2, to: { x: 6, y: -2.6 }, style: "straight", color: t.palette[2],
    label: "μ⁺", align: "right", labelPos: { x: 5.6, y: -2.95 }, arrow: "backward" },
  // --- Second vertex pair: gg -> H -> b b̄ (gluon fusion / Higgs decay) -------
  { from: { x: 7, y: 2.6 }, to: V3, style: "curly", color: t.palette[3],
    label: "g", align: "left", labelPos: { x: 7.4, y: 2.85 }, arrow: null },
  { from: { x: 7, y: -2.6 }, to: V3, style: "curly", color: t.palette[3],
    label: "g", align: "left", labelPos: { x: 7.4, y: -2.95 }, arrow: null },
  { from: V3, to: V4, style: "dashed", color: t.palette[4],
    label: "H", align: "center", labelPos: { x: 10, y: 0.7 }, arrow: null },
  { from: V4, to: { x: 13, y: 2.6 }, style: "straight", color: t.palette[0],
    label: "b", align: "right", labelPos: { x: 12.6, y: 2.85 }, arrow: "forward" },
  { from: V4, to: { x: 13, y: -2.6 }, style: "straight", color: t.palette[0],
    label: "b̄", align: "right", labelPos: { x: 12.6, y: -2.95 }, arrow: "backward" },
];

// --- Helpers -----------------------------------------------------------------

function toPx(chart, point) {
  return {
    x: chart.xAxis[0].toPixels(point.x, false),
    y: chart.yAxis[0].toPixels(point.y, false),
  };
}

function straightPath(p1, p2) {
  return ["M", p1.x, p1.y, "L", p2.x, p2.y];
}

function wavyPath(p1, p2, amplitude, wavelengths) {
  const dx = p2.x - p1.x;
  const dy = p2.y - p1.y;
  const len = Math.sqrt(dx * dx + dy * dy);
  const ux = dx / len;
  const uy = dy / len;
  const nx = -uy;
  const ny = ux;
  const steps = 120;
  const path = ["M", p1.x, p1.y];
  for (let i = 1; i <= steps; i++) {
    const s = i / steps;
    const offset = amplitude * Math.sin(2 * Math.PI * wavelengths * s);
    path.push("L", p1.x + ux * len * s + nx * offset, p1.y + uy * len * s + ny * offset);
  }
  return path;
}

function curlyPath(p1, p2, amplitude, loops) {
  const dx = p2.x - p1.x;
  const dy = p2.y - p1.y;
  const len = Math.sqrt(dx * dx + dy * dy);
  const ux = dx / len;
  const uy = dy / len;
  const nx = -uy;
  const ny = ux;
  const steps = 160;
  const path = ["M", p1.x, p1.y];
  for (let i = 1; i <= steps; i++) {
    const s = i / steps;
    const along = len * s - amplitude * 0.6 * (1 - Math.cos(2 * Math.PI * loops * s));
    const normal = amplitude * Math.sin(2 * Math.PI * loops * s);
    path.push("L", p1.x + ux * along + nx * normal, p1.y + uy * along + ny * normal);
  }
  return path;
}

// Arrowhead centred on (cx, cy), pointing along `angle` (radians).
function arrowPath(cx, cy, angle, size) {
  const half = size * 0.55;
  const tipX = cx + size * 0.6 * Math.cos(angle);
  const tipY = cy + size * 0.6 * Math.sin(angle);
  const baseX = cx - size * 0.4 * Math.cos(angle);
  const baseY = cy - size * 0.4 * Math.sin(angle);
  const perp = angle + Math.PI / 2;
  const leftX = baseX + half * Math.cos(perp);
  const leftY = baseY + half * Math.sin(perp);
  const rightX = baseX - half * Math.cos(perp);
  const rightY = baseY - half * Math.sin(perp);
  return ["M", tipX, tipY, "L", leftX, leftY, "L", rightX, rightY, "Z"];
}

function drawDiagram(chart) {
  const renderer = chart.renderer;
  const group = renderer.g("feynman-diagram").add();

  legs.forEach((leg) => {
    const p1 = toPx(chart, leg.from);
    const p2 = toPx(chart, leg.to);

    let path;
    if (leg.style === "wavy") path = wavyPath(p1, p2, 14, 5);
    else if (leg.style === "curly") path = curlyPath(p1, p2, 12, 6);
    else path = straightPath(p1, p2);

    const attrs = { stroke: leg.color, "stroke-width": 3, fill: "none", "stroke-linejoin": "round" };
    if (leg.style === "dashed") attrs["stroke-dasharray"] = "10,7";
    renderer.path(path).attr(attrs).add(group);

    if (leg.arrow) {
      const mid = { x: (p1.x + p2.x) / 2, y: (p1.y + p2.y) / 2 };
      let angle = Math.atan2(p2.y - p1.y, p2.x - p1.x);
      if (leg.arrow === "backward") angle += Math.PI;
      renderer.path(arrowPath(mid.x, mid.y, angle, 20))
        .attr({ fill: leg.color, stroke: "none" })
        .add(group);
    }

    const labelPx = toPx(chart, leg.labelPos);
    renderer.text(leg.label, labelPx.x, labelPx.y)
      .attr({ align: leg.align })
      .css({ color: leg.color, fontSize: "20px", fontWeight: "600" })
      .add(group);
  });

  [V1, V2, V3, V4].forEach((vertex) => {
    const p = toPx(chart, vertex);
    renderer.circle(p.x, p.y, 8).attr({ fill: t.ink, stroke: "none" }).add(group);
  });
}

// --- Chart ---------------------------------------------------------------
// Axes are used purely as the data-to-pixel coordinate system (hidden line,
// ticks, gridlines) — the diagram itself is drawn with the SVG renderer in
// the `load` event so lines/arrows can follow arbitrary particle-line
// geometry (straight with arrowheads, sine-wave photon) that no built-in
// series type expresses.
Highcharts.chart("container", {
  chart: {
    type: "line",
    backgroundColor: "transparent",
    animation: false,
    style: { fontFamily: "inherit" },
    events: {
      load: function () {
        drawDiagram(this);
      },
    },
  },
  credits: { enabled: false },
  colors: t.palette,
  title: {
    text: "feynman-basic · javascript · highcharts · anyplot.ai",
    style: { color: t.ink, fontSize: "22px", fontWeight: "600" },
  },
  xAxis: {
    min: -0.5,
    max: 13.5,
    startOnTick: false,
    endOnTick: false,
    lineWidth: 0,
    tickLength: 0,
    gridLineWidth: 0,
    labels: { enabled: false },
    title: { text: "time →", style: { color: t.inkSoft, fontSize: "16px" } },
  },
  yAxis: {
    min: -3.6,
    max: 3.6,
    startOnTick: false,
    endOnTick: false,
    lineWidth: 0,
    tickLength: 0,
    gridLineWidth: 0,
    labels: { enabled: false },
    title: { text: null },
  },
  legend: {
    align: "right",
    verticalAlign: "middle",
    layout: "vertical",
    itemStyle: { color: t.inkSoft, fontSize: "14px" },
    itemHoverStyle: { color: t.ink },
  },
  tooltip: { enabled: false },
  plotOptions: { series: { animation: false, enableMouseTracking: false, marker: { enabled: false } } },
  series: [
    { name: "Electron / positron / b-quark (fermion)", color: t.palette[0], lineWidth: 3, data: [], showInLegend: true },
    { name: "Photon (γ, wavy)", color: t.palette[1], lineWidth: 3, data: [], showInLegend: true },
    { name: "Muon / antimuon (fermion)", color: t.palette[2], lineWidth: 3, data: [], showInLegend: true },
    { name: "Gluon (g, curly)", color: t.palette[3], lineWidth: 3, data: [], showInLegend: true },
    { name: "Higgs boson (H, dashed)", color: t.palette[4], lineWidth: 3, dashStyle: "Dash", data: [], showInLegend: true },
  ],
});
Runnable source as JSON, for any HTTP client: https://api.anyplot.ai/specs/feynman-basic/highcharts/code. Any spec id and library id listed in llms-full.txt fit the same URL shape; every URL below is complete and callable.
{
  "spec_id": "feynman-basic",
  "language": "javascript",
  "library": "highcharts",
  "page": "https://anyplot.ai/feynman-basic/javascript/highcharts",
  "hub": "https://anyplot.ai/feynman-basic",
  "code_json": "https://api.anyplot.ai/specs/feynman-basic/highcharts/code",
  "spec_json": "https://api.anyplot.ai/specs/feynman-basic",
  "render_light_png": "https://storage.googleapis.com/anyplot-images/plots/feynman-basic/javascript/highcharts/plot-light.png",
  "render_dark_png": "https://storage.googleapis.com/anyplot-images/plots/feynman-basic/javascript/highcharts/plot-dark.png",
  "interactive_light_html": "https://storage.googleapis.com/anyplot-images/plots/feynman-basic/javascript/highcharts/plot-light.html",
  "interactive_dark_html": "https://storage.googleapis.com/anyplot-images/plots/feynman-basic/javascript/highcharts/plot-dark.html",
  "quality_score": 92.0,
  "license": "MIT",
  "guide": "https://anyplot.ai/llms.txt"
}
Part of Feynman Diagram for Particle Interactions on anyplot.ai.