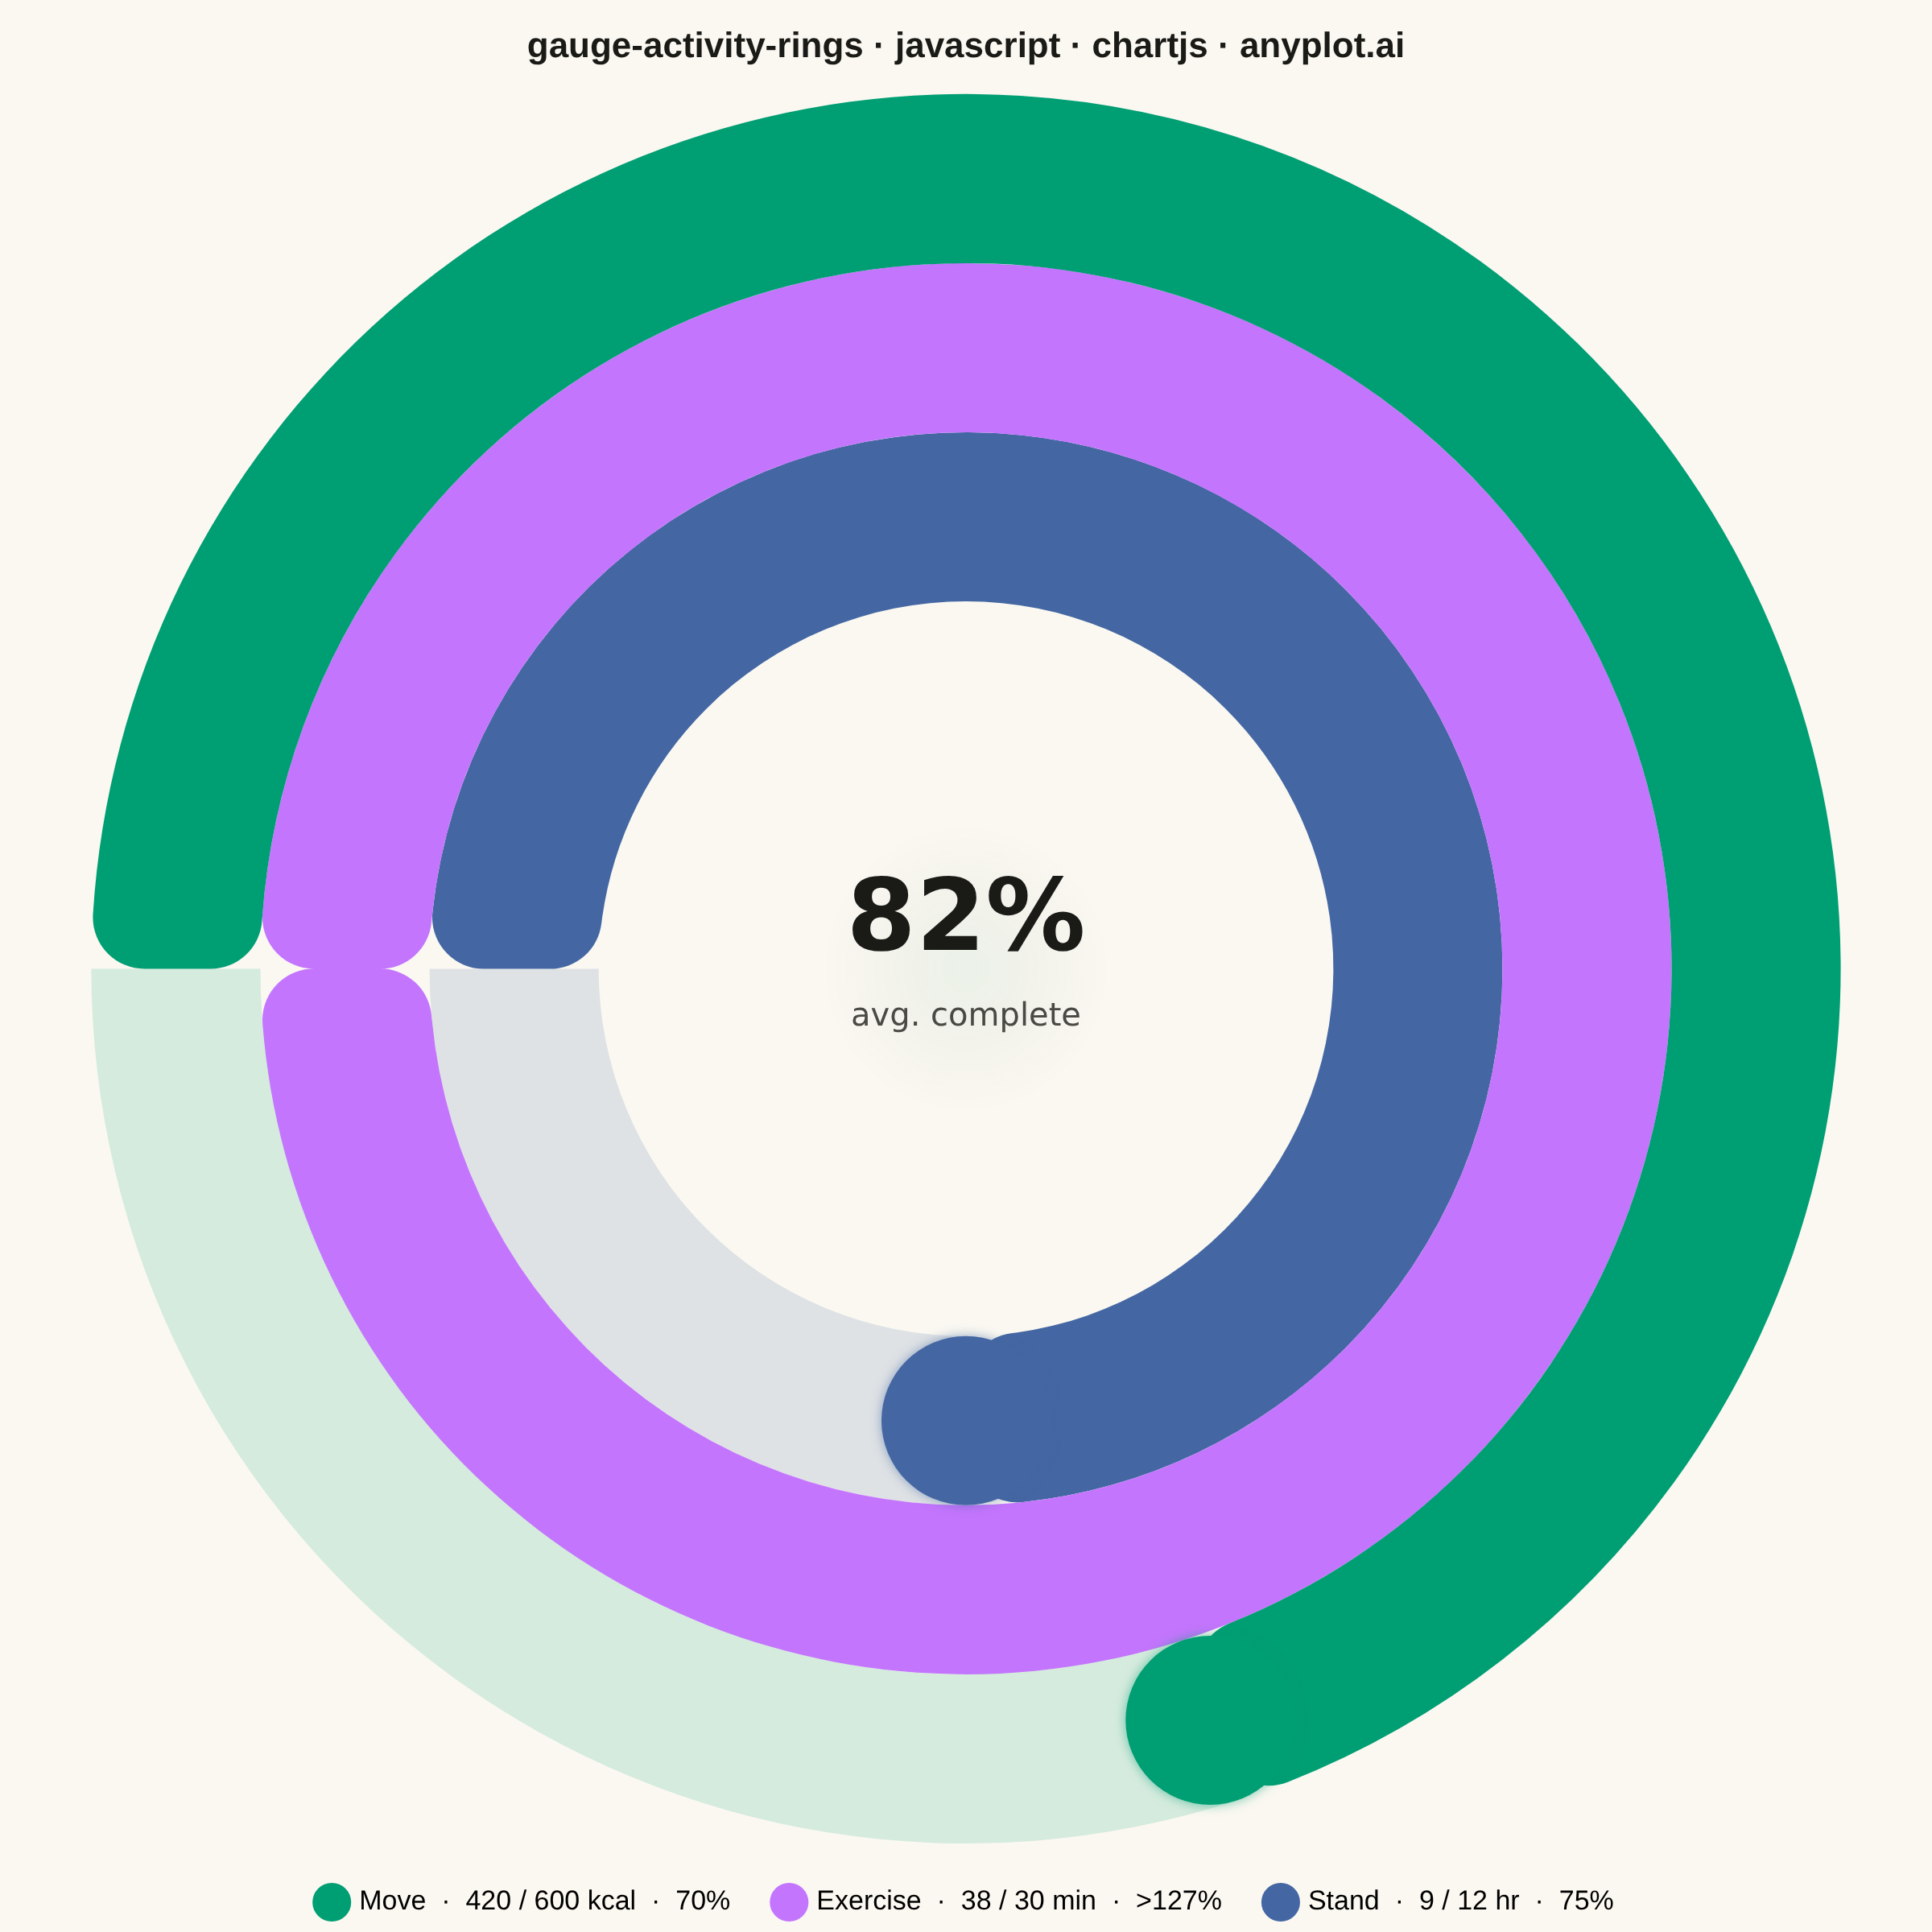
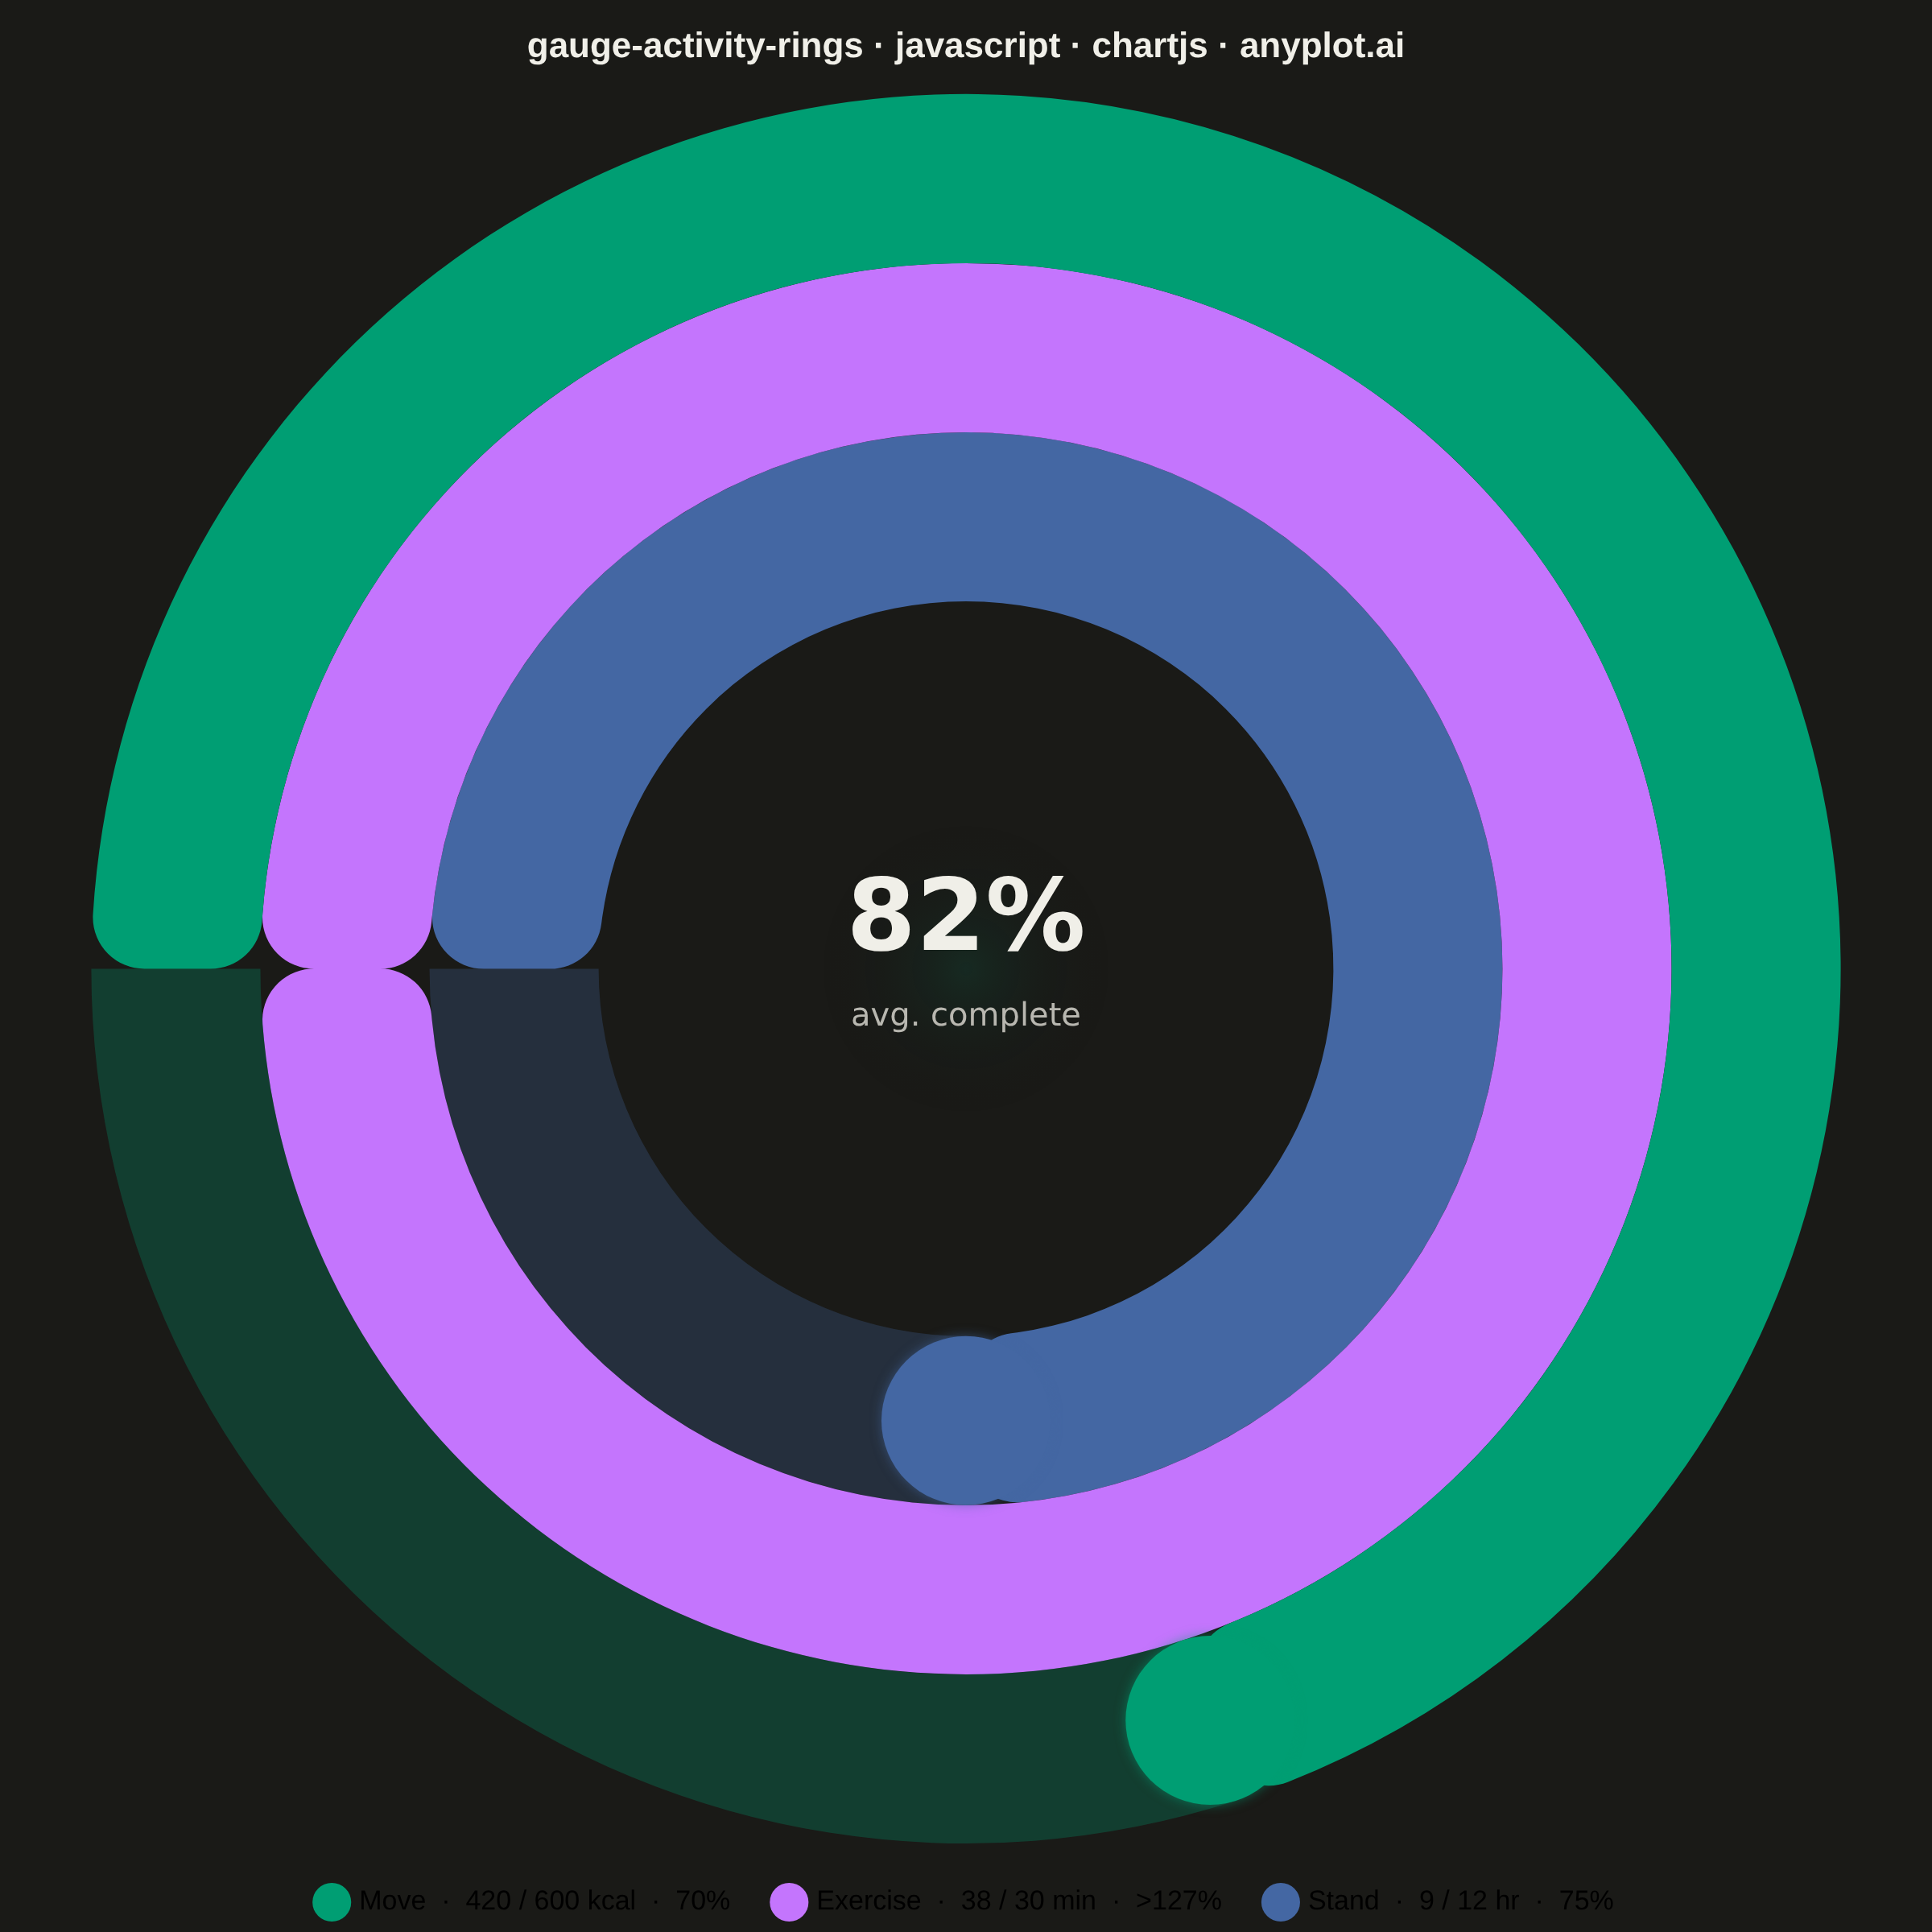
An activity rings chart displays goal completion for several metrics at once using concentric radial progress arcs, in the style popularized by fitness trackers. Each ring is a partial arc with rounded end caps that starts at the top (12 o'clock) and sweeps clockwise in proportion to how close the metric is to its goal, with a distinct color per metric and a faint background track showing the full circle. It is instantly recognizable and ideal for at-a-glance comparison of progress across a small set of related goals, filling the general radial-progress gap that needle gauges (`gauge-basic`) and polar bars (`polar-bar`) do not cover.
// anyplot.ai
// gauge-activity-rings: Activity Rings Progress Chart
// Library: chartjs 4.4.7 | JavaScript 22.22.3
// Quality: 92/100 | Created: 2026-06-14
//# anyplot-orientation: square

const t = window.ANYPLOT_TOKENS;
const isDark = window.ANYPLOT_THEME === "dark";

// --- Helpers ---
function hexToRgba(hex, alpha) {
  const r = parseInt(hex.slice(1, 3), 16);
  const g = parseInt(hex.slice(3, 5), 16);
  const b = parseInt(hex.slice(5, 7), 16);
  return `rgba(${r}, ${g}, ${b}, ${alpha})`;
}

// --- Data (daily fitness summary) ---
const rings = [
  { label: "Move",     value: 420, goal: 600, unit: "kcal" },
  { label: "Exercise", value: 38,  goal: 30,  unit: "min"  },
  { label: "Stand",    value: 9,   goal: 12,  unit: "hr"   },
];

// Theme-adaptive track opacity: dark bg absorbs translucent colours; increase alpha
const trackAlpha = isDark ? 0.28 : 0.15;

const datasets = rings.map((ring, i) => {
  const fraction = Math.min(ring.value / ring.goal, 1.0);
  const color = t.palette[i];
  return {
    label: ring.label,
    data: [fraction, 1 - fraction],
    backgroundColor: [color, hexToRgba(color, trackAlpha)],
    borderWidth: 0,
    borderRadius: (ctx) => (ctx.dataIndex === 0 ? 32 : 0),
  };
});

const avgPct = Math.round(
  rings.reduce((sum, r) => sum + Math.min(r.value / r.goal, 1), 0) / rings.length * 100
);

// --- Mount ---
const canvas = document.createElement("canvas");
document.getElementById("container").appendChild(canvas);

// --- Plugin: center summary + glowing progress-tip dots ---
const centerTextPlugin = {
  id: "centerText",
  afterDraw(chart) {
    const { ctx, chartArea } = chart;
    const cx = (chartArea.left + chartArea.right) / 2;
    const cy = (chartArea.top + chartArea.bottom) / 2;

    // Soft radial glow behind the percentage — lifts the focal point
    ctx.save();
    const glowR = 90;
    const grad = ctx.createRadialGradient(cx, cy, 0, cx, cy, glowR);
    grad.addColorStop(0, hexToRgba(t.palette[0], isDark ? 0.12 : 0.06));
    grad.addColorStop(1, "rgba(0,0,0,0)");
    ctx.fillStyle = grad;
    ctx.beginPath();
    ctx.arc(cx, cy, glowR, 0, Math.PI * 2);
    ctx.fill();
    ctx.restore();

    // Center percentage and sub-label
    ctx.save();
    ctx.textAlign = "center";
    ctx.textBaseline = "middle";
    ctx.font = `bold 62px system-ui, sans-serif`;
    ctx.fillStyle = t.ink;
    ctx.fillText(`${avgPct}%`, cx, cy - 28);
    ctx.font = `20px system-ui, sans-serif`;
    ctx.fillStyle = t.inkSoft;
    ctx.fillText("avg. complete", cx, cy + 30);
    ctx.restore();

    // Glowing dot at each ring's progress endpoint (skips full/over-100% rings)
    rings.forEach((ring, i) => {
      if (ring.value / ring.goal >= 1.0) return;
      const meta = chart.getDatasetMeta(i);
      const arc = meta.data[0];
      if (!arc) return;
      const dotR = (arc.outerRadius - arc.innerRadius) / 2;
      const midR = (arc.outerRadius + arc.innerRadius) / 2;
      const tipX = arc.x + midR * Math.cos(arc.endAngle);
      const tipY = arc.y + midR * Math.sin(arc.endAngle);
      ctx.save();
      ctx.beginPath();
      ctx.arc(tipX, tipY, dotR, 0, Math.PI * 2);
      ctx.fillStyle = t.palette[i];
      ctx.shadowColor = hexToRgba(t.palette[i], 0.55);
      ctx.shadowBlur = 14;
      ctx.fill();
      ctx.restore();
    });
  },
};

// --- Chart ---
new Chart(canvas, {
  type: "doughnut",
  plugins: [centerTextPlugin],
  data: {
    labels: ["Progress", "Remaining"],
    datasets,
  },
  options: {
    responsive: true,
    maintainAspectRatio: false,
    animation: false,
    rotation: -90,
    circumference: 360,
    cutout: "42%",
    plugins: {
      title: {
        display: true,
        text: "gauge-activity-rings · javascript · chartjs · anyplot.ai",
        color: t.ink,
        font: { size: 22 },
        padding: { top: 16, bottom: 16 },
      },
      legend: {
        display: true,
        position: "bottom",
        labels: {
          color: t.ink,
          font: { size: 17 },
          padding: 28,
          usePointStyle: true,
          pointStyle: "circle",
          generateLabels() {
            return rings.map((ring, i) => {
              const fraction = ring.value / ring.goal;
              const pct = Math.round(fraction * 100);
              const prefix = fraction > 1 ? ">" : "";
              return {
                text: `${ring.label}  ·  ${ring.value} / ${ring.goal} ${ring.unit}  ·  ${prefix}${pct}%`,
                fillStyle: t.palette[i],
                strokeStyle: "transparent",
                lineWidth: 0,
                hidden: false,
                datasetIndex: i,
                pointStyle: "circle",
              };
            });
          },
        },
      },
      tooltip: { enabled: false },
    },
  },
});
Runnable source as JSON, for any HTTP client: https://api.anyplot.ai/specs/gauge-activity-rings/chartjs/code. Any spec id and library id listed in llms-full.txt fit the same URL shape; every URL below is complete and callable.
{
  "spec_id": "gauge-activity-rings",
  "language": "javascript",
  "library": "chartjs",
  "page": "https://anyplot.ai/gauge-activity-rings/javascript/chartjs",
  "hub": "https://anyplot.ai/gauge-activity-rings",
  "code_json": "https://api.anyplot.ai/specs/gauge-activity-rings/chartjs/code",
  "spec_json": "https://api.anyplot.ai/specs/gauge-activity-rings",
  "render_light_png": "https://storage.googleapis.com/anyplot-images/plots/gauge-activity-rings/javascript/chartjs/plot-light.png",
  "render_dark_png": "https://storage.googleapis.com/anyplot-images/plots/gauge-activity-rings/javascript/chartjs/plot-dark.png",
  "interactive_light_html": "https://storage.googleapis.com/anyplot-images/plots/gauge-activity-rings/javascript/chartjs/plot-light.html",
  "interactive_dark_html": "https://storage.googleapis.com/anyplot-images/plots/gauge-activity-rings/javascript/chartjs/plot-dark.html",
  "quality_score": 92.0,
  "license": "MIT",
  "guide": "https://anyplot.ai/llms.txt"
}
Part of Activity Rings Progress Chart on anyplot.ai.