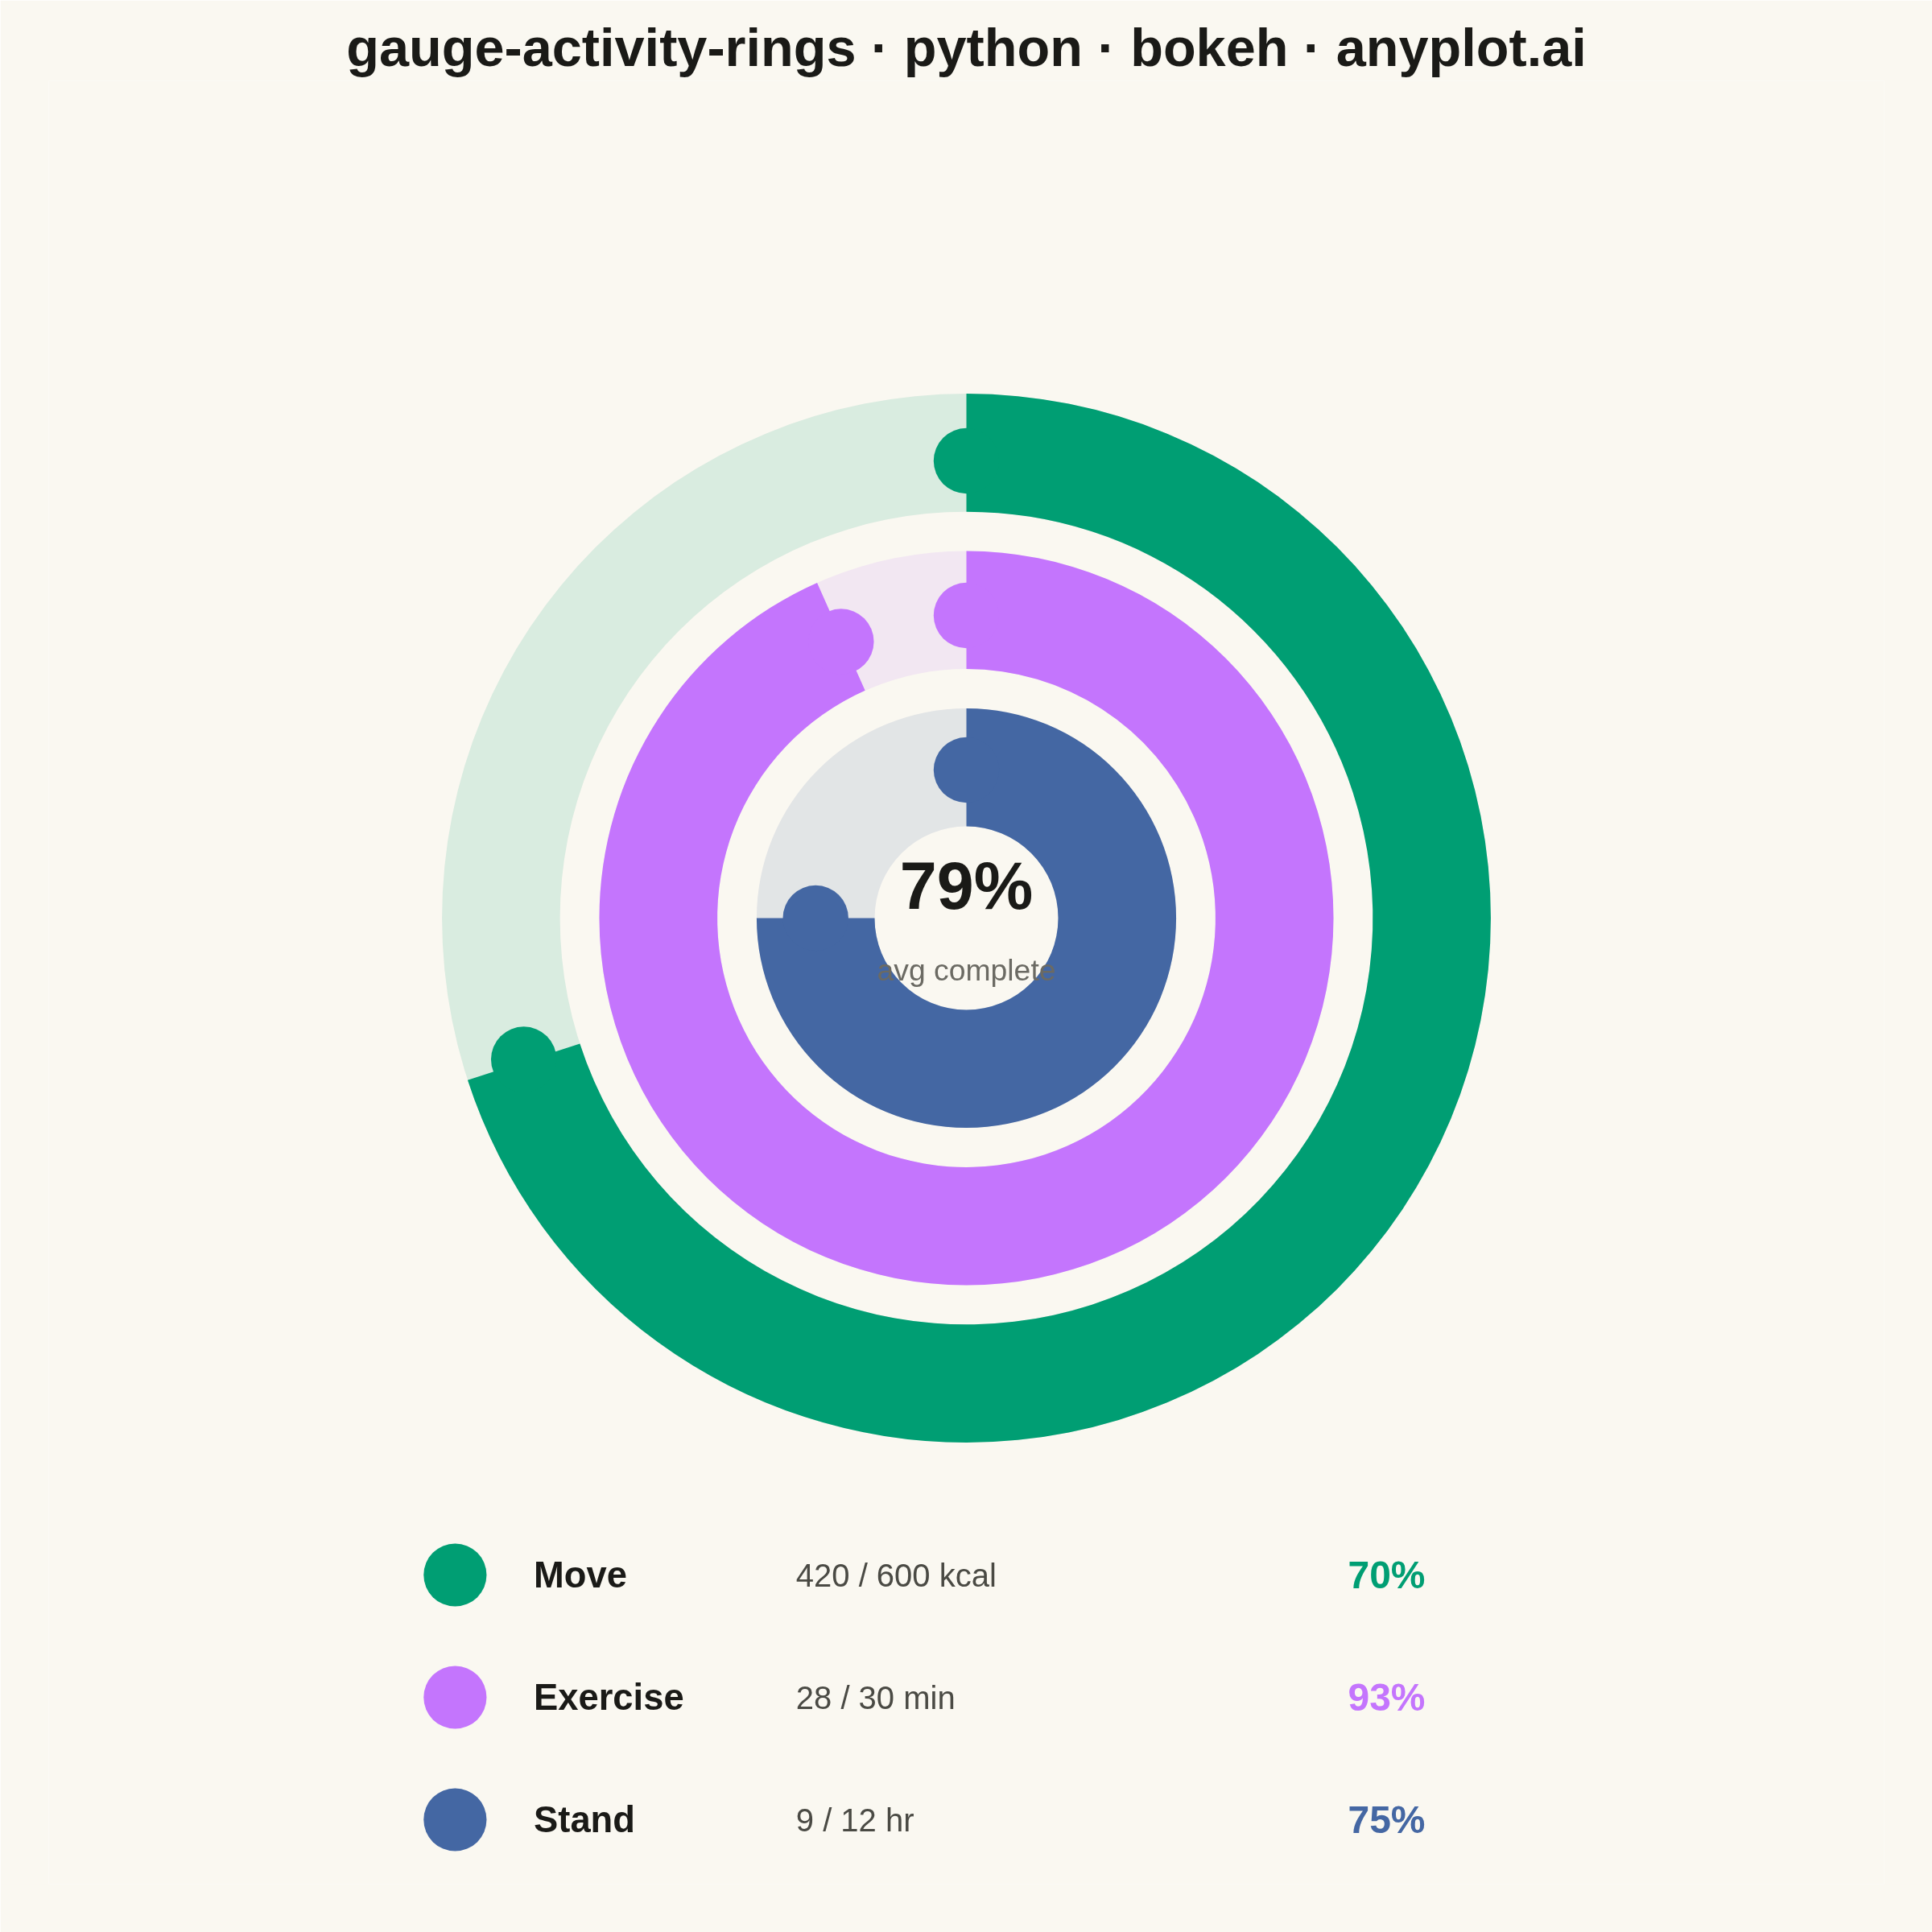
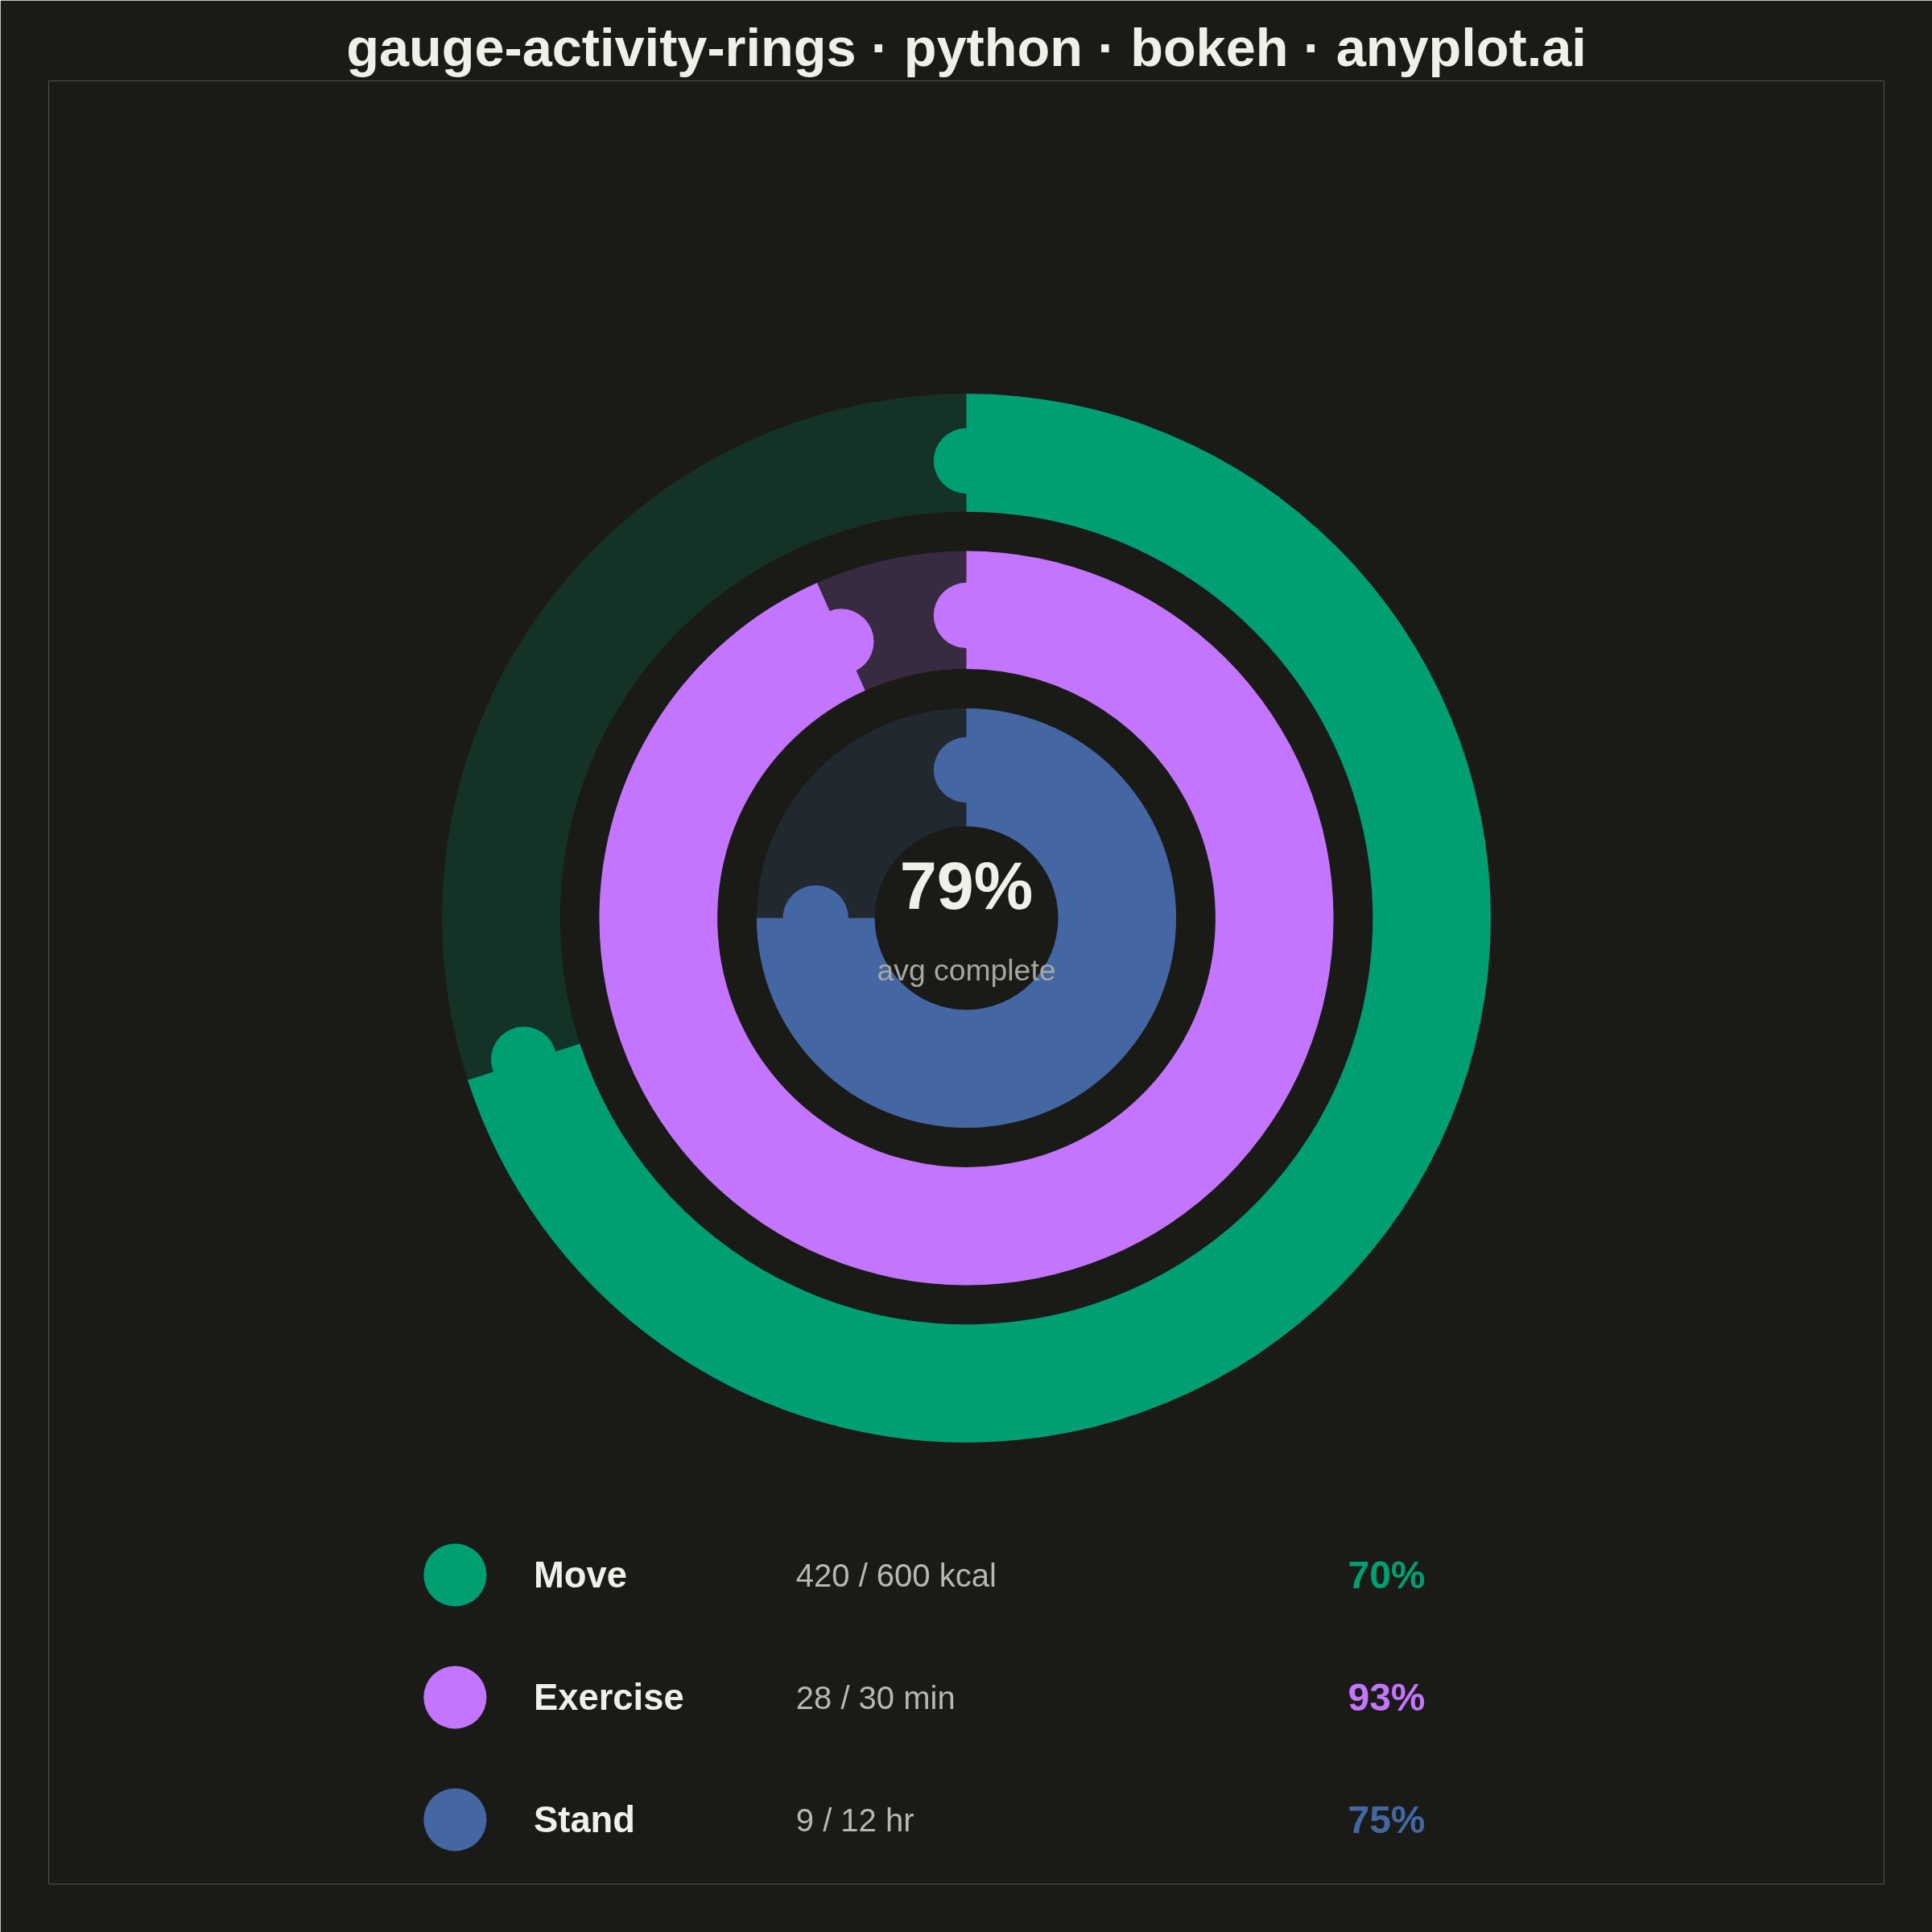
An activity rings chart displays goal completion for several metrics at once using concentric radial progress arcs, in the style popularized by fitness trackers. Each ring is a partial arc with rounded end caps that starts at the top (12 o'clock) and sweeps clockwise in proportion to how close the metric is to its goal, with a distinct color per metric and a faint background track showing the full circle. It is instantly recognizable and ideal for at-a-glance comparison of progress across a small set of related goals, filling the general radial-progress gap that needle gauges (`gauge-basic`) and polar bars (`polar-bar`) do not cover.
""" anyplot.ai
gauge-activity-rings: Activity Rings Progress Chart
Library: bokeh 3.9.1 | Python 3.13.13
Quality: 87/100 | Created: 2026-06-14
"""

import os
import sys


# Running as `python bokeh.py` adds this file's directory to sys.path[0],
# shadowing the installed bokeh package. Strip it before importing.
_this_dir = os.path.dirname(os.path.abspath(__file__))
_orig_path = sys.path.copy()
sys.path = [p for p in sys.path if os.path.abspath(p) != _this_dir]

import math
import time
from pathlib import Path

from bokeh.io import output_file, save
from bokeh.plotting import figure
from selenium import webdriver
from selenium.webdriver.chrome.options import Options


sys.path = _orig_path

# Theme tokens
THEME = os.getenv("ANYPLOT_THEME", "light")
PAGE_BG = "#FAF8F1" if THEME == "light" else "#1A1A17"
INK = "#1A1A17" if THEME == "light" else "#F0EFE8"
INK_SOFT = "#4A4A44" if THEME == "light" else "#B8B7B0"
INK_MUTED = "#6B6A63" if THEME == "light" else "#A8A79F"

# Imprint palette — positions 1-3 (theme-independent data colors)
COLORS = ["#009E73", "#C475FD", "#4467A3"]

# Data: daily fitness goal tracking
METRICS = ["Move", "Exercise", "Stand"]
VALUES = [420, 28, 9]
GOALS = [600, 30, 12]
UNITS = ["kcal", "min", "hr"]
FRACTIONS = [v / g for v, g in zip(VALUES, GOALS, strict=False)]

# Ring geometry — outer to inner, centered at (CX, CY)
CX, CY = 0.0, 0.10
OUTER_RADII = [0.80, 0.56, 0.32]
RING_WIDTH = 0.18
INNER_RADII = [r - RING_WIDTH for r in OUTER_RADII]
MID_RADII = [(o + i) / 2 for o, i in zip(OUTER_RADII, INNER_RADII, strict=False)]
CAP_R = 0.05  # radius of rounded end-cap circles — kept < ring gap (0.06) to avoid bleed

title = "gauge-activity-rings · python · bokeh · anyplot.ai"
W, H = 2400, 2400

# Figure — square canvas, axes hidden, match_aspect ensures circles are circular
p = figure(
    width=W,
    height=H,
    title=title,
    toolbar_location=None,
    x_range=(-1.4, 1.4),
    y_range=(-1.4, 1.4),
    match_aspect=True,
    min_border_bottom=60,
    min_border_left=60,
    min_border_top=100,
    min_border_right=60,
)

p.axis.visible = False
p.grid.visible = False
p.outline_line_color = None
p.outline_line_width = 0
p.background_fill_color = PAGE_BG
p.border_fill_color = PAGE_BG
p.title.text_color = INK
p.title.text_font_size = "50pt"
p.title.align = "center"

# Draw rings outer → inner
for color, frac, outer_r, inner_r, mid_r in zip(COLORS, FRACTIONS, OUTER_RADII, INNER_RADII, MID_RADII, strict=False):
    # Faint background track: full circle at low opacity
    p.annular_wedge(
        x=CX,
        y=CY,
        inner_radius=inner_r,
        outer_radius=outer_r,
        start_angle=0,
        end_angle=2 * math.pi,
        color=color,
        alpha=0.18 if THEME == "dark" else 0.13,
        line_color=None,
    )

    display_frac = min(frac, 1.0)
    if display_frac > 0.001:
        # Arc sweeps clockwise from 12 o'clock (π/2) to end angle
        start_a = math.pi / 2
        end_a = start_a - display_frac * 2 * math.pi

        p.annular_wedge(
            x=CX,
            y=CY,
            inner_radius=inner_r,
            outer_radius=outer_r,
            start_angle=start_a,
            end_angle=end_a,
            direction="clock",
            color=color,
            alpha=1.0,
            line_color=None,
        )

        # Rounded end caps: circles placed at the midline of the ring band
        p.circle(
            x=CX + mid_r * math.cos(start_a),
            y=CY + mid_r * math.sin(start_a),
            radius=CAP_R,
            color=color,
            alpha=1.0,
            line_color=None,
        )
        p.circle(
            x=CX + mid_r * math.cos(end_a),
            y=CY + mid_r * math.sin(end_a),
            radius=CAP_R,
            color=color,
            alpha=1.0,
            line_color=None,
        )

# Center text: average completion across all rings
avg_pct = int(sum(FRACTIONS) / len(FRACTIONS) * 100)
p.text(
    x=[CX],
    y=[CY + 0.05],
    text=[f"{avg_pct}%"],
    text_color=INK,
    text_font_size="62pt",
    text_font_style="bold",
    text_align="center",
    text_baseline="middle",
)
p.text(
    x=[CX],
    y=[CY - 0.08],
    text=["avg complete"],
    text_color=INK_MUTED,
    text_font_size="28pt",
    text_align="center",
    text_baseline="middle",
)

# Legend below the rings: dot · name · value/goal · percentage
leg_y0 = CY - OUTER_RADII[0] - 0.22
gap = 0.19
dot_r = 0.048
lx_left = -0.78

for i, (metric, val, goal, unit, color, frac) in enumerate(
    zip(METRICS, VALUES, GOALS, UNITS, COLORS, FRACTIONS, strict=False)
):
    ly = leg_y0 - i * gap

    p.circle(x=lx_left, y=ly, radius=dot_r, color=color, alpha=1.0, line_color=None)

    p.text(
        x=[lx_left + 0.12],
        y=[ly],
        text=[metric],
        text_color=INK,
        text_font_size="34pt",
        text_font_style="bold",
        text_align="left",
        text_baseline="middle",
    )
    p.text(
        x=[lx_left + 0.52],
        y=[ly],
        text=[f"{val} / {goal} {unit}"],
        text_color=INK_SOFT,
        text_font_size="30pt",
        text_align="left",
        text_baseline="middle",
    )
    p.text(
        x=[0.70],
        y=[ly],
        text=[f"{int(frac * 100)}%"],
        text_color=color,
        text_font_size="36pt",
        text_font_style="bold",
        text_align="right",
        text_baseline="middle",
    )

# Save interactive HTML artifact
output_file(f"plot-{THEME}.html")
save(p)

# Screenshot via headless Chrome (Selenium 4 — auto-resolves driver)
# Window height needs +143px to compensate for Chrome's internal viewport offset,
# so the viewport (screenshot) comes out at exactly W×H = 2400×2400.
SW, SH = W, H + 143
opts = Options()
for arg in (
    "--headless=new",
    "--no-sandbox",
    "--disable-dev-shm-usage",
    "--disable-gpu",
    f"--window-size={SW},{SH}",
    "--hide-scrollbars",
):
    opts.add_argument(arg)
driver = webdriver.Chrome(options=opts)
driver.set_window_size(SW, SH)
driver.get(f"file://{Path(f'plot-{THEME}.html').resolve()}")
time.sleep(3)
driver.save_screenshot(f"plot-{THEME}.png")
driver.quit()
Runnable source as JSON, for any HTTP client: https://api.anyplot.ai/specs/gauge-activity-rings/bokeh/code. Any spec id and library id listed in llms-full.txt fit the same URL shape; every URL below is complete and callable.
{
  "spec_id": "gauge-activity-rings",
  "language": "python",
  "library": "bokeh",
  "page": "https://anyplot.ai/gauge-activity-rings/python/bokeh",
  "hub": "https://anyplot.ai/gauge-activity-rings",
  "code_json": "https://api.anyplot.ai/specs/gauge-activity-rings/bokeh/code",
  "spec_json": "https://api.anyplot.ai/specs/gauge-activity-rings",
  "render_light_png": "https://storage.googleapis.com/anyplot-images/plots/gauge-activity-rings/python/bokeh/plot-light.png",
  "render_dark_png": "https://storage.googleapis.com/anyplot-images/plots/gauge-activity-rings/python/bokeh/plot-dark.png",
  "interactive_light_html": "https://storage.googleapis.com/anyplot-images/plots/gauge-activity-rings/python/bokeh/plot-light.html",
  "interactive_dark_html": "https://storage.googleapis.com/anyplot-images/plots/gauge-activity-rings/python/bokeh/plot-dark.html",
  "quality_score": 87.0,
  "license": "MIT",
  "guide": "https://anyplot.ai/llms.txt"
}
Part of Activity Rings Progress Chart on anyplot.ai.