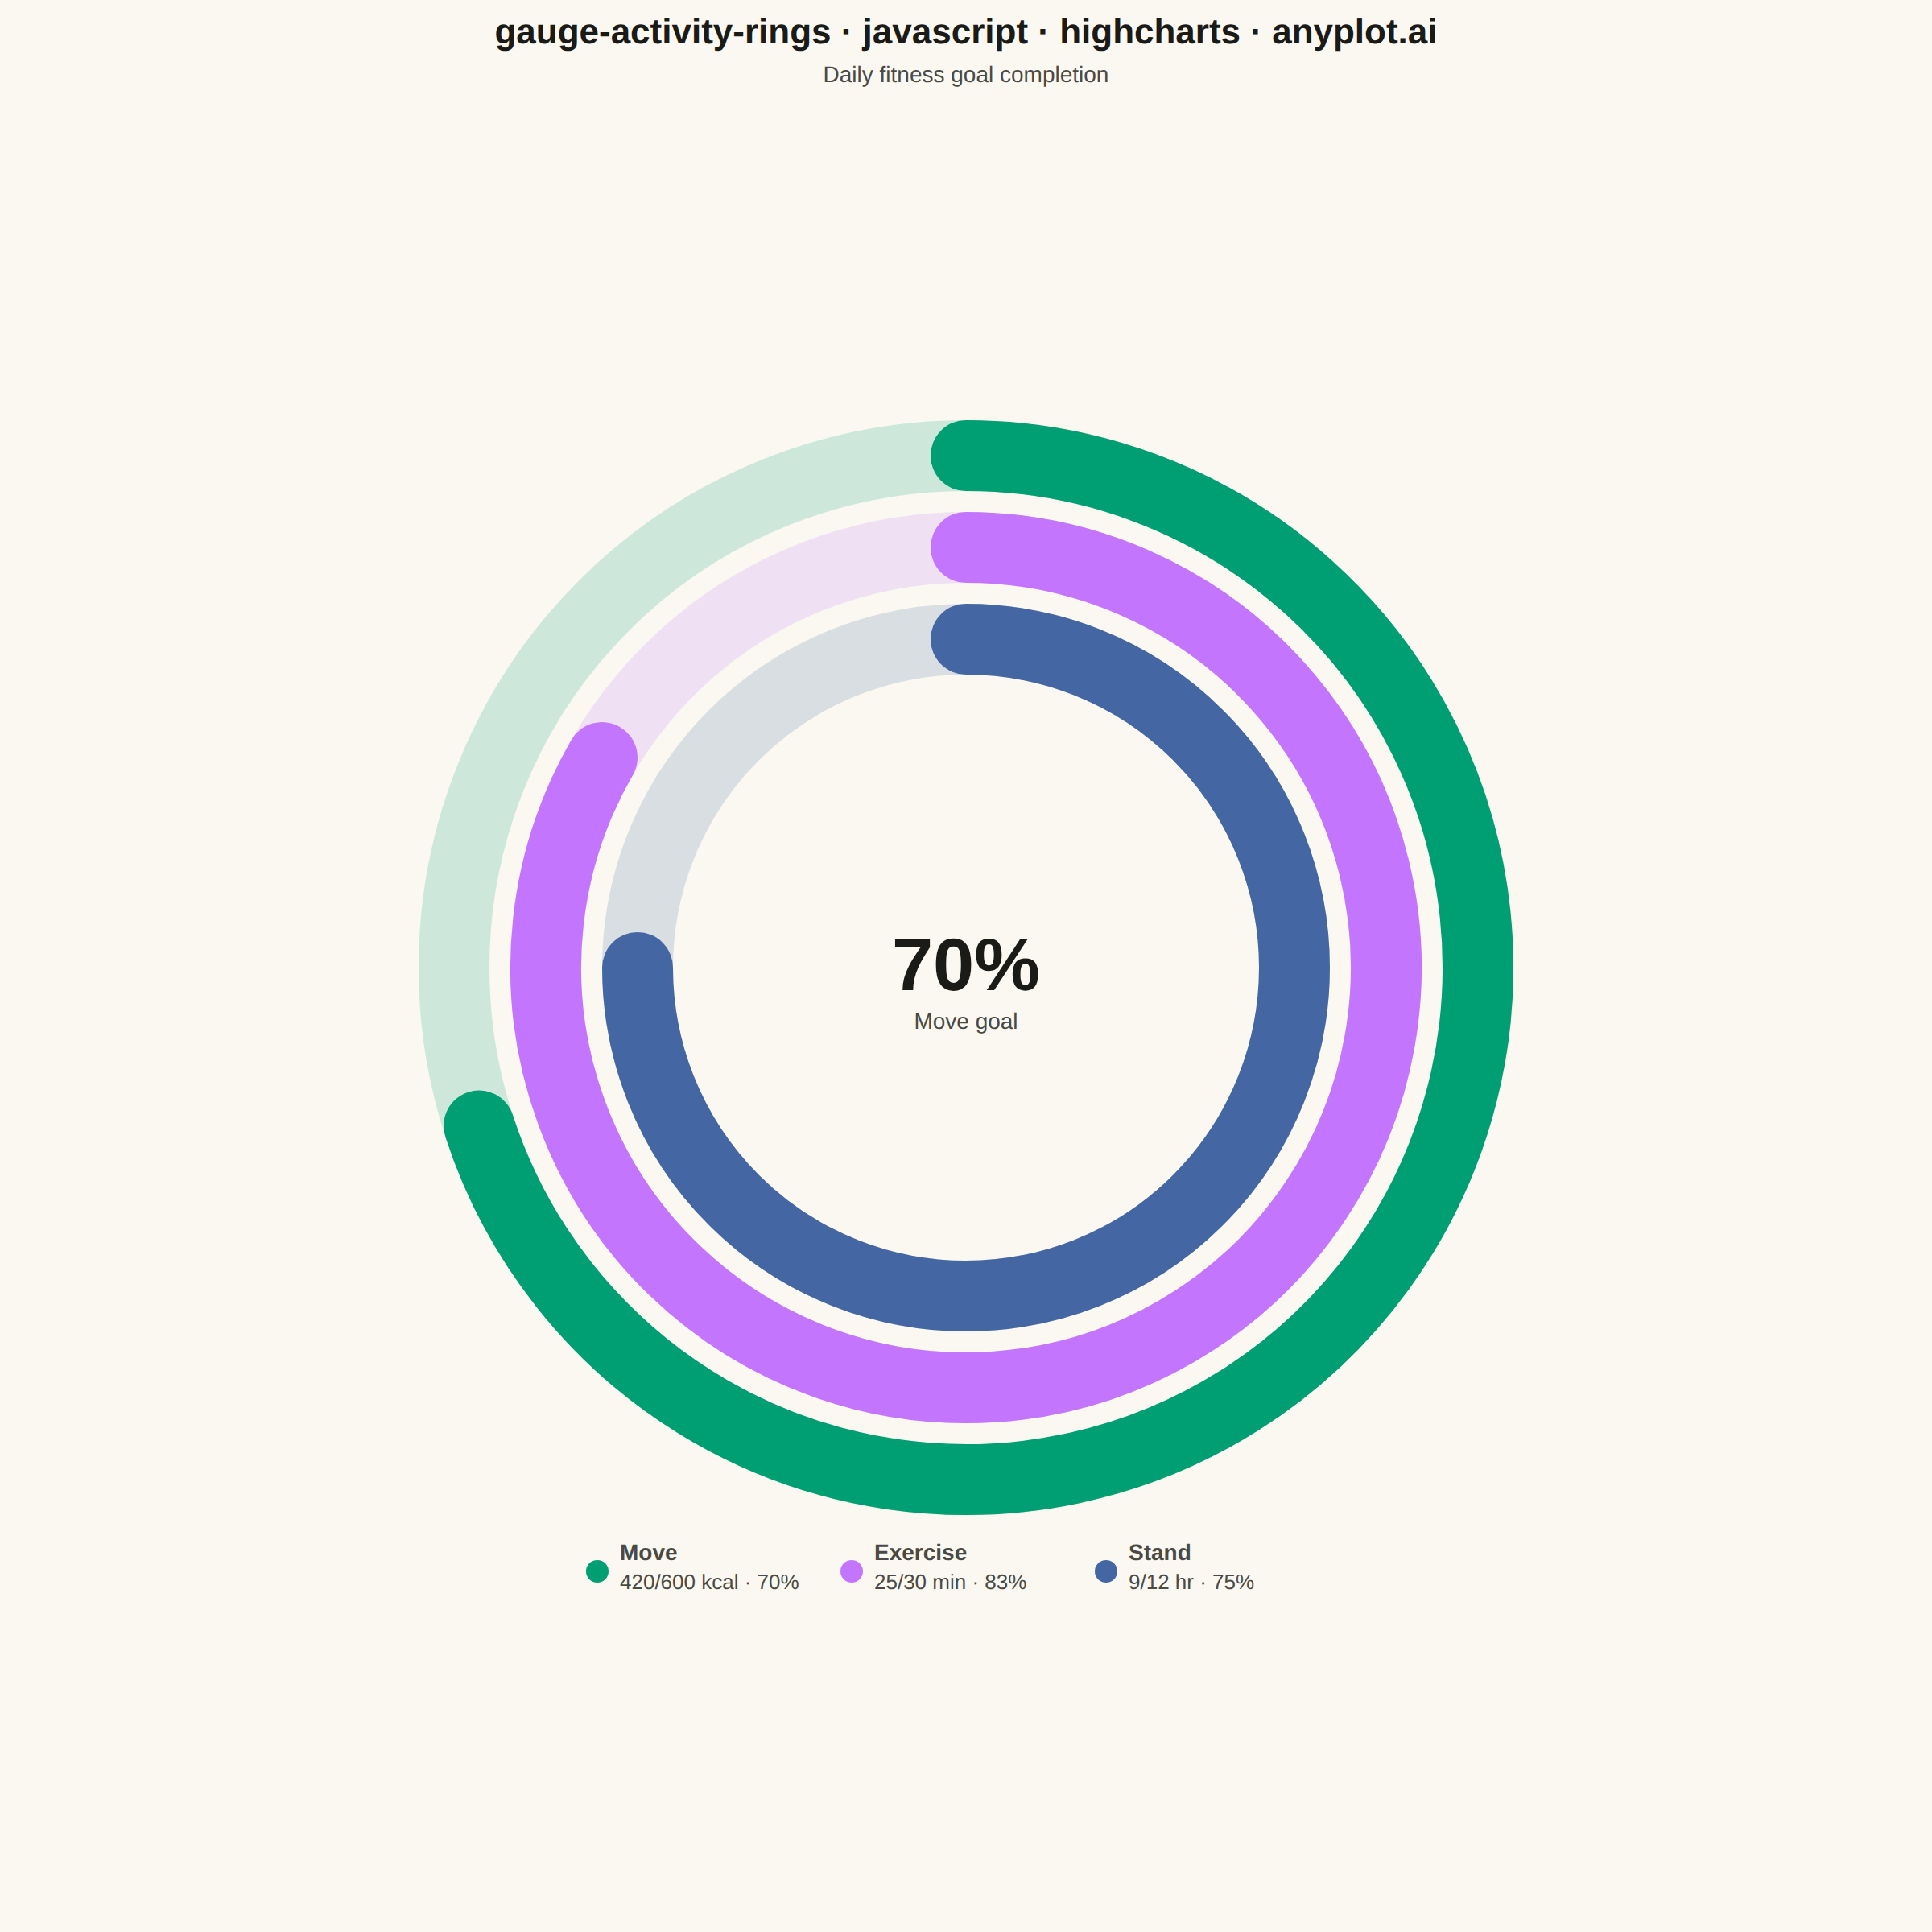
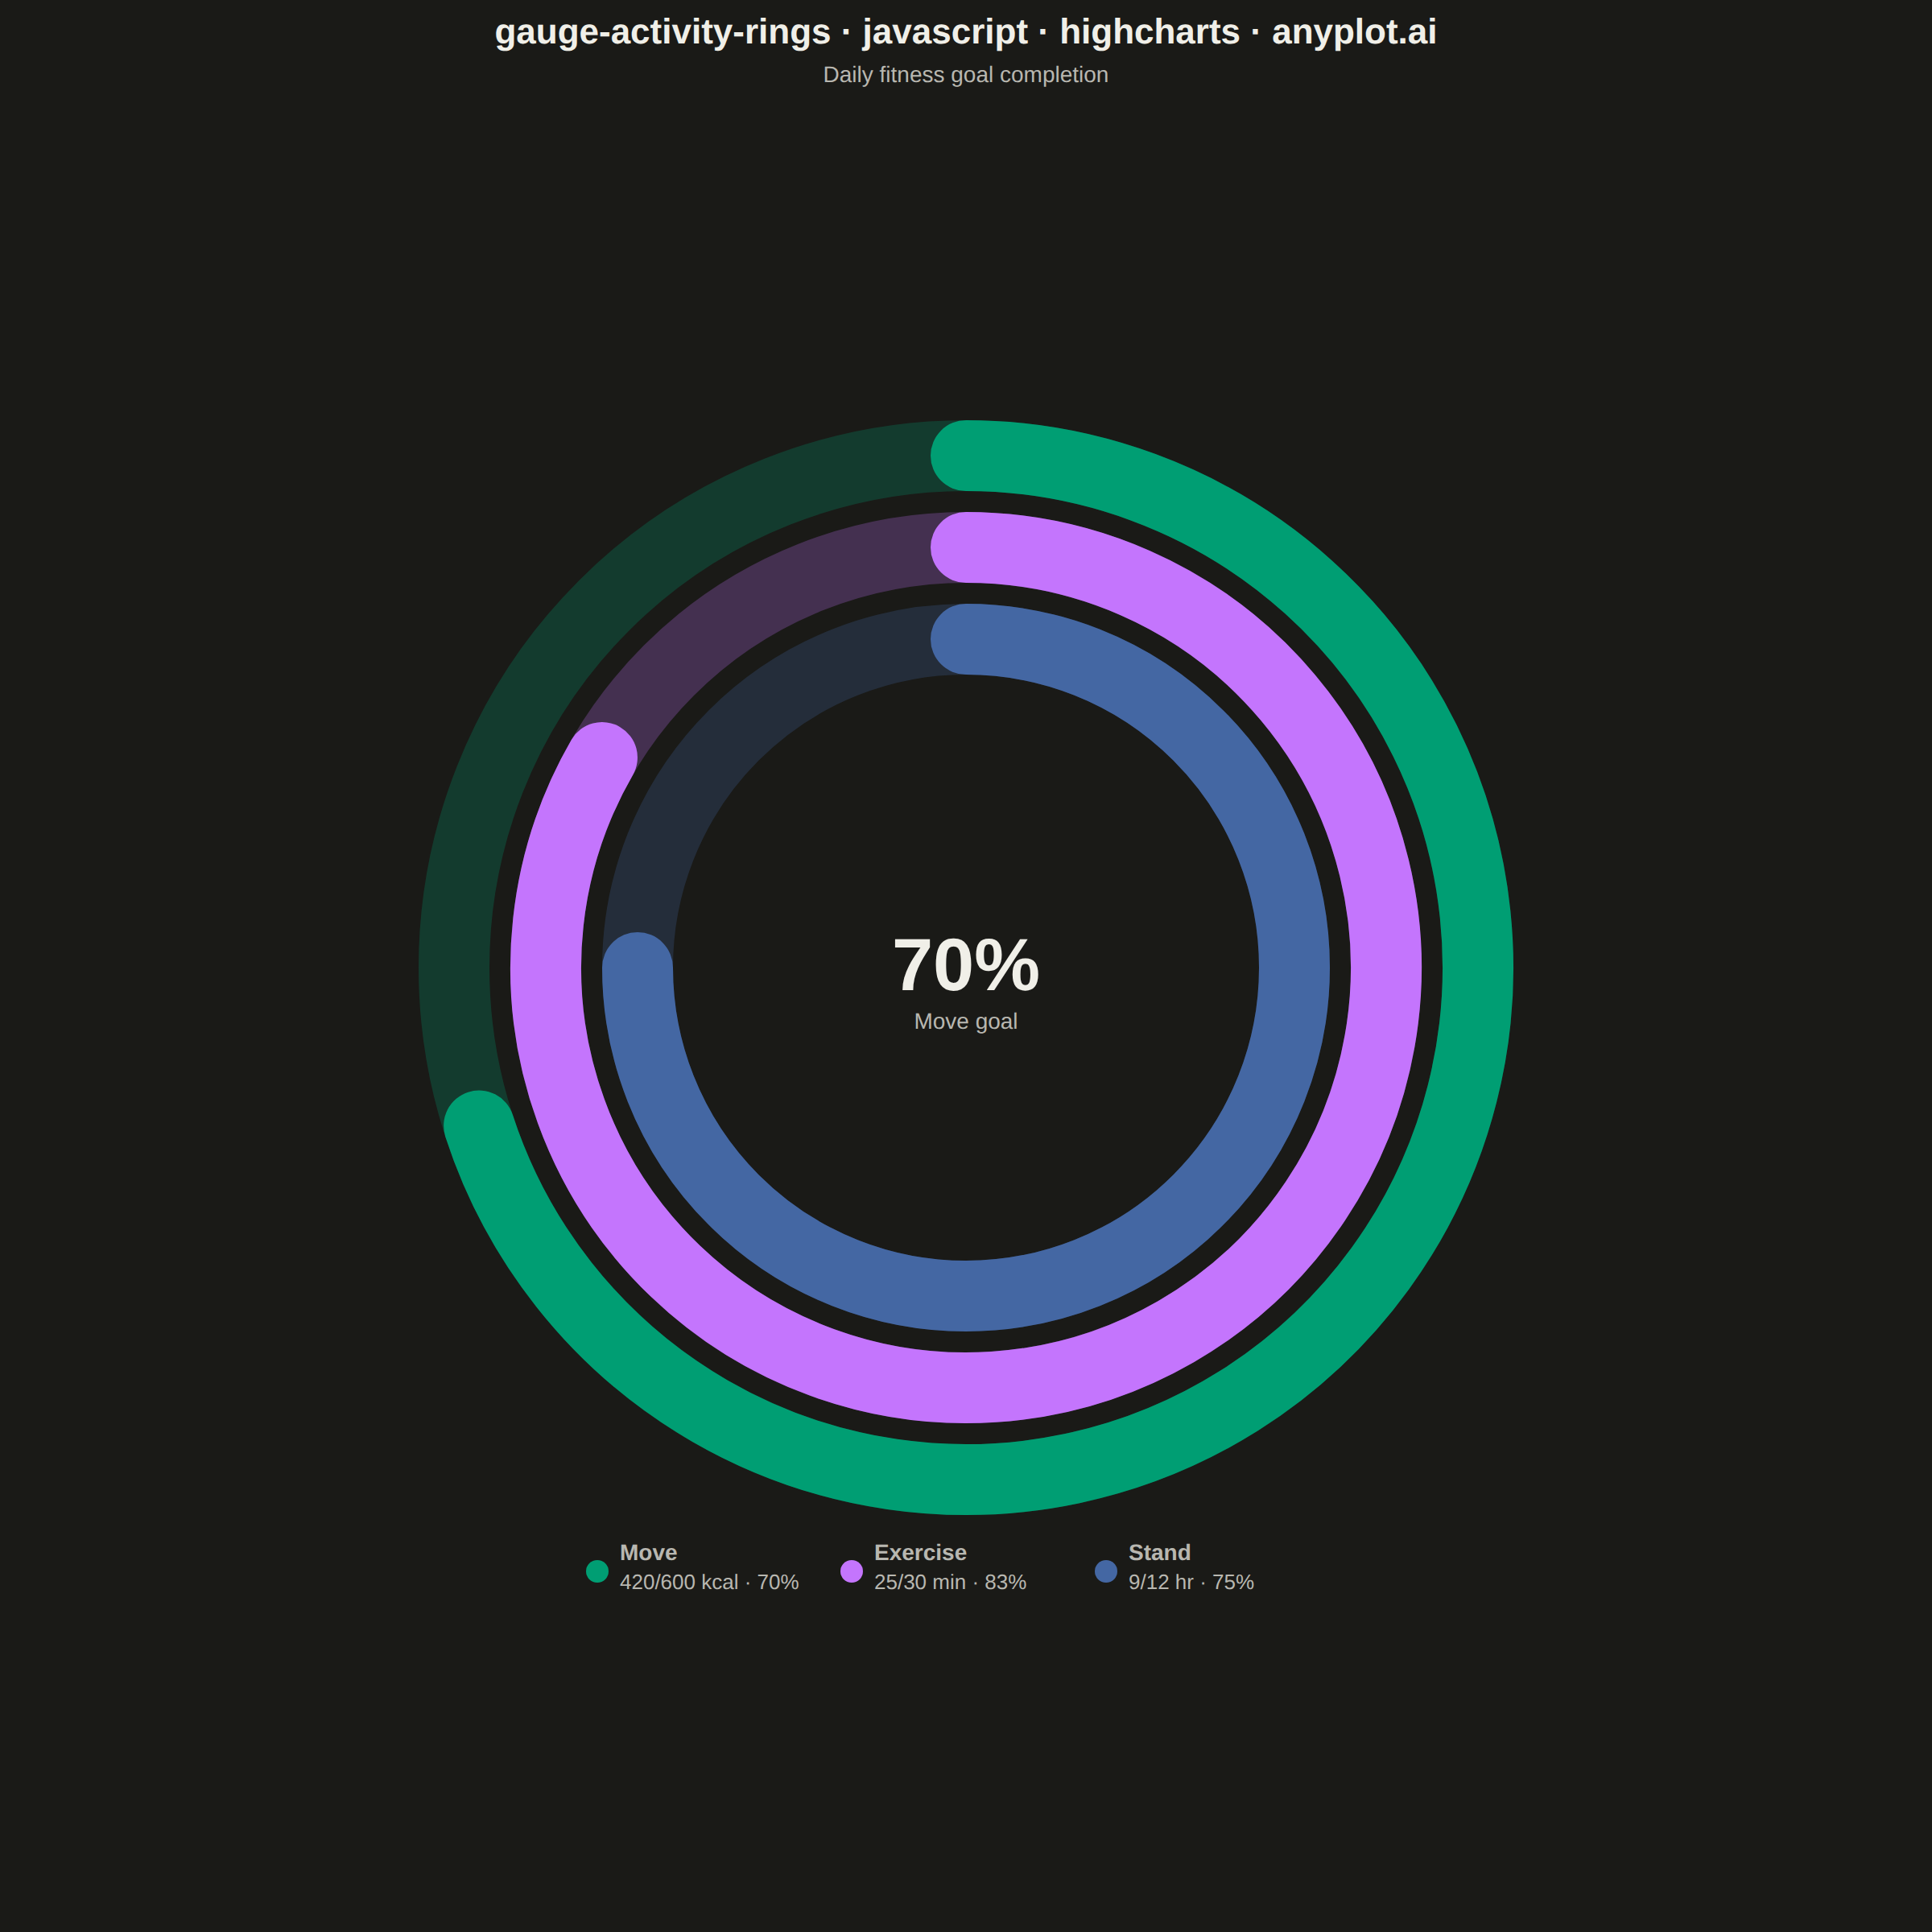
An activity rings chart displays goal completion for several metrics at once using concentric radial progress arcs, in the style popularized by fitness trackers. Each ring is a partial arc with rounded end caps that starts at the top (12 o'clock) and sweeps clockwise in proportion to how close the metric is to its goal, with a distinct color per metric and a faint background track showing the full circle. It is instantly recognizable and ideal for at-a-glance comparison of progress across a small set of related goals, filling the general radial-progress gap that needle gauges (`gauge-basic`) and polar bars (`polar-bar`) do not cover.
// anyplot.ai
// gauge-activity-rings: Activity Rings Progress Chart
// Library: highcharts 12.6.0 | JavaScript 22.22.3
// Quality: 91/100 | Created: 2026-06-14
//# anyplot-orientation: square
// anyplot.ai
// gauge-activity-rings: Activity Rings Progress Chart
// Library: Highcharts 12.6.0 | Node 22
// License: Highcharts — commercial license, free for non-commercial use (highcharts.com/license)
// Quality: pending | Created: 2026-06-14

const t = window.ANYPLOT_TOKENS;
const isDark = window.ANYPLOT_THEME === "dark";

// --- Data: Daily fitness summary -------------------------------------------
// Outer ring first (Move), then Exercise, then Stand (innermost)
const rings = [
  { metric: "Move",     value: 420, goal: 600, unit: "kcal", color: t.palette[0] },
  { metric: "Exercise", value: 25,  goal: 30,  unit: "min",  color: t.palette[1] },
  { metric: "Stand",    value: 9,   goal: 12,  unit: "hr",   color: t.palette[2] },
];

// Dark mode: low-opacity hue over near-black background disappears at 18% opacity;
// 25% keeps the track visible without overshadowing the progress arc.
const trackOpacity = isDark ? 0.25 : 0.18;

let rendererEls = [];

function clearEls() {
  rendererEls.forEach(el => { try { el.destroy(); } catch (_) {} });
  rendererEls = [];
}

function drawRings(chart) {
  clearEls();
  const ren = chart.renderer;
  const W = chart.chartWidth;
  const H = chart.chartHeight;
  const cx = W / 2;
  const plotTop = chart.plotTop;

  // Ring geometry — radius limited by canvas width
  const maxR = Math.round(Math.min(W * 0.265, (H - plotTop - 100) * 0.45));
  const strokeW = Math.round(maxR * 0.138);
  const ringGap = Math.round(strokeW * 0.30);

  // Center the rings+legend block vertically between plotTop and the canvas bottom
  // so equal whitespace appears above and below the visual content.
  const ringVisH = 2 * (maxR + Math.round(strokeW * 0.5));
  const totalVisH = ringVisH + 28 + 36; // 28px gap + ~36px for two legend lines
  const topOffset = Math.max(0, (H - plotTop - totalVisH) / 2);
  const cy = plotTop + topOffset + maxR + Math.round(strokeW * 0.5);

  // Legend sits directly below the outermost ring
  const legY = cy + maxR + Math.round(strokeW * 0.5) + 28;

  rings.forEach((ring, i) => {
    const r = maxR - i * (strokeW + ringGap);
    // Clamp fraction to avoid degenerate full-circle arc edge case
    const frac = Math.min(ring.value / ring.goal, 0.9999);

    const startA = -Math.PI / 2; // 12 o'clock
    const endA = startA + frac * 2 * Math.PI;
    const x1 = cx + r * Math.cos(startA);
    const y1 = cy + r * Math.sin(startA);
    const x2 = cx + r * Math.cos(endA);
    const y2 = cy + r * Math.sin(endA);
    const largeArc = frac > 0.5 ? 1 : 0;

    // Faint background track (full circle)
    rendererEls.push(
      ren.circle(cx, cy, r).attr({
        fill: "none",
        stroke: ring.color,
        "stroke-width": strokeW,
        "stroke-opacity": trackOpacity,
        zIndex: 3,
      }).add()
    );

    // Progress arc with rounded end caps — the iconic activity-ring look
    rendererEls.push(
      ren.path(["M", x1, y1, "A", r, r, 0, largeArc, 1, x2, y2]).attr({
        fill: "none",
        stroke: ring.color,
        "stroke-width": strokeW,
        "stroke-linecap": "round",
        zIndex: 4,
      }).add()
    );
  });

  // Center label: primary metric (Move) percentage
  const movePct = Math.round((rings[0].value / rings[0].goal) * 100);
  rendererEls.push(
    ren.text(movePct + "%", cx, cy + 14)
      .attr({ align: "center", zIndex: 5 })
      .css({ color: t.ink, fontSize: "46px", fontWeight: "700" })
      .add()
  );
  rendererEls.push(
    ren.text("Move goal", cx, cy + 38)
      .attr({ align: "center", zIndex: 5 })
      .css({ color: t.inkSoft, fontSize: "14px" })
      .add()
  );

  // Legend: three columns, centered horizontally
  const ITEM_W = 158;
  const legStartX = (W - rings.length * ITEM_W) / 2;

  rings.forEach((ring, i) => {
    const lx = legStartX + i * ITEM_W;
    const pct = Math.round((ring.value / ring.goal) * 100);

    rendererEls.push(
      ren.circle(lx + 8, legY + 7, 7).attr({ fill: ring.color, zIndex: 5 }).add()
    );
    rendererEls.push(
      ren.text(ring.metric, lx + 22, legY)
        .attr({ align: "left", zIndex: 5 })
        .css({ color: t.inkSoft, fontSize: "14px", fontWeight: "600" })
        .add()
    );
    rendererEls.push(
      ren.text(ring.value + "/" + ring.goal + " " + ring.unit + "  ·  " + pct + "%", lx + 22, legY + 18)
        .attr({ align: "left", zIndex: 5 })
        .css({ color: t.inkSoft, fontSize: "13px" })
        .add()
    );
  });
}

// --- Chart -----------------------------------------------------------------
Highcharts.chart("container", {
  chart: {
    backgroundColor: "transparent",
    animation: false,
    style: { fontFamily: "inherit" },
    events: {
      render: function () { drawRings(this); },
    },
  },
  credits:  { enabled: false },
  colors:   t.palette,
  title: {
    text: "gauge-activity-rings · javascript · highcharts · anyplot.ai",
    style: { color: t.ink, fontSize: "22px", fontWeight: "600" },
  },
  subtitle: {
    text: "Daily fitness goal completion",
    style: { color: t.inkSoft, fontSize: "14px" },
  },
  xAxis: { visible: false },
  yAxis: { visible: false },
  legend: { enabled: false },
  plotOptions: { series: { animation: false } },
  series: [],
});
Runnable source as JSON, for any HTTP client: https://api.anyplot.ai/specs/gauge-activity-rings/highcharts/code. Any spec id and library id listed in llms-full.txt fit the same URL shape; every URL below is complete and callable.
{
  "spec_id": "gauge-activity-rings",
  "language": "javascript",
  "library": "highcharts",
  "page": "https://anyplot.ai/gauge-activity-rings/javascript/highcharts",
  "hub": "https://anyplot.ai/gauge-activity-rings",
  "code_json": "https://api.anyplot.ai/specs/gauge-activity-rings/highcharts/code",
  "spec_json": "https://api.anyplot.ai/specs/gauge-activity-rings",
  "render_light_png": "https://storage.googleapis.com/anyplot-images/plots/gauge-activity-rings/javascript/highcharts/plot-light.png",
  "render_dark_png": "https://storage.googleapis.com/anyplot-images/plots/gauge-activity-rings/javascript/highcharts/plot-dark.png",
  "interactive_light_html": "https://storage.googleapis.com/anyplot-images/plots/gauge-activity-rings/javascript/highcharts/plot-light.html",
  "interactive_dark_html": "https://storage.googleapis.com/anyplot-images/plots/gauge-activity-rings/javascript/highcharts/plot-dark.html",
  "quality_score": 91.0,
  "license": "MIT",
  "guide": "https://anyplot.ai/llms.txt"
}
Part of Activity Rings Progress Chart on anyplot.ai.