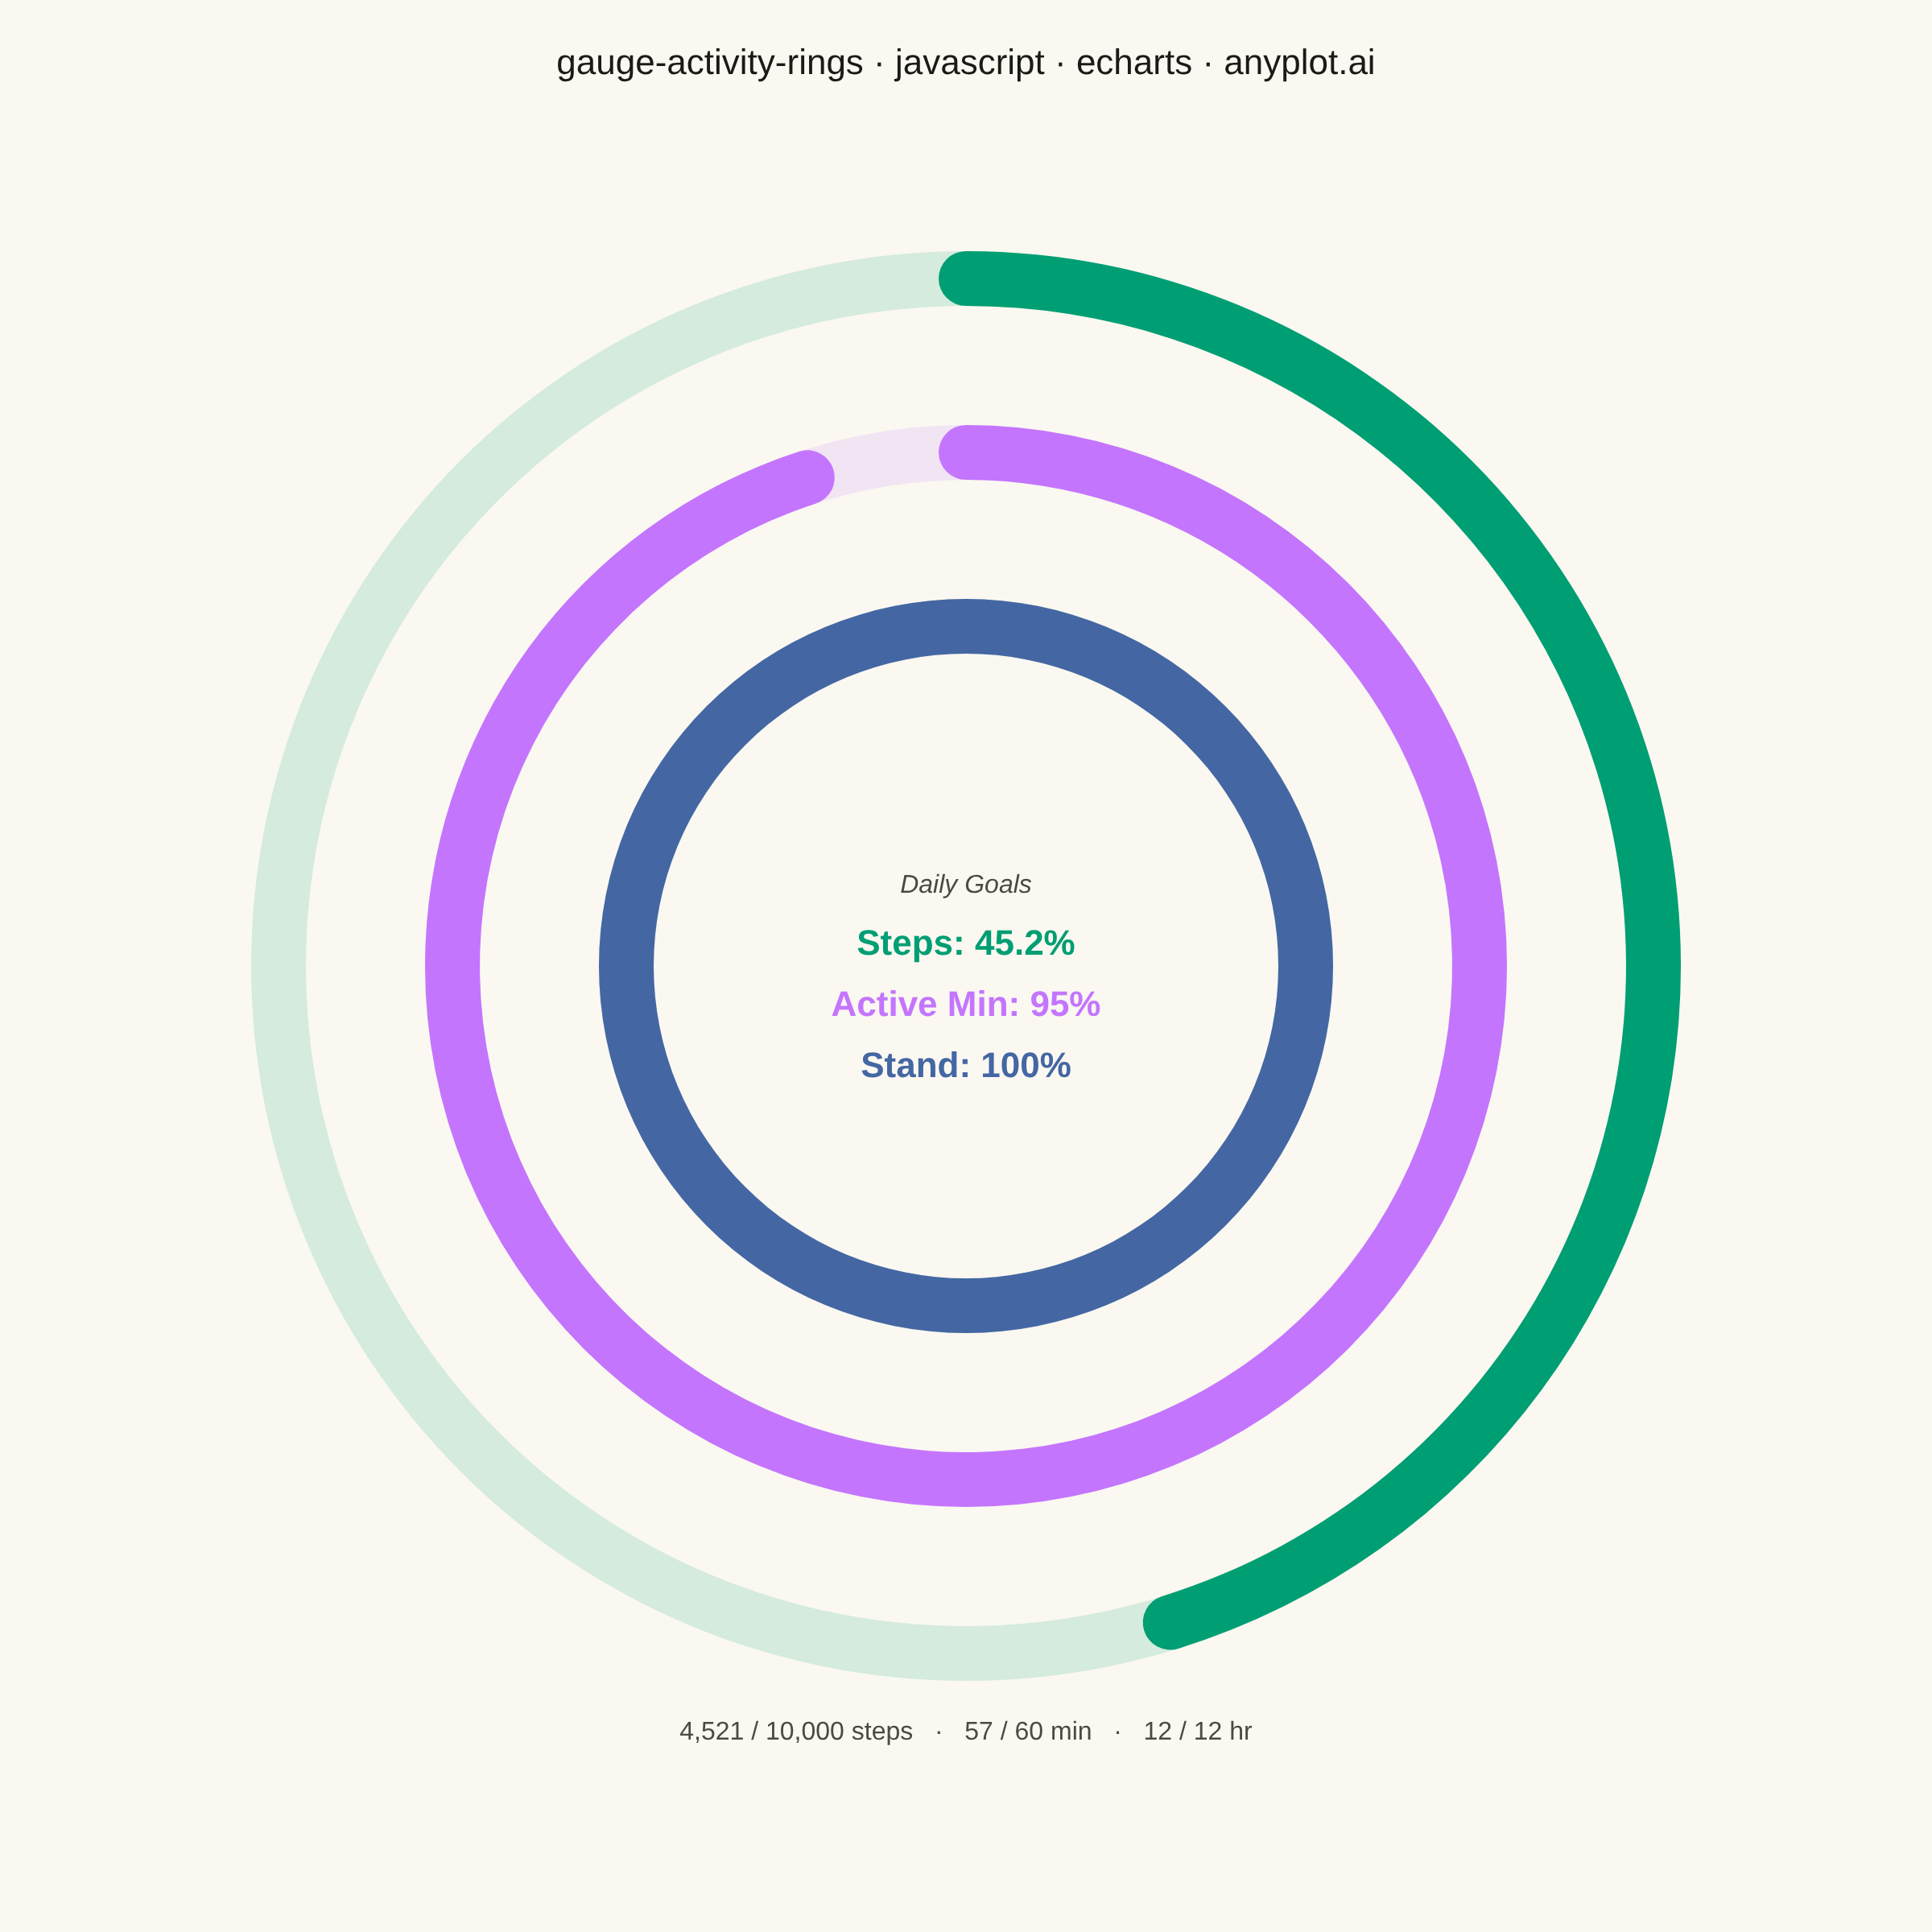
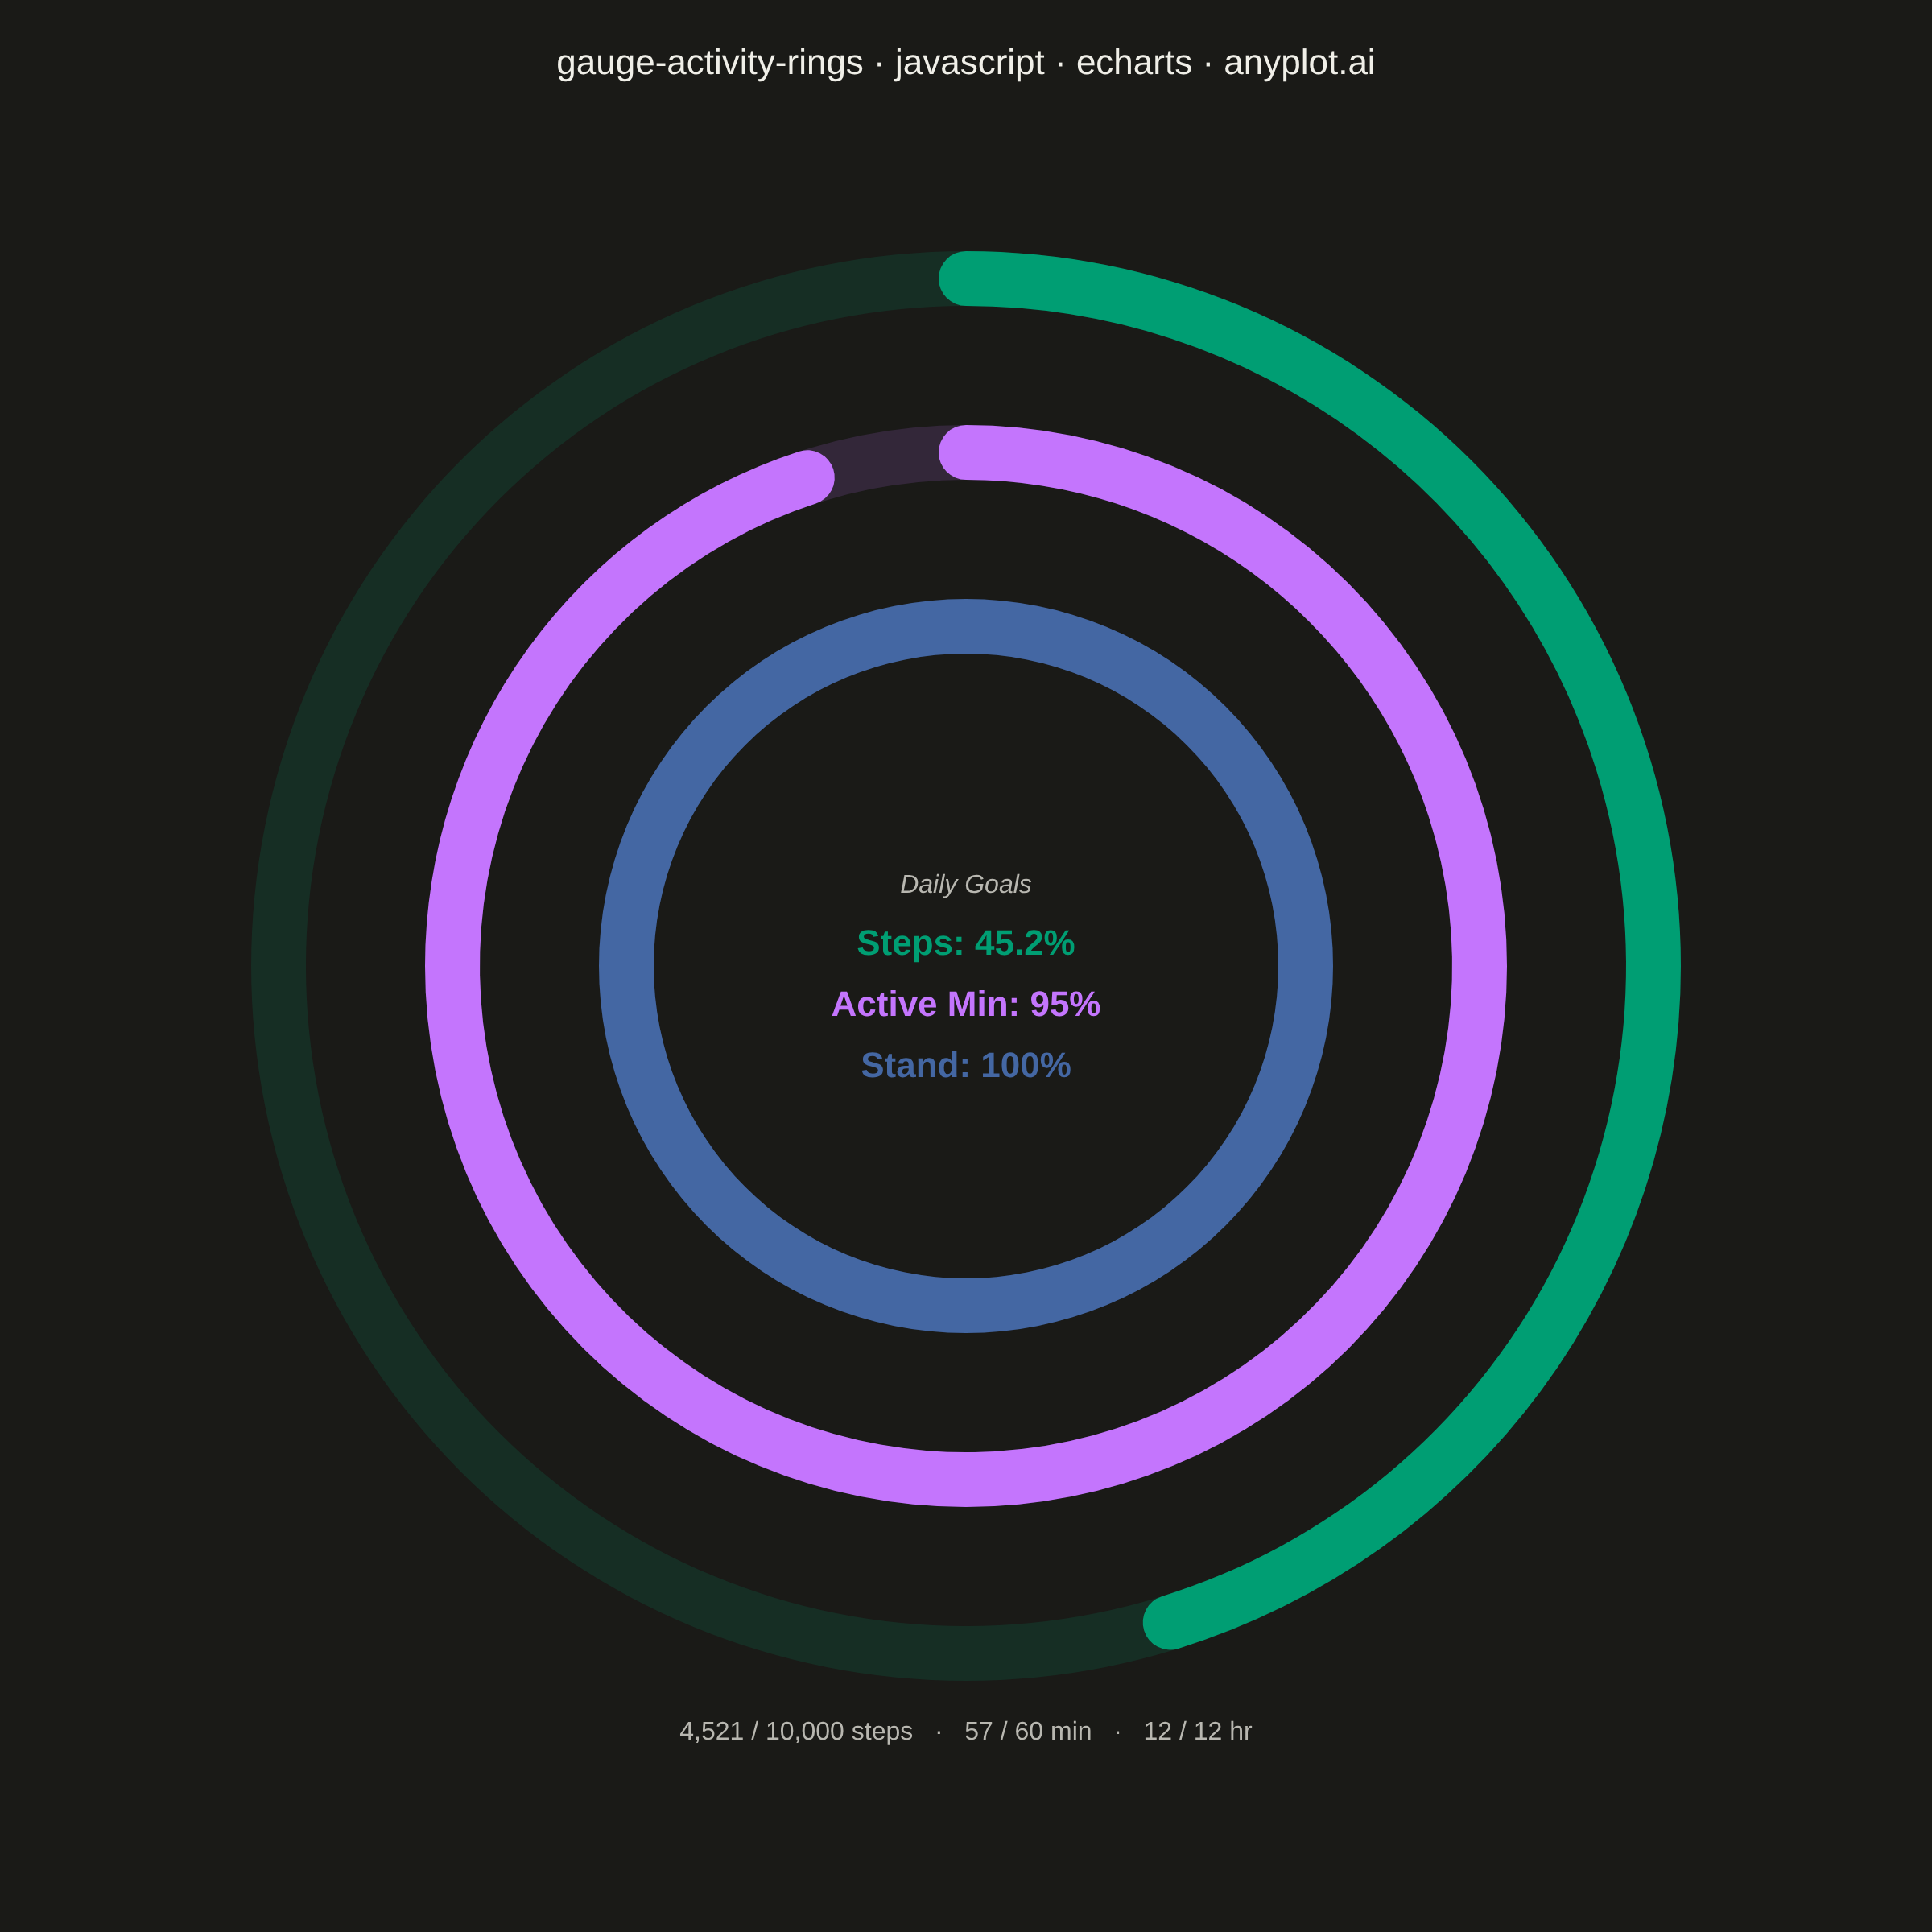
An activity rings chart displays goal completion for several metrics at once using concentric radial progress arcs, in the style popularized by fitness trackers. Each ring is a partial arc with rounded end caps that starts at the top (12 o'clock) and sweeps clockwise in proportion to how close the metric is to its goal, with a distinct color per metric and a faint background track showing the full circle. It is instantly recognizable and ideal for at-a-glance comparison of progress across a small set of related goals, filling the general radial-progress gap that needle gauges (`gauge-basic`) and polar bars (`polar-bar`) do not cover.
// anyplot.ai
// gauge-activity-rings: Activity Rings Progress Chart
// Library: echarts 5.5.1 | JavaScript 22.22.3
// Quality: 89/100 | Created: 2026-06-14
//# anyplot-orientation: square

const t = window.ANYPLOT_TOKENS;

// --- Data (daily fitness goals with spread completion levels) ---
const metrics = [
  { name: "Steps",      value: 4521, goal: 10000, display: "4,521 / 10,000 steps" },
  { name: "Active Min", value: 57,   goal: 60,    display: "57 / 60 min"           },
  { name: "Stand",      value: 12,   goal: 12,    display: "12 / 12 hr"            },
];
const colors = [t.palette[0], t.palette[1], t.palette[2]];

// Track colors: ring hue at ~15% opacity
const trackColors = [
  "rgba(0,158,115,0.15)",
  "rgba(196,117,253,0.15)",
  "rgba(68,103,163,0.15)",
];

// Percentage completion (clamped to 100)
const pcts = metrics.map(m =>
  parseFloat(Math.min(m.value / m.goal * 100, 100).toFixed(1))
);

// Ring geometry: outer → inner, larger radii to fill canvas vertically
// Outer ring bottom: 600 + 74%×600 = 1044px; gap to text row ~24px
const radii = ["74%", "56%", "38%"];
const ringW  = 34;  // CSS px (→ 68 physical px at DPR 2)

// --- Init ---
const chart = echarts.init(document.getElementById("container"));

// --- Option ---
chart.setOption({
  animation: false,
  backgroundColor: "transparent",

  title: {
    text: "gauge-activity-rings · javascript · echarts · anyplot.ai",
    left: "center",
    top: 24,
    textStyle: { color: t.ink, fontSize: 22, fontWeight: "normal" },
  },

  // Center labels + bottom values row (1200×1200 CSS mount, center at 600,600)
  // Inner ring inner radius: 38%×600 − 34 = 194px → center space spans y 406–794
  graphic: {
    elements: [
      // "Daily Goals" header
      {
        type: "text",
        style: {
          x: 600, y: 542,
          text: "Daily Goals",
          fill: t.inkSoft,
          fontSize: 16,
          textAlign: "center",
          fontStyle: "italic",
        },
      },
      // Per-ring: "Metric: XX.X%" in the ring's color
      ...metrics.map((m, i) => ({
        type: "text",
        style: {
          x: 600, y: 576 + i * 38,
          text: `${m.name}: ${pcts[i]}%`,
          fill: colors[i],
          fontSize: 22,
          fontWeight: "bold",
          textAlign: "center",
        },
      })),
      // Bottom row: raw values for each metric, just below outer ring
      {
        type: "text",
        style: {
          x: 600, y: 1068,
          text: metrics.map(m => m.display).join("   ·   "),
          fill: t.inkSoft,
          fontSize: 16,
          textAlign: "center",
        },
      },
    ],
  },

  series: metrics.map((m, i) => ({
    type: "gauge",
    startAngle: 90,
    endAngle: -270,   // full circle clockwise from top
    min: 0,
    max: 100,
    radius: radii[i],
    center: ["50%", "50%"],
    progress: {
      show: true,
      roundCap: true,
      width: ringW,
      itemStyle: { color: colors[i] },
    },
    axisLine: {
      roundCap: true,
      lineStyle: { width: ringW, color: [[1, trackColors[i]]] },
    },
    pointer:   { show: false },
    axisTick:  { show: false },
    splitLine: { show: false },
    axisLabel: { show: false },
    detail:    { show: false },
    title:     { show: false },
    data: [{ value: pcts[i] }],
  })),
});
Runnable source as JSON, for any HTTP client: https://api.anyplot.ai/specs/gauge-activity-rings/echarts/code. Any spec id and library id listed in llms-full.txt fit the same URL shape; every URL below is complete and callable.
{
  "spec_id": "gauge-activity-rings",
  "language": "javascript",
  "library": "echarts",
  "page": "https://anyplot.ai/gauge-activity-rings/javascript/echarts",
  "hub": "https://anyplot.ai/gauge-activity-rings",
  "code_json": "https://api.anyplot.ai/specs/gauge-activity-rings/echarts/code",
  "spec_json": "https://api.anyplot.ai/specs/gauge-activity-rings",
  "render_light_png": "https://storage.googleapis.com/anyplot-images/plots/gauge-activity-rings/javascript/echarts/plot-light.png",
  "render_dark_png": "https://storage.googleapis.com/anyplot-images/plots/gauge-activity-rings/javascript/echarts/plot-dark.png",
  "interactive_light_html": "https://storage.googleapis.com/anyplot-images/plots/gauge-activity-rings/javascript/echarts/plot-light.html",
  "interactive_dark_html": "https://storage.googleapis.com/anyplot-images/plots/gauge-activity-rings/javascript/echarts/plot-dark.html",
  "quality_score": 89.0,
  "license": "MIT",
  "guide": "https://anyplot.ai/llms.txt"
}
Part of Activity Rings Progress Chart on anyplot.ai.