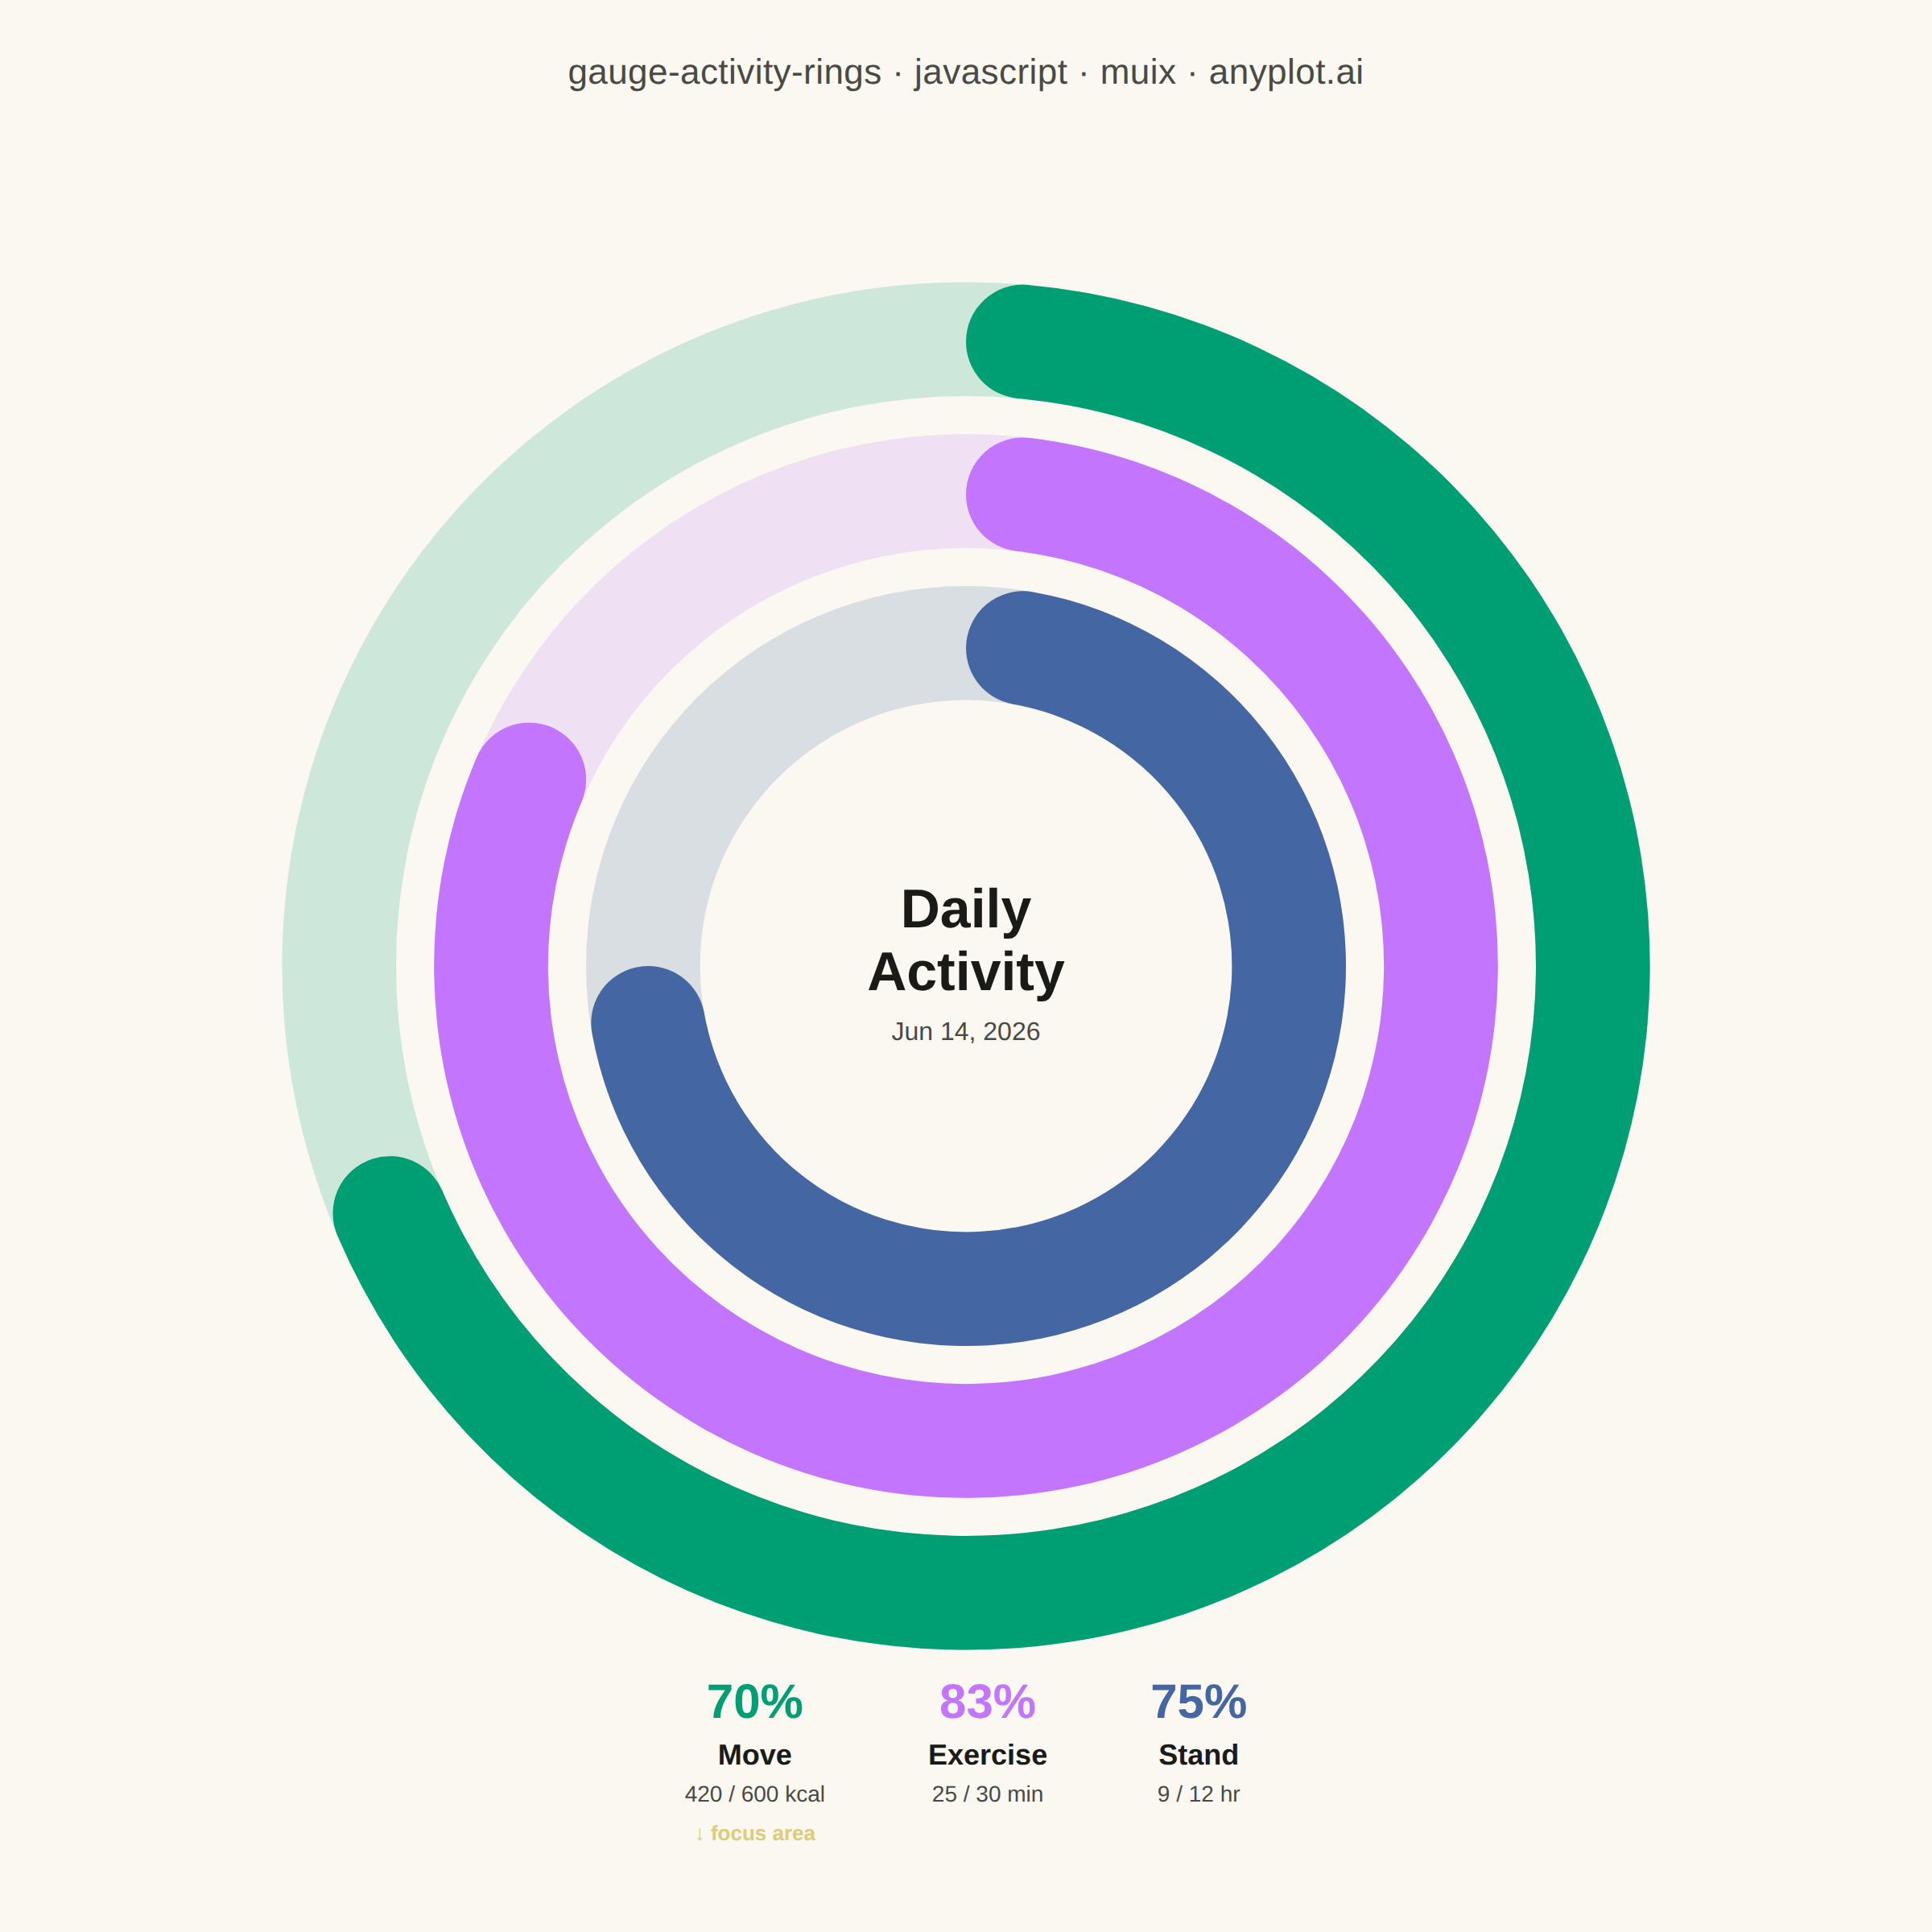
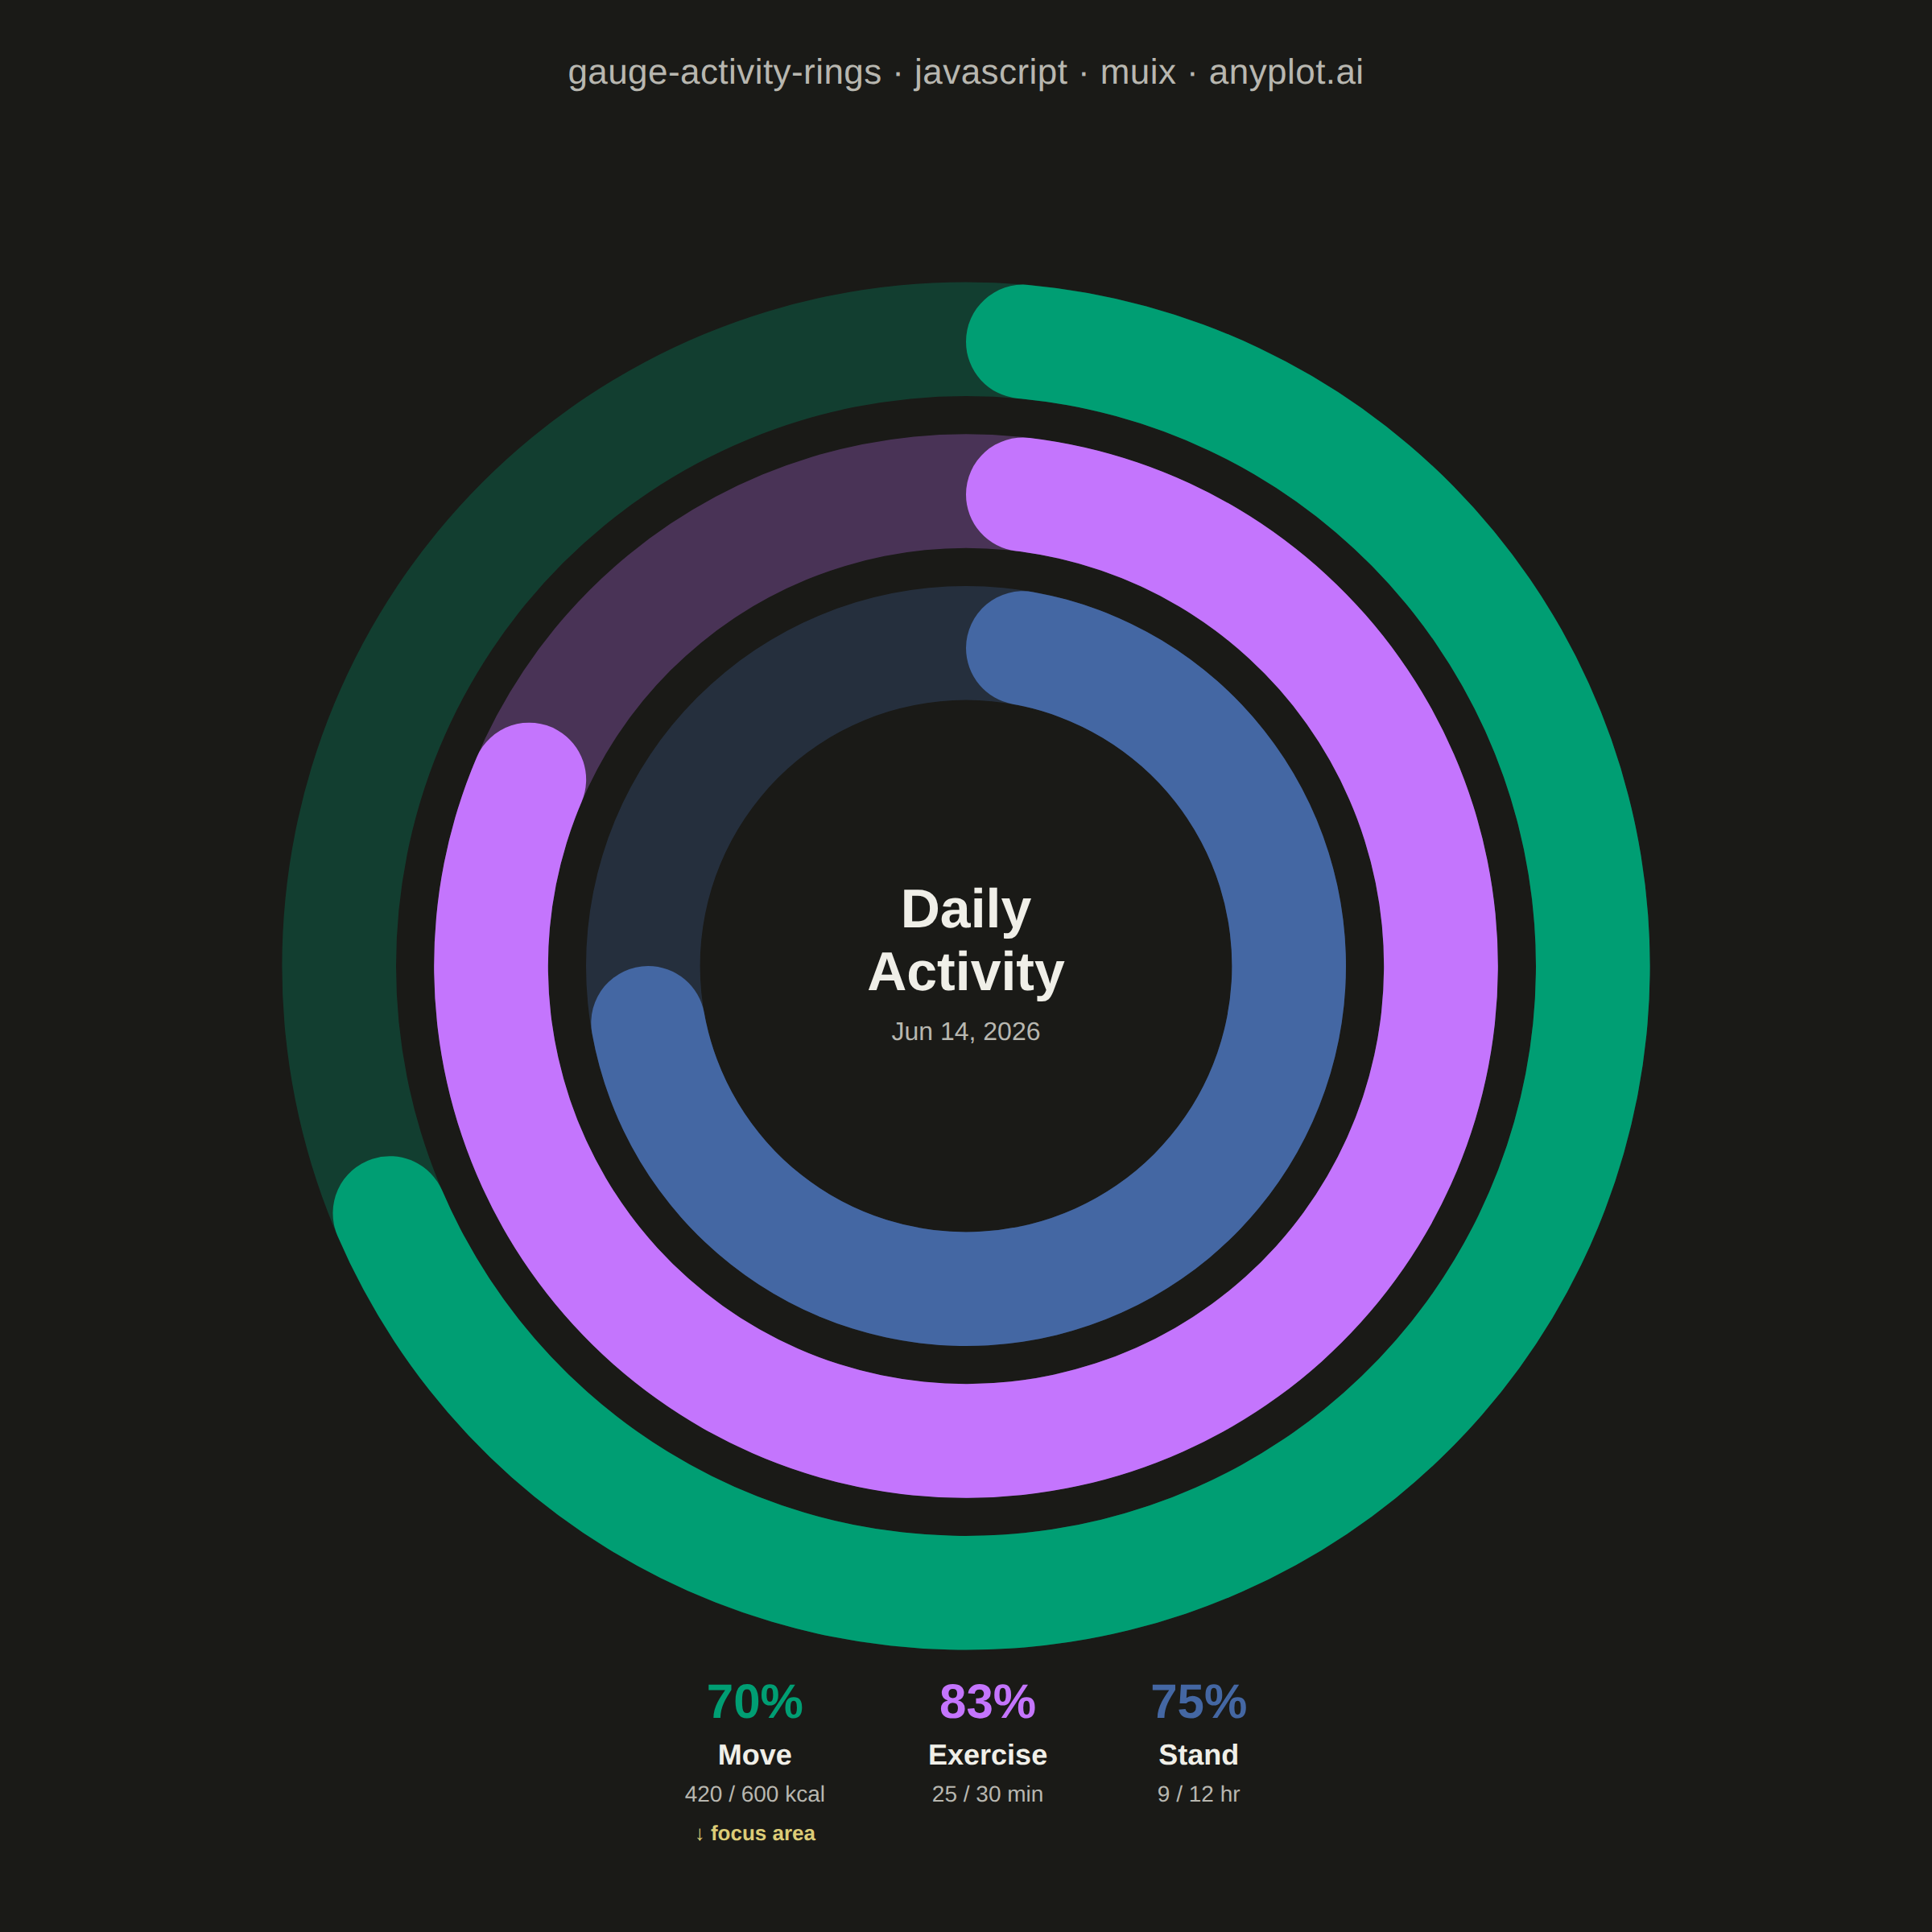
An activity rings chart displays goal completion for several metrics at once using concentric radial progress arcs, in the style popularized by fitness trackers. Each ring is a partial arc with rounded end caps that starts at the top (12 o'clock) and sweeps clockwise in proportion to how close the metric is to its goal, with a distinct color per metric and a faint background track showing the full circle. It is instantly recognizable and ideal for at-a-glance comparison of progress across a small set of related goals, filling the general radial-progress gap that needle gauges (`gauge-basic`) and polar bars (`polar-bar`) do not cover.
// anyplot.ai
// gauge-activity-rings: Activity Rings Progress Chart
// Library: muix 7.29.1 | JavaScript 22.22.3
// Quality: 89/100 | Created: 2026-06-14
//# anyplot-orientation: square
// anyplot.ai
// gauge-activity-rings: Activity Rings Progress Chart
// Library: MUI X Charts | React | Node 22
// License: @mui/x-charts — MIT (community). Pro/Premium are out of scope.
// Quality: pending | Created: 2026-06-14

import {
  GaugeContainer,
  GaugeValueArc,
  GaugeReferenceArc,
} from "@mui/x-charts/Gauge";
import Box from "@mui/material/Box";
import Typography from "@mui/material/Typography";

const t = window.ANYPLOT_TOKENS;
const W = window.ANYPLOT_SIZE.width;  // 1200 CSS px (square mount)
const H = window.ANYPLOT_SIZE.height; // 1200 CSS px

// Higher opacity in dark mode so tracks remain visible against near-black
const trackOpacity = window.ANYPLOT_THEME === "dark" ? 0.28 : 0.18;

// Daily fitness activity — Move / Exercise / Stand rings (spec example data)
const rings = [
  { label: "Move",     value: 420, goal: 600, unit: "kcal", color: t.palette[0] },
  { label: "Exercise", value: 25,  goal: 30,  unit: "min",  color: t.palette[1] },
  { label: "Stand",    value: 9,   goal: 12,  unit: "hr",   color: t.palette[2] },
];

// Concentric radii as % of maxRadius (≈ min(W,H)/2 = 600 px for full-circle gauge)
// Outer → inner: 12% wide rings, 4% gaps between them
const RING_RADII = [
  { inner: "60%", outer: "72%" }, // outer  (Move)
  { inner: "44%", outer: "56%" }, // middle (Exercise)
  { inner: "28%", outer: "40%" }, // inner  (Stand)
];

// Identify the lagging ring (lowest percentage) for visual emphasis
const ringPcts = rings.map((r) => Math.round((r.value / r.goal) * 100));
const laggingIndex = ringPcts.indexOf(Math.min(...ringPcts));

export default function Chart() {
  return (
    <Box sx={{ position: "relative", width: W, height: H, bgcolor: t.pageBg }}>
      {/* Three concentric gauge rings stacked via absolute positioning */}
      {rings.map((ring, i) => {
        const pct = Math.min((ring.value / ring.goal) * 100, 100);
        return (
          <Box key={ring.label} sx={{ position: "absolute", inset: 0 }}>
            <GaugeContainer
              width={W}
              height={H}
              value={pct}
              valueMin={0}
              valueMax={100}
              startAngle={0}
              endAngle={360}
              innerRadius={RING_RADII[i].inner}
              outerRadius={RING_RADII[i].outer}
              cornerRadius="50%"
              skipAnimation
            >
              {/* Full-circle background track */}
              <GaugeReferenceArc style={{ fill: ring.color, opacity: trackOpacity }} />
              {/* Colored progress arc */}
              <GaugeValueArc style={{ fill: ring.color }} />
            </GaugeContainer>
          </Box>
        );
      })}

      {/* Title */}
      <Box
        sx={{
          position: "absolute",
          top: 28,
          left: 0,
          right: 0,
          textAlign: "center",
          pointerEvents: "none",
        }}
      >
        <Typography
          sx={{ color: t.inkSoft, fontSize: 22, fontWeight: 400, letterSpacing: "0.01em" }}
        >
          gauge-activity-rings · javascript · muix · anyplot.ai
        </Typography>
      </Box>

      {/* Center label — sits inside the innermost ring (< 28% radius = 168 px) */}
      <Box
        sx={{
          position: "absolute",
          top: "50%",
          left: "50%",
          transform: "translate(-50%, -50%)",
          textAlign: "center",
          pointerEvents: "none",
        }}
      >
        <Typography
          sx={{ color: t.ink, fontSize: 34, fontWeight: 700, lineHeight: 1.15 }}
        >
          Daily
        </Typography>
        <Typography
          sx={{ color: t.ink, fontSize: 34, fontWeight: 700, lineHeight: 1.15 }}
        >
          Activity
        </Typography>
        <Typography sx={{ color: t.inkSoft, fontSize: 16, mt: 0.75 }}>
          Jun 14, 2026
        </Typography>
      </Box>

      {/* Bottom legend: percentage + name + value/goal */}
      <Box
        sx={{
          position: "absolute",
          bottom: 52,
          left: 0,
          right: 0,
          display: "flex",
          justifyContent: "center",
          gap: "64px",
          pointerEvents: "none",
        }}
      >
        {rings.map((ring, i) => {
          const pct = ringPcts[i];
          const isLagging = i === laggingIndex;
          return (
            <Box key={ring.label} sx={{ textAlign: "center" }}>
              <Typography
                sx={{ color: ring.color, fontSize: 30, fontWeight: 800, lineHeight: 1 }}
              >
                {pct}%
              </Typography>
              <Typography
                sx={{ color: t.ink, fontSize: 18, fontWeight: 600, mt: 0.5 }}
              >
                {ring.label}
              </Typography>
              <Typography sx={{ color: t.inkSoft, fontSize: 14 }}>
                {ring.value} / {ring.goal} {ring.unit}
              </Typography>
              {isLagging && (
                <Typography sx={{ color: t.amber, fontSize: 13, fontWeight: 700, mt: 0.5 }}>
                  ↓ focus area
                </Typography>
              )}
            </Box>
          );
        })}
      </Box>
    </Box>
  );
}
Runnable source as JSON, for any HTTP client: https://api.anyplot.ai/specs/gauge-activity-rings/muix/code. Any spec id and library id listed in llms-full.txt fit the same URL shape; every URL below is complete and callable.
{
  "spec_id": "gauge-activity-rings",
  "language": "javascript",
  "library": "muix",
  "page": "https://anyplot.ai/gauge-activity-rings/javascript/muix",
  "hub": "https://anyplot.ai/gauge-activity-rings",
  "code_json": "https://api.anyplot.ai/specs/gauge-activity-rings/muix/code",
  "spec_json": "https://api.anyplot.ai/specs/gauge-activity-rings",
  "render_light_png": "https://storage.googleapis.com/anyplot-images/plots/gauge-activity-rings/javascript/muix/plot-light.png",
  "render_dark_png": "https://storage.googleapis.com/anyplot-images/plots/gauge-activity-rings/javascript/muix/plot-dark.png",
  "interactive_light_html": "https://storage.googleapis.com/anyplot-images/plots/gauge-activity-rings/javascript/muix/plot-light.html",
  "interactive_dark_html": "https://storage.googleapis.com/anyplot-images/plots/gauge-activity-rings/javascript/muix/plot-dark.html",
  "quality_score": 89.0,
  "license": "MIT",
  "guide": "https://anyplot.ai/llms.txt"
}
Part of Activity Rings Progress Chart on anyplot.ai.