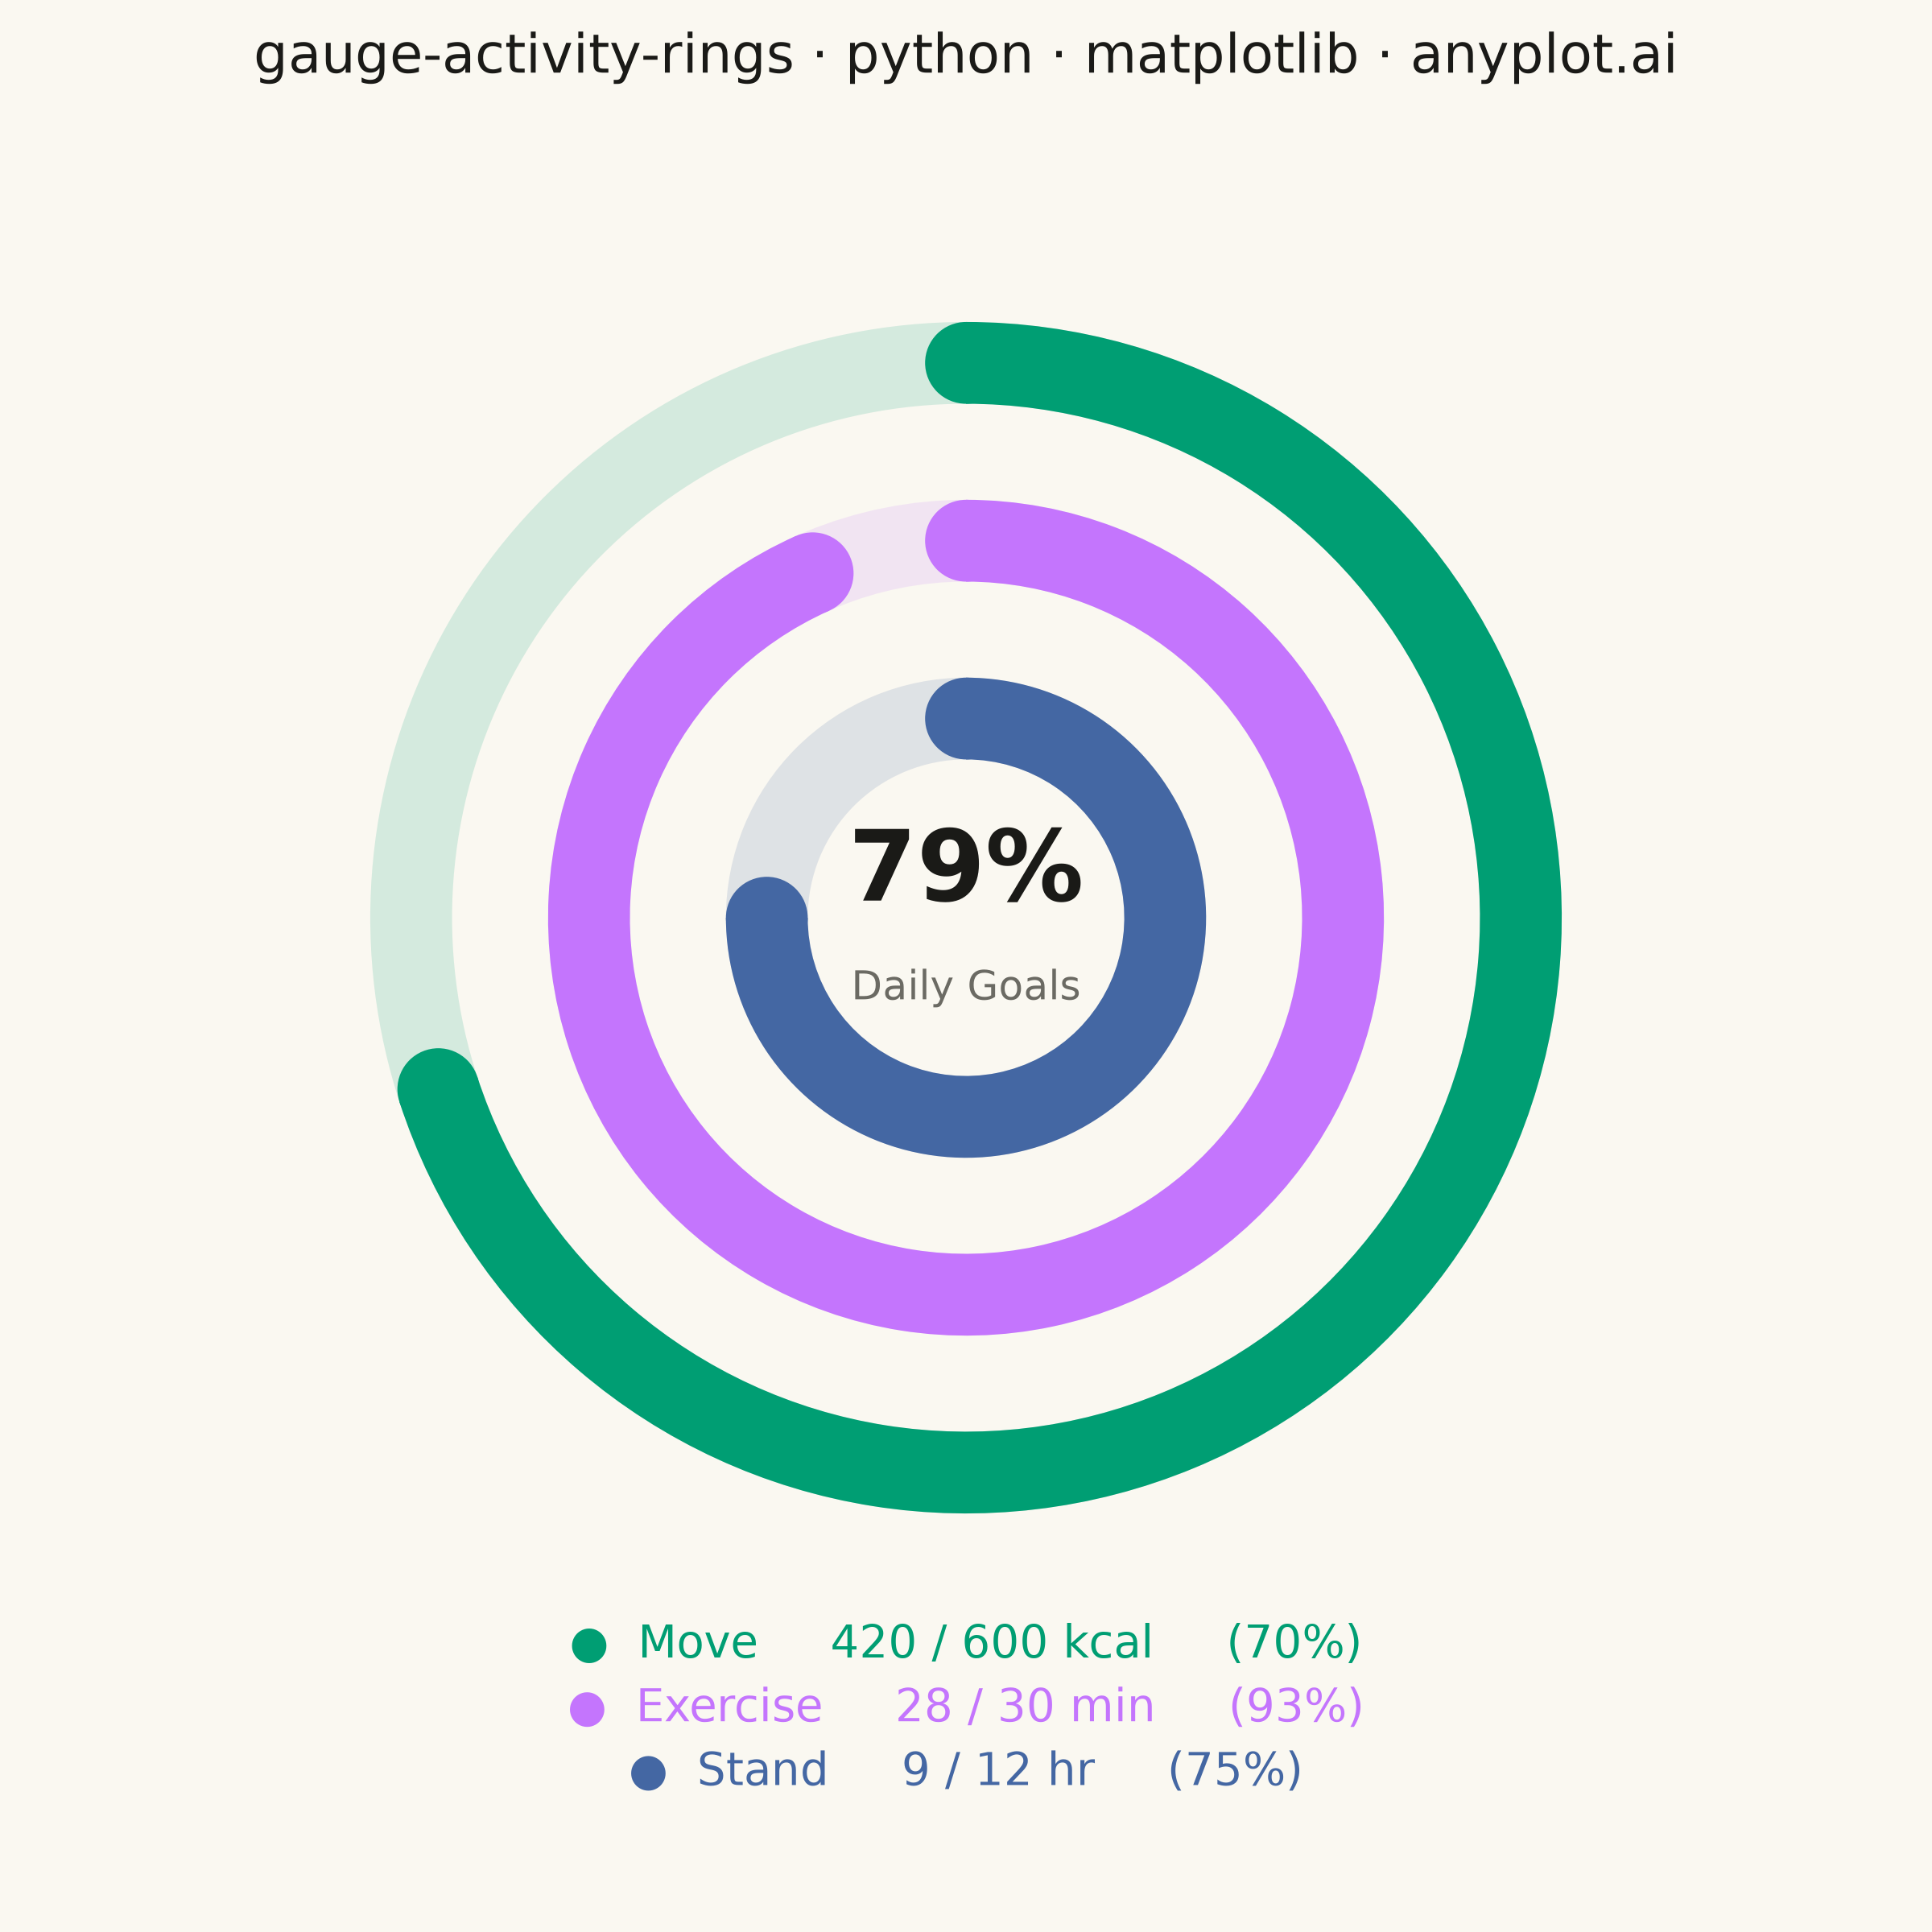
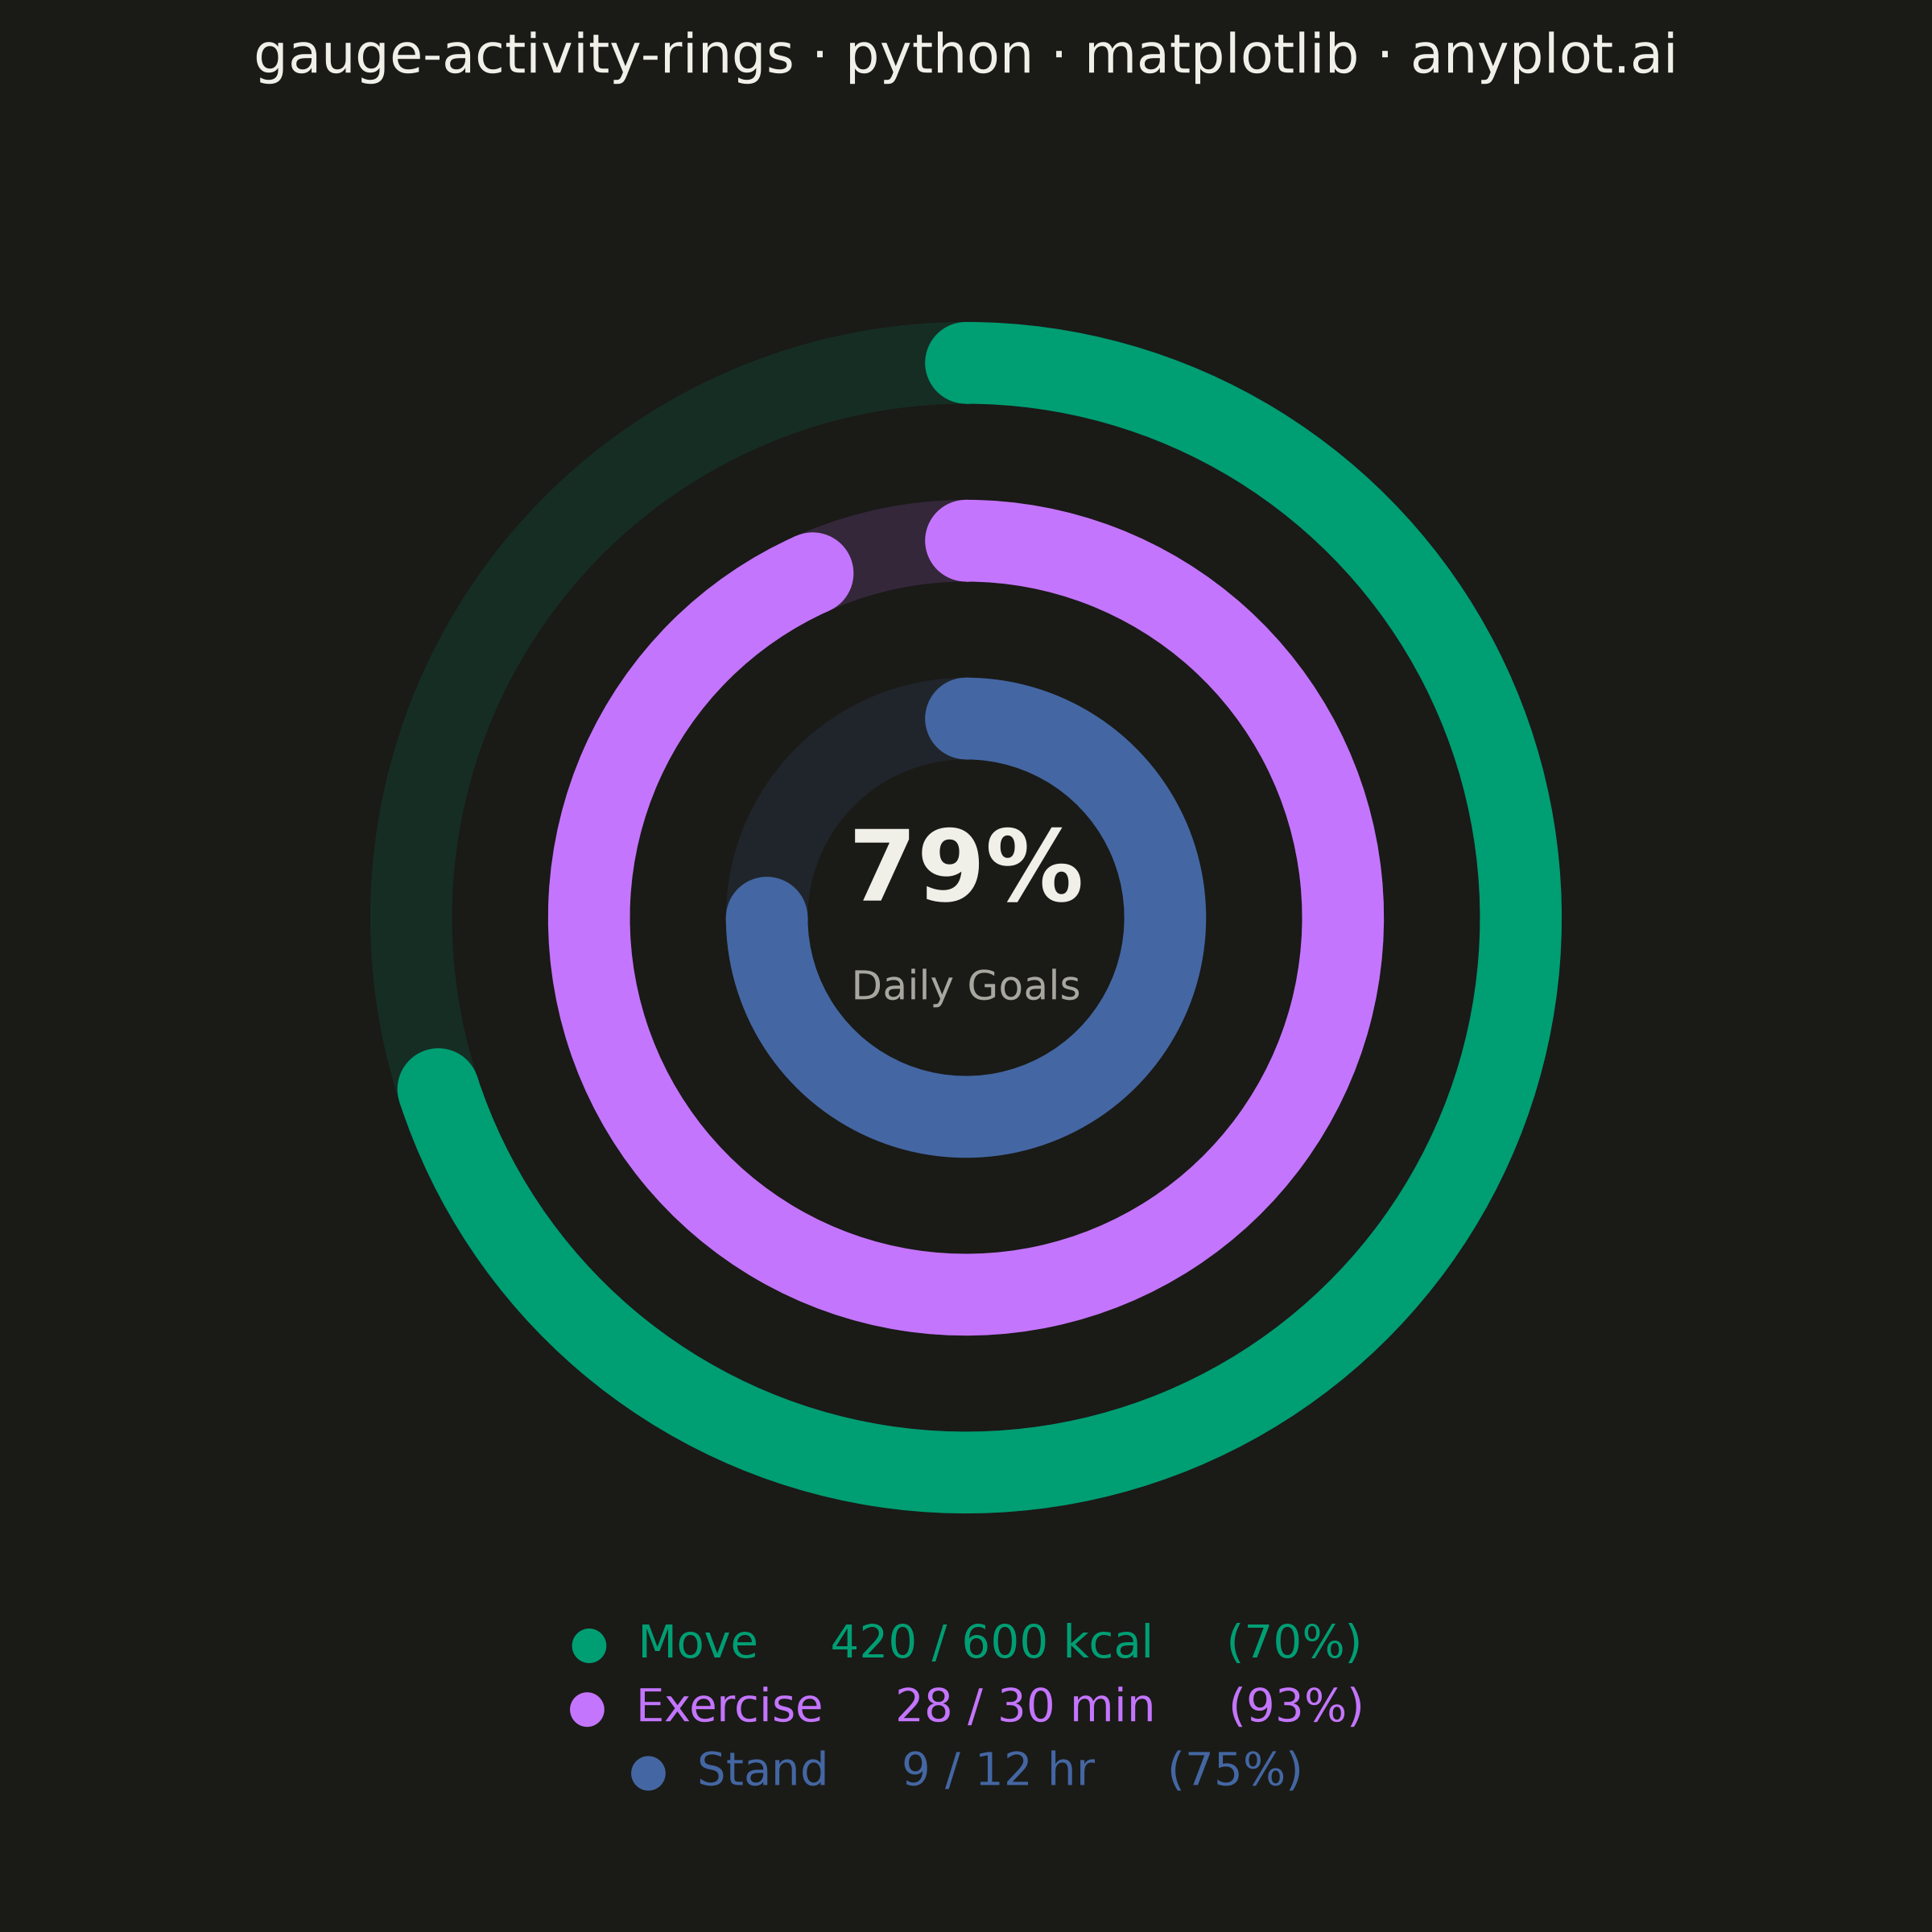
An activity rings chart displays goal completion for several metrics at once using concentric radial progress arcs, in the style popularized by fitness trackers. Each ring is a partial arc with rounded end caps that starts at the top (12 o'clock) and sweeps clockwise in proportion to how close the metric is to its goal, with a distinct color per metric and a faint background track showing the full circle. It is instantly recognizable and ideal for at-a-glance comparison of progress across a small set of related goals, filling the general radial-progress gap that needle gauges (`gauge-basic`) and polar bars (`polar-bar`) do not cover.
""" anyplot.ai
gauge-activity-rings: Activity Rings Progress Chart
Library: matplotlib 3.11.0 | Python 3.13.13
Quality: 87/100 | Created: 2026-06-14
"""

import os

import matplotlib.pyplot as plt
import numpy as np
from matplotlib.patches import Circle, Wedge


# Theme tokens (Imprint palette + chrome)
THEME = os.getenv("ANYPLOT_THEME", "light")
PAGE_BG = "#FAF8F1" if THEME == "light" else "#1A1A17"
INK = "#1A1A17" if THEME == "light" else "#F0EFE8"
INK_MUTED = "#6B6A63" if THEME == "light" else "#A8A79F"

IMPRINT_PALETTE = ["#009E73", "#C475FD", "#4467A3", "#BD8233", "#AE3030", "#2ABCCD", "#954477", "#99B314"]

# Daily fitness goal data — Move / Exercise / Stand
metrics = [
    {"name": "Move", "value": 420, "goal": 600, "unit": "kcal"},
    {"name": "Exercise", "value": 28, "goal": 30, "unit": "min"},
    {"name": "Stand", "value": 9, "goal": 12, "unit": "hr"},
]
ring_colors = IMPRINT_PALETTE[:3]  # green → lavender → blue
radii = [0.78, 0.53, 0.28]  # outer → inner (mid-radius of each ring)
RING_WIDTH = 0.115  # ring thickness in data units (~linewidth 20pt equivalent)

fractions = [min(m["value"] / m["goal"], 1.0) for m in metrics]
avg_pct = sum(fractions) / len(fractions)

# Plot — square canvas for circular rings
fig, ax = plt.subplots(figsize=(6, 6), dpi=400, facecolor=PAGE_BG)
ax.set_facecolor(PAGE_BG)
ax.set_aspect("equal")
ax.set_xlim(-1.1, 1.1)
ax.set_ylim(-1.1, 1.1)
ax.axis("off")

for _metric, color, r, frac in zip(metrics, ring_colors, radii, fractions, strict=False):
    outer_r = r + RING_WIDTH / 2

    # Background track — full Wedge ring at low opacity
    ax.add_patch(
        Wedge((0, 0), outer_r, 0, 360, width=RING_WIDTH, facecolor=color, edgecolor="none", alpha=0.15, zorder=2)
    )

    if frac > 0:
        # Progress arc — Wedge sweeping clockwise from 90° (12 o'clock)
        # Wedge uses CCW angles from positive x-axis; clockwise sweep maps to theta2=90, theta1=90-frac*360
        theta1_deg = 90 - frac * 360
        ax.add_patch(
            Wedge((0, 0), outer_r, theta1_deg, 90, width=RING_WIDTH, facecolor=color, edgecolor="none", zorder=3)
        )

        # Rounded caps — half-circle at each endpoint of the progress arc
        cap_r = RING_WIDTH / 2
        # Start cap at 12 o'clock
        ax.add_patch(Circle((0.0, r), cap_r, facecolor=color, edgecolor="none", zorder=4))
        # End cap at arc terminus
        theta_end = np.radians(theta1_deg)
        ax.add_patch(
            Circle((r * np.cos(theta_end), r * np.sin(theta_end)), cap_r, facecolor=color, edgecolor="none", zorder=4)
        )

# Center summary — overall average progress
ax.text(0, 0.06, f"{avg_pct:.0%}", ha="center", va="center", fontsize=22, fontweight="bold", color=INK, zorder=5)
ax.text(0, -0.10, "Daily Goals", ha="center", va="center", fontsize=9, color=INK_MUTED, zorder=5)

# Title
title = "gauge-activity-rings · python · matplotlib · anyplot.ai"
n = len(title)
title_fs = max(8, round(12 * 67 / n)) if n > 67 else 12
ax.set_title(title, fontsize=title_fs, fontweight="medium", color=INK, pad=14)

# Per-ring metric labels below the chart (figure coordinates) — tightened gap
fig.subplots_adjust(left=0.05, right=0.95, top=0.93, bottom=0.12)
label_ys = [0.160, 0.127, 0.094]

for i, (metric, color, frac) in enumerate(zip(metrics, ring_colors, fractions, strict=False)):
    pct = f"{frac:.0%}"
    label = f"●  {metric['name']}     {metric['value']} / {metric['goal']} {metric['unit']}     ({pct})"
    fig.text(0.50, label_ys[i], label, ha="center", va="top", fontsize=10, color=color)

plt.savefig(f"plot-{THEME}.png", dpi=400, facecolor=PAGE_BG)
plt.close()
Runnable source as JSON, for any HTTP client: https://api.anyplot.ai/specs/gauge-activity-rings/matplotlib/code. Any spec id and library id listed in llms-full.txt fit the same URL shape; every URL below is complete and callable.
{
  "spec_id": "gauge-activity-rings",
  "language": "python",
  "library": "matplotlib",
  "page": "https://anyplot.ai/gauge-activity-rings/python/matplotlib",
  "hub": "https://anyplot.ai/gauge-activity-rings",
  "code_json": "https://api.anyplot.ai/specs/gauge-activity-rings/matplotlib/code",
  "spec_json": "https://api.anyplot.ai/specs/gauge-activity-rings",
  "render_light_png": "https://storage.googleapis.com/anyplot-images/plots/gauge-activity-rings/python/matplotlib/plot-light.png",
  "render_dark_png": "https://storage.googleapis.com/anyplot-images/plots/gauge-activity-rings/python/matplotlib/plot-dark.png",
  "quality_score": 87.0,
  "license": "MIT",
  "guide": "https://anyplot.ai/llms.txt"
}
Part of Activity Rings Progress Chart on anyplot.ai.