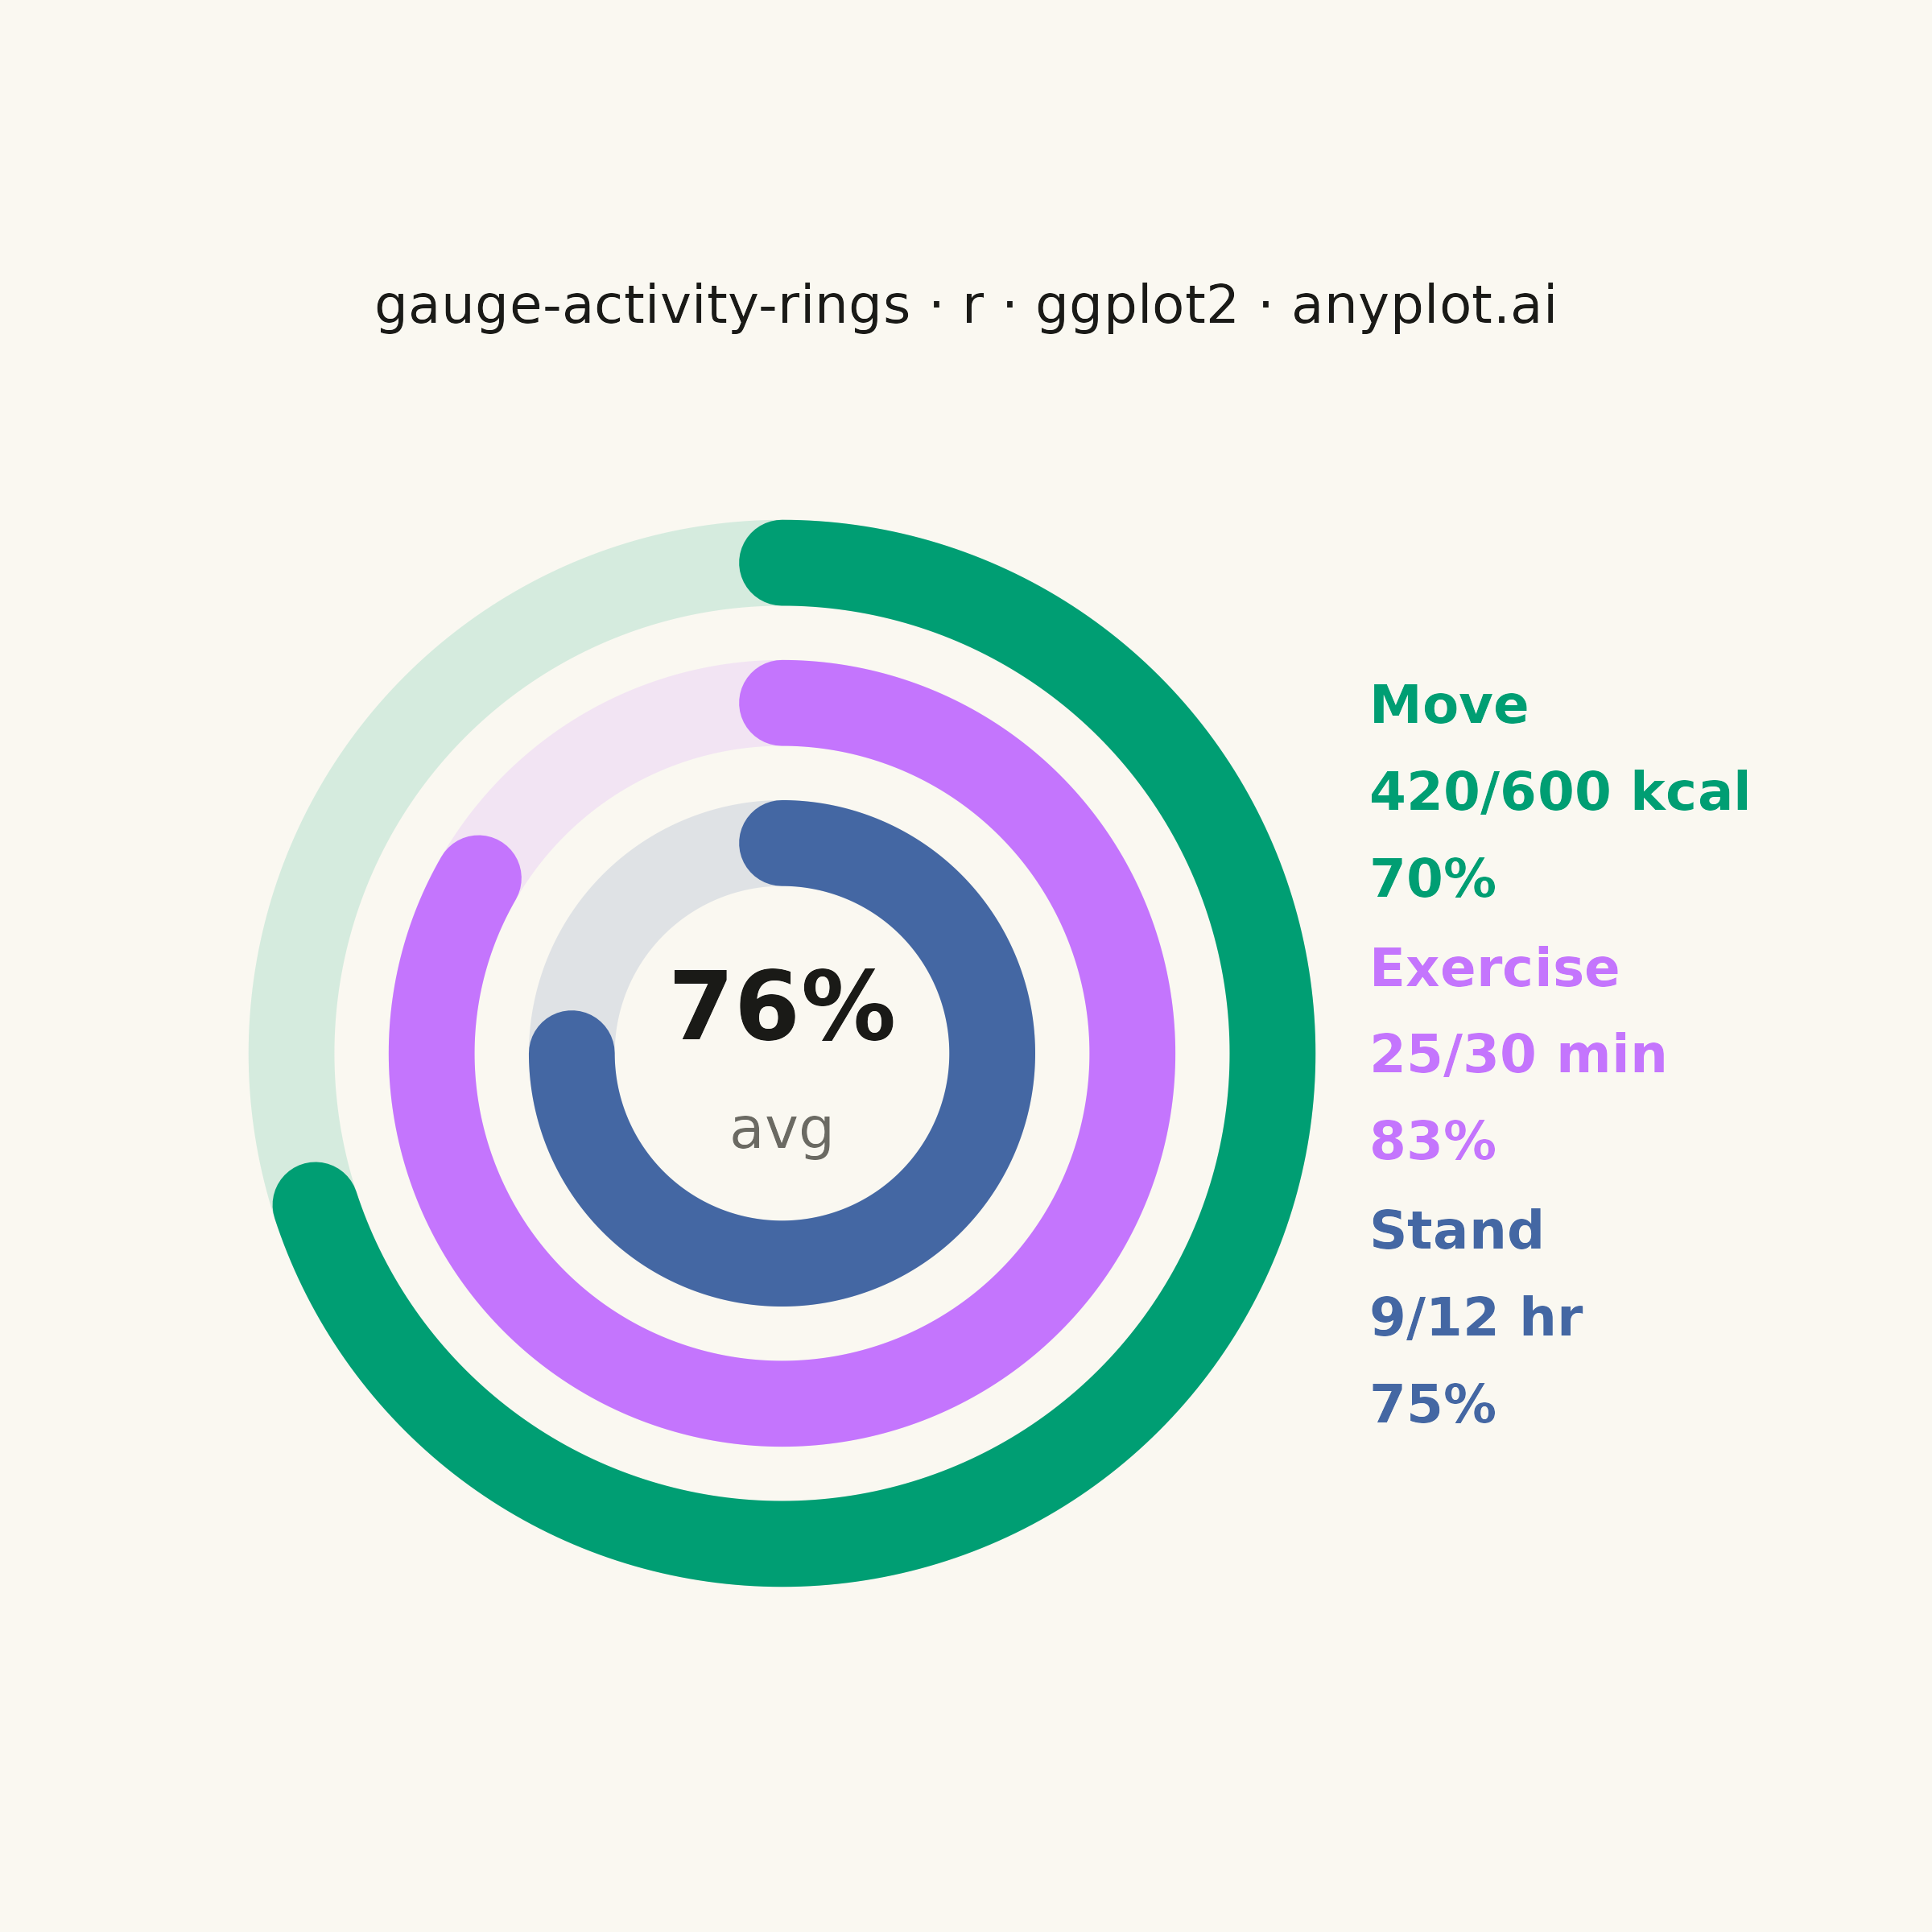
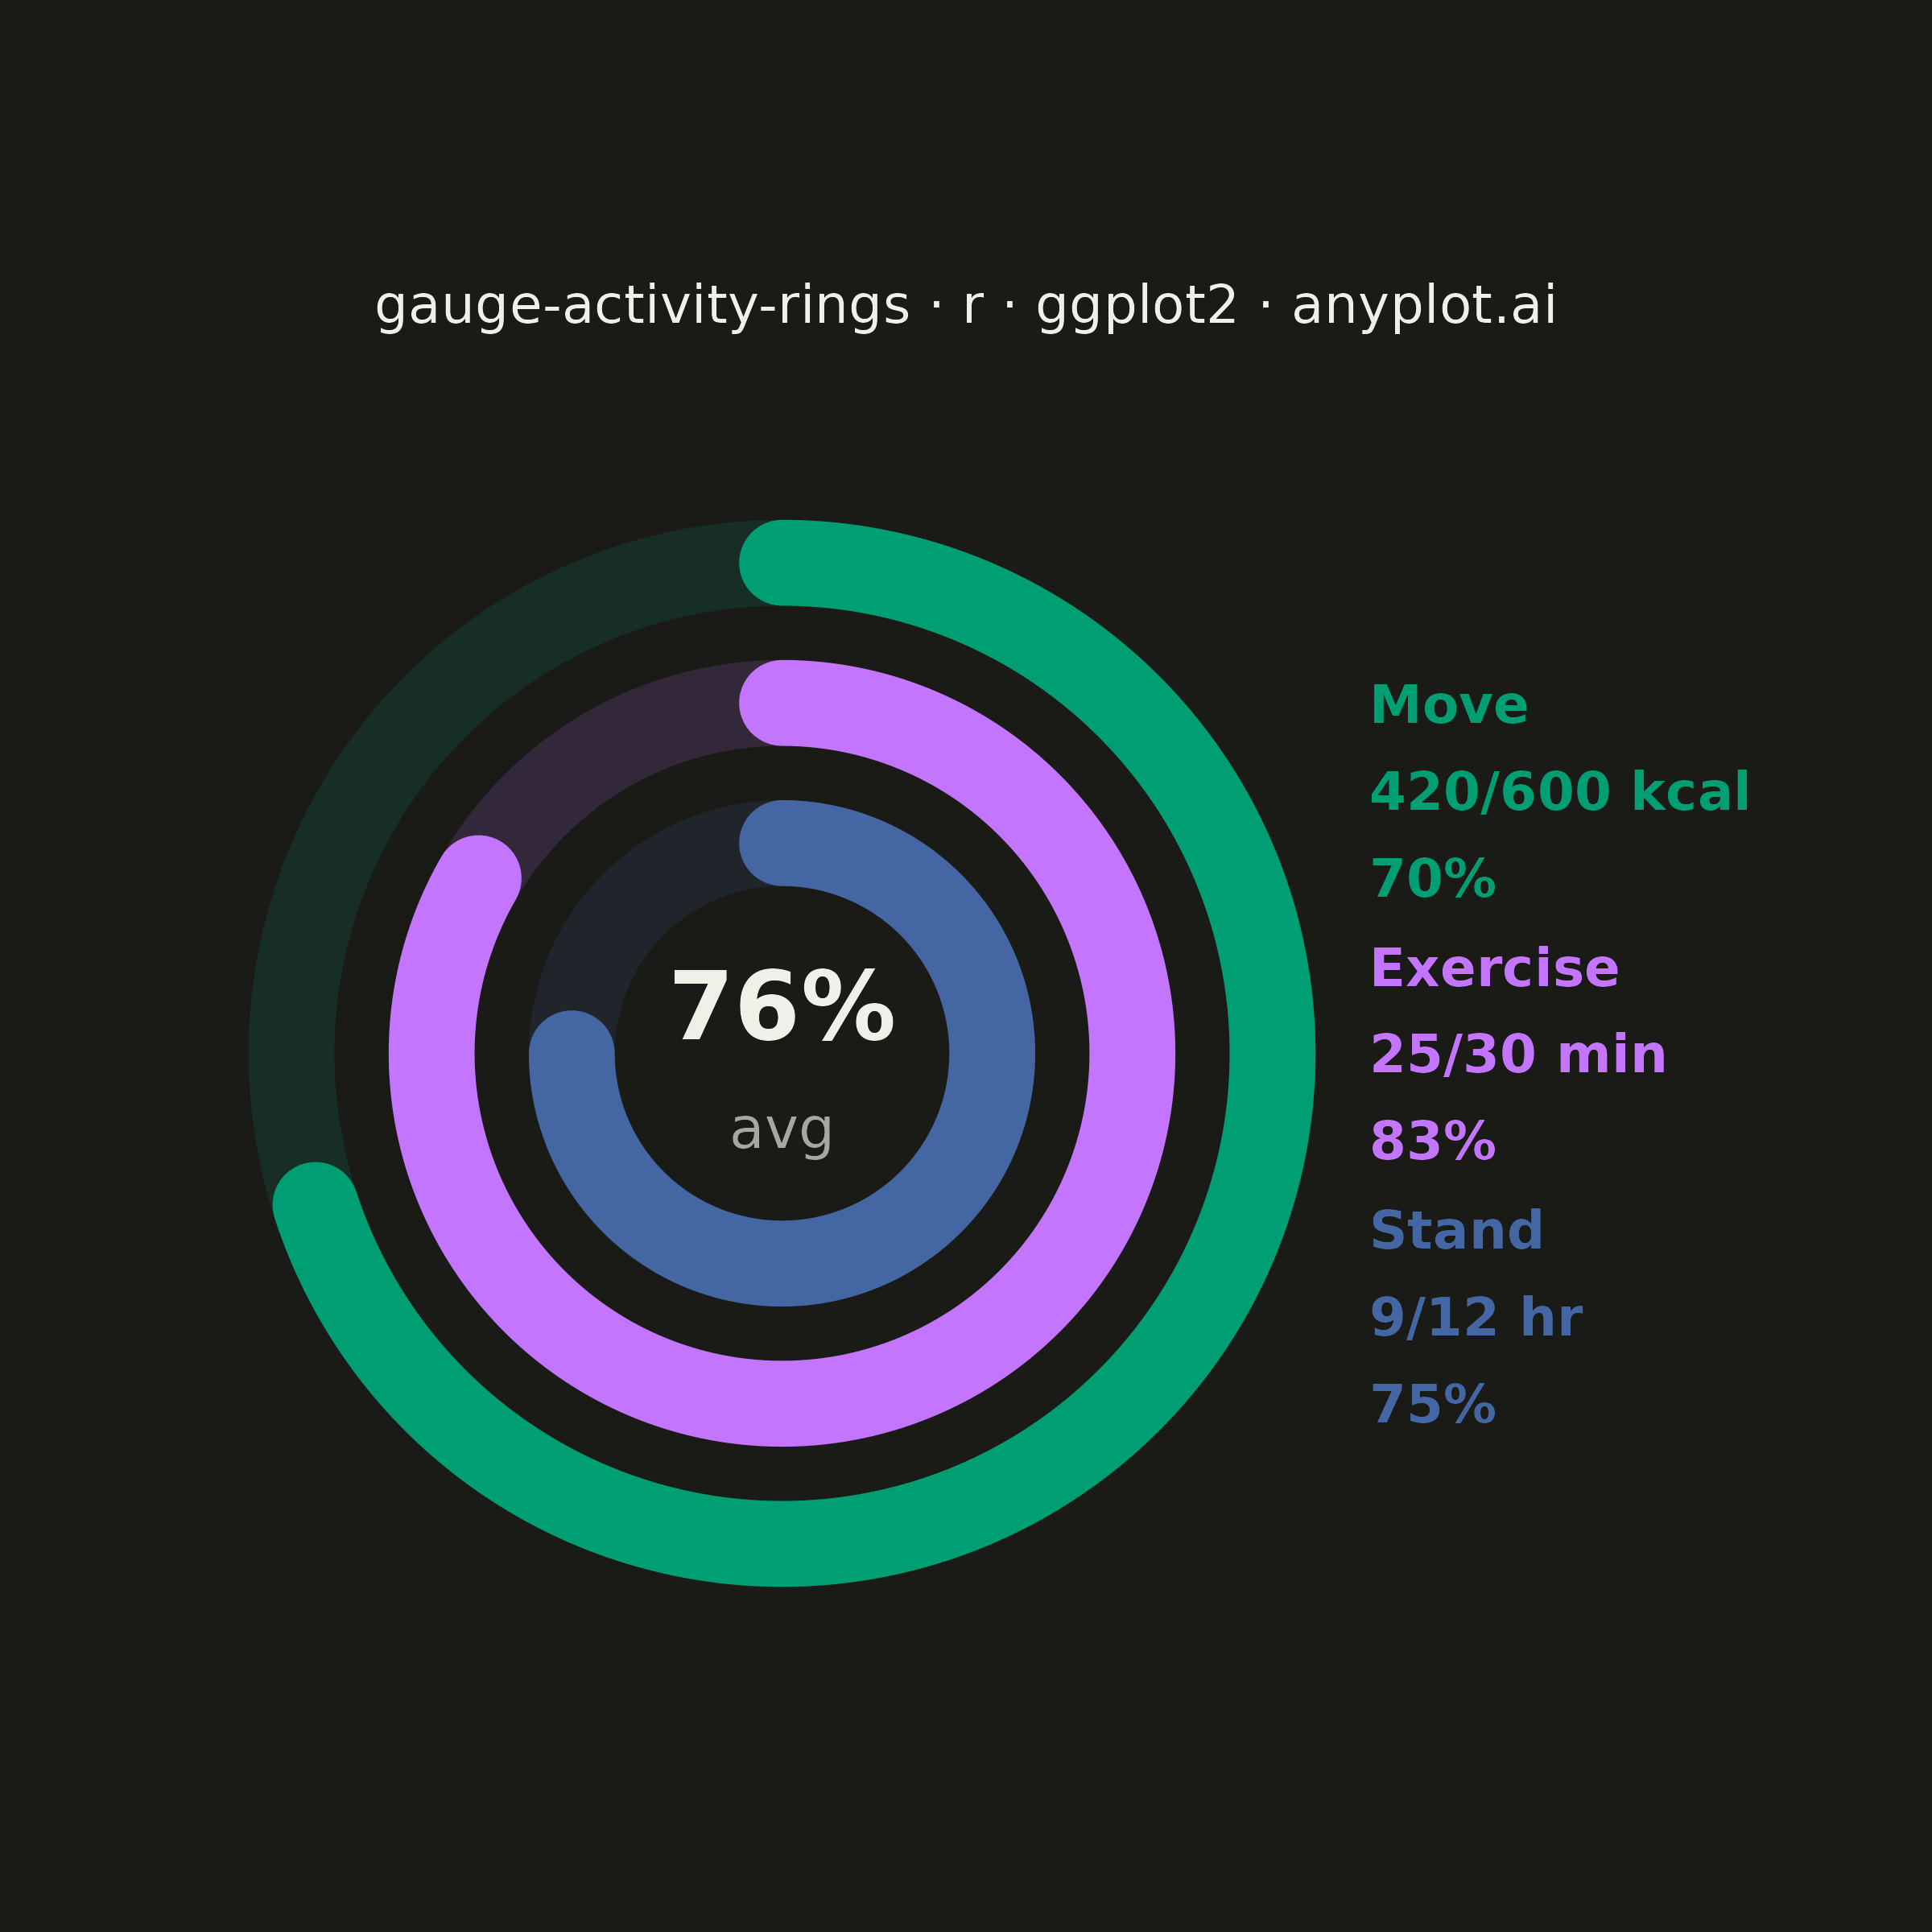
An activity rings chart displays goal completion for several metrics at once using concentric radial progress arcs, in the style popularized by fitness trackers. Each ring is a partial arc with rounded end caps that starts at the top (12 o'clock) and sweeps clockwise in proportion to how close the metric is to its goal, with a distinct color per metric and a faint background track showing the full circle. It is instantly recognizable and ideal for at-a-glance comparison of progress across a small set of related goals, filling the general radial-progress gap that needle gauges (`gauge-basic`) and polar bars (`polar-bar`) do not cover.
#' anyplot.ai
#' gauge-activity-rings: Activity Rings Progress Chart
#' Library: ggplot2 3.5.1 | R 4.4.1
#' Quality: 88/100 | Created: 2026-06-14

library(ggplot2)
library(ragg)

# Theme tokens
THEME       <- Sys.getenv("ANYPLOT_THEME", "light")
PAGE_BG     <- if (THEME == "light") "#FAF8F1" else "#1A1A17"
ELEVATED_BG <- if (THEME == "light") "#FFFDF6" else "#242420"
INK         <- if (THEME == "light") "#1A1A17" else "#F0EFE8"
INK_SOFT    <- if (THEME == "light") "#4A4A44" else "#B8B7B0"
INK_MUTED   <- if (THEME == "light") "#6B6A63" else "#A8A79F"

# Imprint palette — first 3 positions for 3 rings
IMPRINT_PALETTE <- c("#009E73", "#C475FD", "#4467A3")

# Data — daily fitness tracker goals
rings <- data.frame(
  metric = c("Move", "Exercise", "Stand"),
  value  = c(420, 25, 9),
  goal   = c(600, 30, 12),
  unit   = c("kcal", "min", "hr"),
  radius = c(2.8, 2.0, 1.2),
  color  = IMPRINT_PALETTE,
  stringsAsFactors = FALSE
)
rings$fraction <- pmin(rings$value / rings$goal, 1.0)

# Arc path helpers — clockwise from top (π/2)
n_pts <- 360

make_track <- function(r) {
  a <- seq(pi / 2, pi / 2 - 2 * pi, length.out = n_pts + 1)
  data.frame(x = r * cos(a), y = r * sin(a))
}

make_arc <- function(r, frac) {
  n <- max(3, round(n_pts * frac) + 1)
  a <- seq(pi / 2, pi / 2 - frac * 2 * pi, length.out = n)
  data.frame(x = r * cos(a), y = r * sin(a))
}

# Build track (full-circle) and arc data frames
track_df <- do.call(rbind, lapply(seq_len(nrow(rings)), function(i) {
  d       <- make_track(rings$radius[i])
  d$group <- rings$metric[i]
  d$color <- rings$color[i]
  d
}))

arc_df <- do.call(rbind, lapply(seq_len(nrow(rings)), function(i) {
  d       <- make_arc(rings$radius[i], rings$fraction[i])
  d$group <- rings$metric[i]
  d$color <- rings$color[i]
  d
}))

# Label block — right side of rings, one group per metric
label_df <- data.frame(
  lx    = 3.35,
  ly    = c(1.5, 0.0, -1.5),
  label = paste0(
    rings$metric, "\n",
    rings$value, "/", rings$goal, " ", rings$unit, "\n",
    round(rings$fraction * 100), "%"
  ),
  color = rings$color,
  stringsAsFactors = FALSE
)

# Center annotation — average completion
avg_pct <- round(mean(rings$fraction) * 100)

# Title (47 chars — no scaling needed)
title_str <- "gauge-activity-rings · r · ggplot2 · anyplot.ai"

p <- ggplot() +
  # Faint background tracks (full-circle behind each arc)
  geom_path(
    data     = track_df,
    aes(x = x, y = y, group = group, color = color),
    linewidth = 9, alpha = 0.15, lineend = "round"
  ) +
  # Progress arcs
  geom_path(
    data     = arc_df,
    aes(x = x, y = y, group = group, color = color),
    linewidth = 9, lineend = "round"
  ) +
  scale_color_identity() +
  # Right-side metric labels (3 rows each)
  geom_text(
    data = label_df,
    aes(x = lx, y = ly, label = label, color = color),
    hjust = 0, vjust = 0.5, size = 4.2,
    lineheight = 1.35, fontface = "bold"
  ) +
  # Center: average percentage
  annotate(
    "text", x = 0, y = 0.28,
    label = paste0(avg_pct, "%"),
    color = INK, size = 7.5, fontface = "bold", hjust = 0.5, vjust = 0.5
  ) +
  annotate(
    "text", x = 0, y = -0.42,
    label = "avg",
    color = INK_MUTED, size = 4.5, hjust = 0.5, vjust = 0.5
  ) +
  coord_fixed(
    xlim = c(-3.5, 5.6),
    ylim = c(-3.5, 3.5)
  ) +
  labs(title = title_str) +
  theme_void() +
  theme(
    plot.background  = element_rect(fill = PAGE_BG, color = PAGE_BG),
    panel.background = element_rect(fill = PAGE_BG, color = NA),
    plot.title       = element_text(
      color  = INK, size = 12, hjust = 0.5,
      margin = margin(t = 18, b = 10)
    ),
    plot.margin = margin(20, 20, 20, 20)
  )

ggsave(
  filename = sprintf("plot-%s.png", THEME),
  plot     = p,
  device   = ragg::agg_png,
  width    = 6,
  height   = 6,
  units    = "in",
  dpi      = 400
)
Runnable source as JSON, for any HTTP client: https://api.anyplot.ai/specs/gauge-activity-rings/ggplot2/code. Any spec id and library id listed in llms-full.txt fit the same URL shape; every URL below is complete and callable.
{
  "spec_id": "gauge-activity-rings",
  "language": "r",
  "library": "ggplot2",
  "page": "https://anyplot.ai/gauge-activity-rings/r/ggplot2",
  "hub": "https://anyplot.ai/gauge-activity-rings",
  "code_json": "https://api.anyplot.ai/specs/gauge-activity-rings/ggplot2/code",
  "spec_json": "https://api.anyplot.ai/specs/gauge-activity-rings",
  "render_light_png": "https://storage.googleapis.com/anyplot-images/plots/gauge-activity-rings/r/ggplot2/plot-light.png",
  "render_dark_png": "https://storage.googleapis.com/anyplot-images/plots/gauge-activity-rings/r/ggplot2/plot-dark.png",
  "quality_score": 88.0,
  "license": "MIT",
  "guide": "https://anyplot.ai/llms.txt"
}
Part of Activity Rings Progress Chart on anyplot.ai.