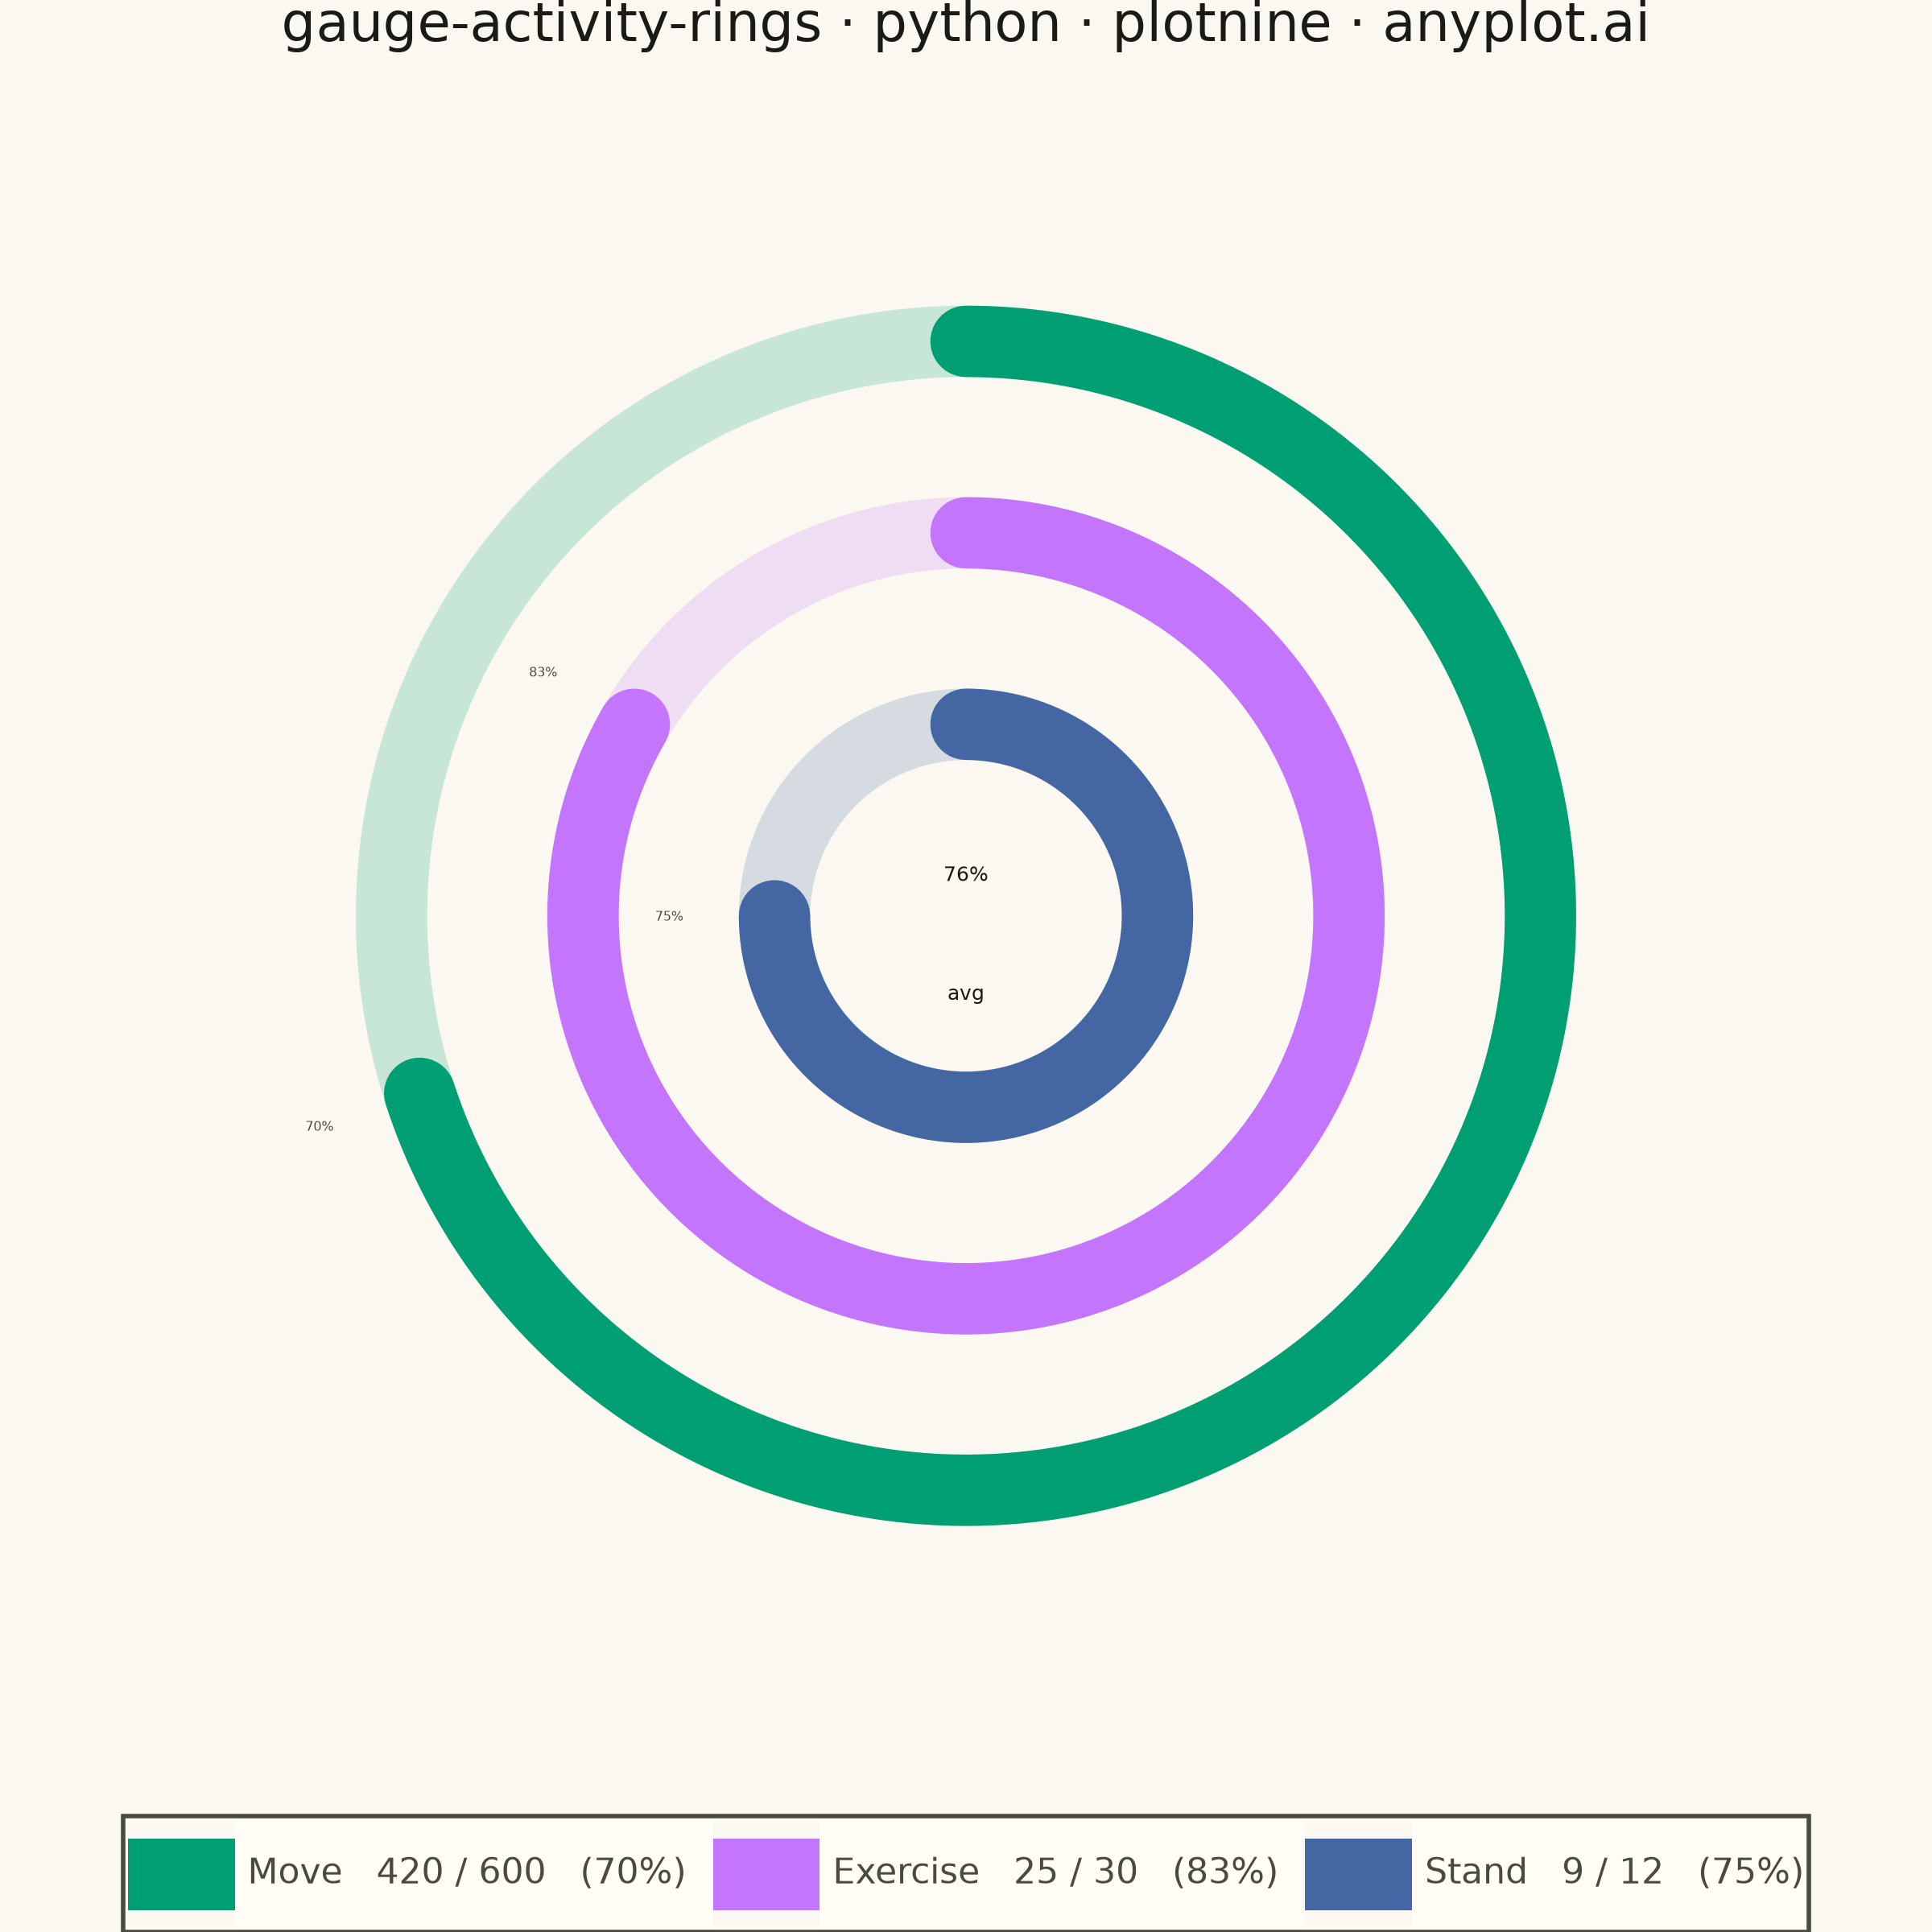
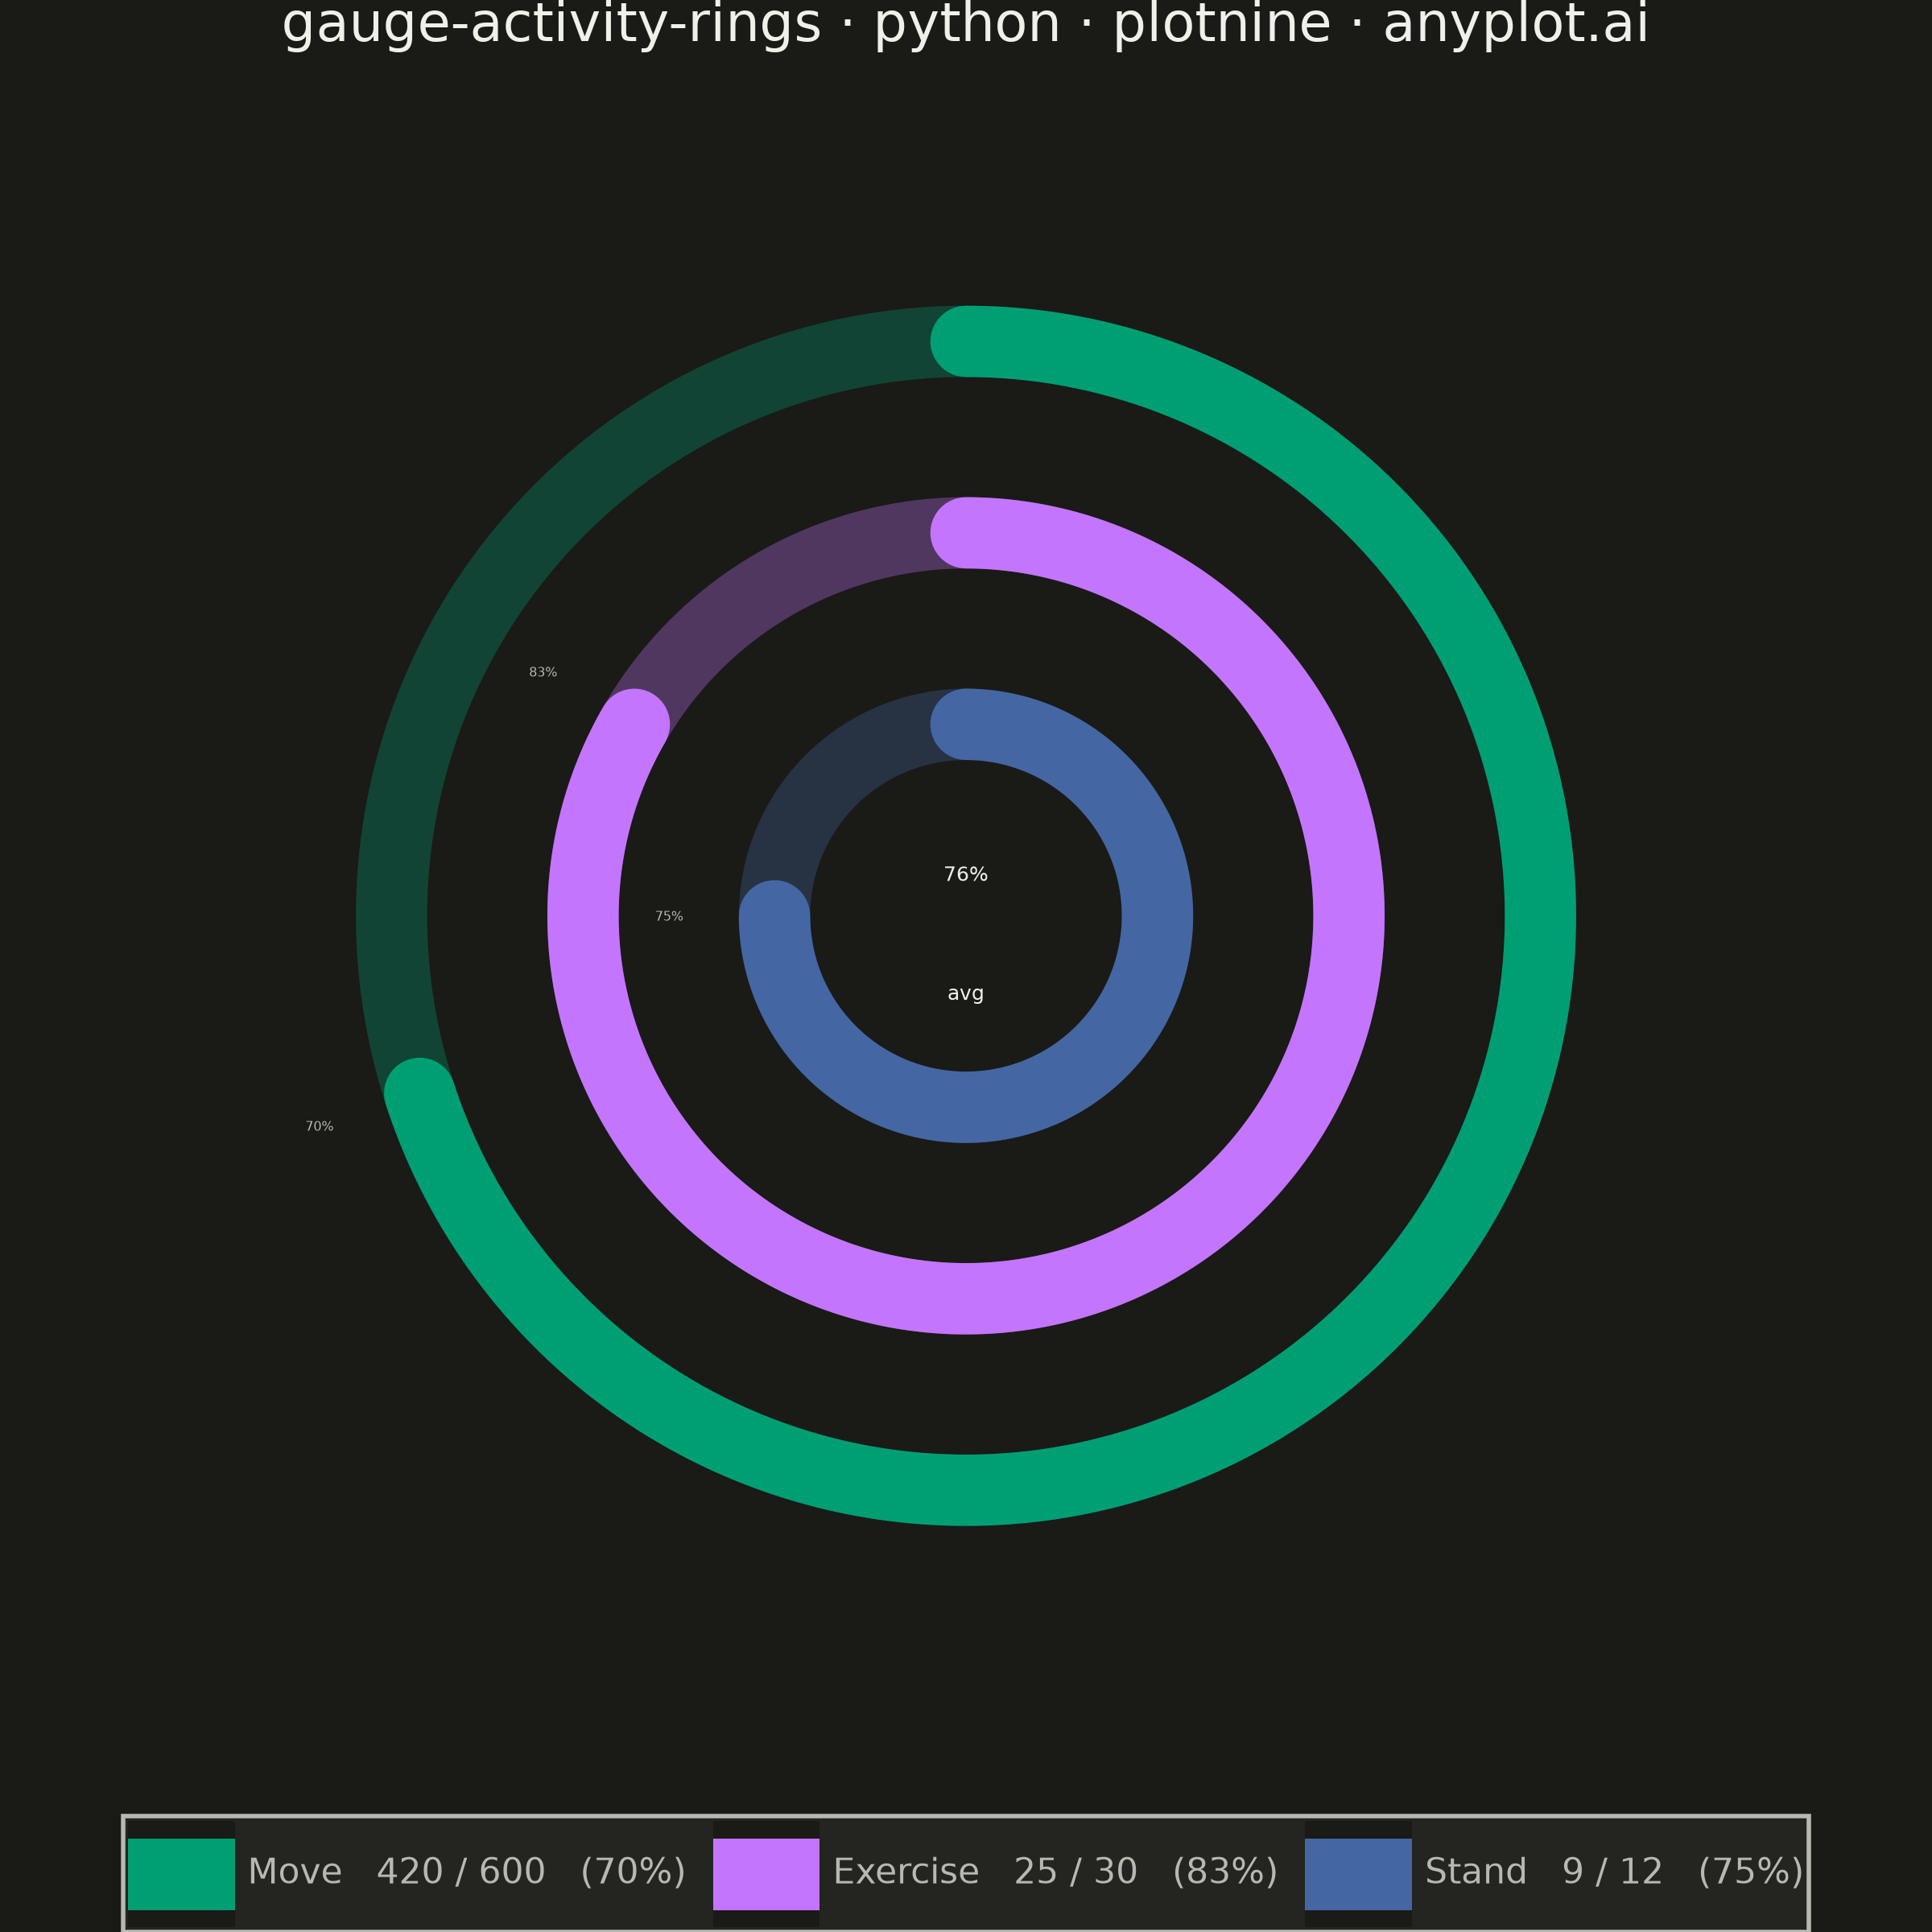
An activity rings chart displays goal completion for several metrics at once using concentric radial progress arcs, in the style popularized by fitness trackers. Each ring is a partial arc with rounded end caps that starts at the top (12 o'clock) and sweeps clockwise in proportion to how close the metric is to its goal, with a distinct color per metric and a faint background track showing the full circle. It is instantly recognizable and ideal for at-a-glance comparison of progress across a small set of related goals, filling the general radial-progress gap that needle gauges (`gauge-basic`) and polar bars (`polar-bar`) do not cover.
""" anyplot.ai
gauge-activity-rings: Activity Rings Progress Chart
Library: plotnine 0.15.7 | Python 3.13.13
Quality: 88/100 | Created: 2026-06-14
"""

import os

import numpy as np
import pandas as pd
from plotnine import (
    aes,
    coord_equal,
    element_blank,
    element_rect,
    element_text,
    geom_path,
    geom_text,
    ggplot,
    labs,
    scale_color_manual,
    theme,
    theme_void,
)


THEME = os.getenv("ANYPLOT_THEME", "light")
PAGE_BG = "#FAF8F1" if THEME == "light" else "#1A1A17"
ELEVATED_BG = "#FFFDF6" if THEME == "light" else "#242420"
INK = "#1A1A17" if THEME == "light" else "#F0EFE8"
INK_SOFT = "#4A4A44" if THEME == "light" else "#B8B7B0"

# Imprint palette — positions 1-3 for Move / Exercise / Stand
IMPRINT_PALETTE = ["#009E73", "#C475FD", "#4467A3"]

# Fitness tracker: Move / Exercise / Stand goals (spec example data)
ring_configs = [
    {"metric": "Move", "value": 420, "goal": 600, "radius": 3.0},
    {"metric": "Exercise", "value": 25, "goal": 30, "radius": 2.0},
    {"metric": "Stand", "value": 9, "goal": 12, "radius": 1.0},
]

# Track alpha — slightly more visible on dark surfaces
TRACK_ALPHA = 0.20 if THEME == "light" else 0.32

# Decompose background color once for track blending
_bg = [int(PAGE_BG.lstrip("#")[j : j + 2], 16) for j in (0, 2, 4)]

# Build arc point data
# Clockwise from top: x = r*sin(theta), y = r*cos(theta), theta in [0, 2pi)
N_SMOOTH = 400

track_rows = []
arc_rows = []
color_dict = {}
legend_breaks = []
legend_labels = []
ann_rows = []

for i, ring in enumerate(ring_configs):
    progress = min(ring["value"] / ring["goal"], 1.0)
    r = ring["radius"]
    color = IMPRINT_PALETTE[i]

    # Blend ring color onto background for the faint track arc
    _fg = [int(color.lstrip("#")[j : j + 2], 16) for j in (0, 2, 4)]
    track_color = "#{:02X}{:02X}{:02X}".format(
        *[int(_fg[j] * TRACK_ALPHA + _bg[j] * (1 - TRACK_ALPHA)) for j in range(3)]
    )

    track_key = f"{ring['metric']}_track"
    arc_key = f"{ring['metric']}_arc"

    # Full-circle background track
    thetas = np.linspace(0, 2 * np.pi, N_SMOOTH + 1)
    track_rows.append(pd.DataFrame({"x": r * np.sin(thetas), "y": r * np.cos(thetas), "group": track_key}))

    # Progress arc from 12 o'clock, sweeping clockwise
    n_pts = max(3, int(N_SMOOTH * progress))
    arc_thetas = np.linspace(0, progress * 2 * np.pi, n_pts)
    arc_rows.append(pd.DataFrame({"x": r * np.sin(arc_thetas), "y": r * np.cos(arc_thetas), "group": arc_key}))

    color_dict[track_key] = track_color
    color_dict[arc_key] = color

    legend_breaks.append(arc_key)
    pct = round(ring["value"] / ring["goal"] * 100)
    legend_labels.append(f"{ring['metric']}   {ring['value']} / {ring['goal']}   ({pct}%)")

    # Endpoint annotation: % label placed just outside the arc tip
    theta_end = progress * 2 * np.pi
    r_lbl = r + 0.55
    ann_rows.append({"x": r_lbl * np.sin(theta_end), "y": r_lbl * np.cos(theta_end), "label": f"{pct}%"})

# Center headline: overall average completion
avg_pct = round(sum(min(r["value"] / r["goal"], 1.0) for r in ring_configs) / len(ring_configs) * 100)
df_center = pd.DataFrame({"x": [0.0, 0.0], "y": [0.22, -0.42], "label": [f"{avg_pct}%", "avg"]})
df_ann = pd.DataFrame(ann_rows)

# Tracks drawn first (underneath), arcs drawn on top
df_tracks = pd.concat(track_rows, ignore_index=True)
df_arcs = pd.concat(arc_rows, ignore_index=True)
df = pd.concat([df_tracks, df_arcs], ignore_index=True)

all_groups = list(color_dict.keys())
df["group"] = pd.Categorical(df["group"], categories=all_groups)

title = "gauge-activity-rings · python · plotnine · anyplot.ai"

plot = (
    ggplot(df, aes(x="x", y="y", group="group", color="group"))
    + geom_path(data=df_tracks, size=9, lineend="round")
    + geom_path(data=df_arcs, size=9, lineend="round")
    + geom_text(mapping=aes(x="x", y="y", label="label"), data=df_center, color=INK, size=4.5, inherit_aes=False)
    + geom_text(mapping=aes(x="x", y="y", label="label"), data=df_ann, color=INK_SOFT, size=2.8, inherit_aes=False)
    + coord_equal(xlim=(-4.0, 4.0), ylim=(-4.0, 4.0))
    + scale_color_manual(values=color_dict, breaks=legend_breaks, labels=legend_labels, name="")
    + labs(title=title, x=None, y=None)
    + theme_void()
    + theme(
        figure_size=(6, 6),
        plot_background=element_rect(fill=PAGE_BG, color=PAGE_BG),
        panel_background=element_rect(fill=PAGE_BG),
        plot_title=element_text(color=INK, size=12, hjust=0.5),
        legend_background=element_rect(fill=ELEVATED_BG, color=INK_SOFT),
        legend_text=element_text(color=INK_SOFT, size=8),
        legend_position="bottom",
        legend_title=element_blank(),
        legend_key=element_rect(fill=PAGE_BG, color=PAGE_BG),
    )
)

plot.save(f"plot-{THEME}.png", dpi=400, width=6, height=6, units="in")
Runnable source as JSON, for any HTTP client: https://api.anyplot.ai/specs/gauge-activity-rings/plotnine/code. Any spec id and library id listed in llms-full.txt fit the same URL shape; every URL below is complete and callable.
{
  "spec_id": "gauge-activity-rings",
  "language": "python",
  "library": "plotnine",
  "page": "https://anyplot.ai/gauge-activity-rings/python/plotnine",
  "hub": "https://anyplot.ai/gauge-activity-rings",
  "code_json": "https://api.anyplot.ai/specs/gauge-activity-rings/plotnine/code",
  "spec_json": "https://api.anyplot.ai/specs/gauge-activity-rings",
  "render_light_png": "https://storage.googleapis.com/anyplot-images/plots/gauge-activity-rings/python/plotnine/plot-light.png",
  "render_dark_png": "https://storage.googleapis.com/anyplot-images/plots/gauge-activity-rings/python/plotnine/plot-dark.png",
  "quality_score": 88.0,
  "license": "MIT",
  "guide": "https://anyplot.ai/llms.txt"
}
Part of Activity Rings Progress Chart on anyplot.ai.