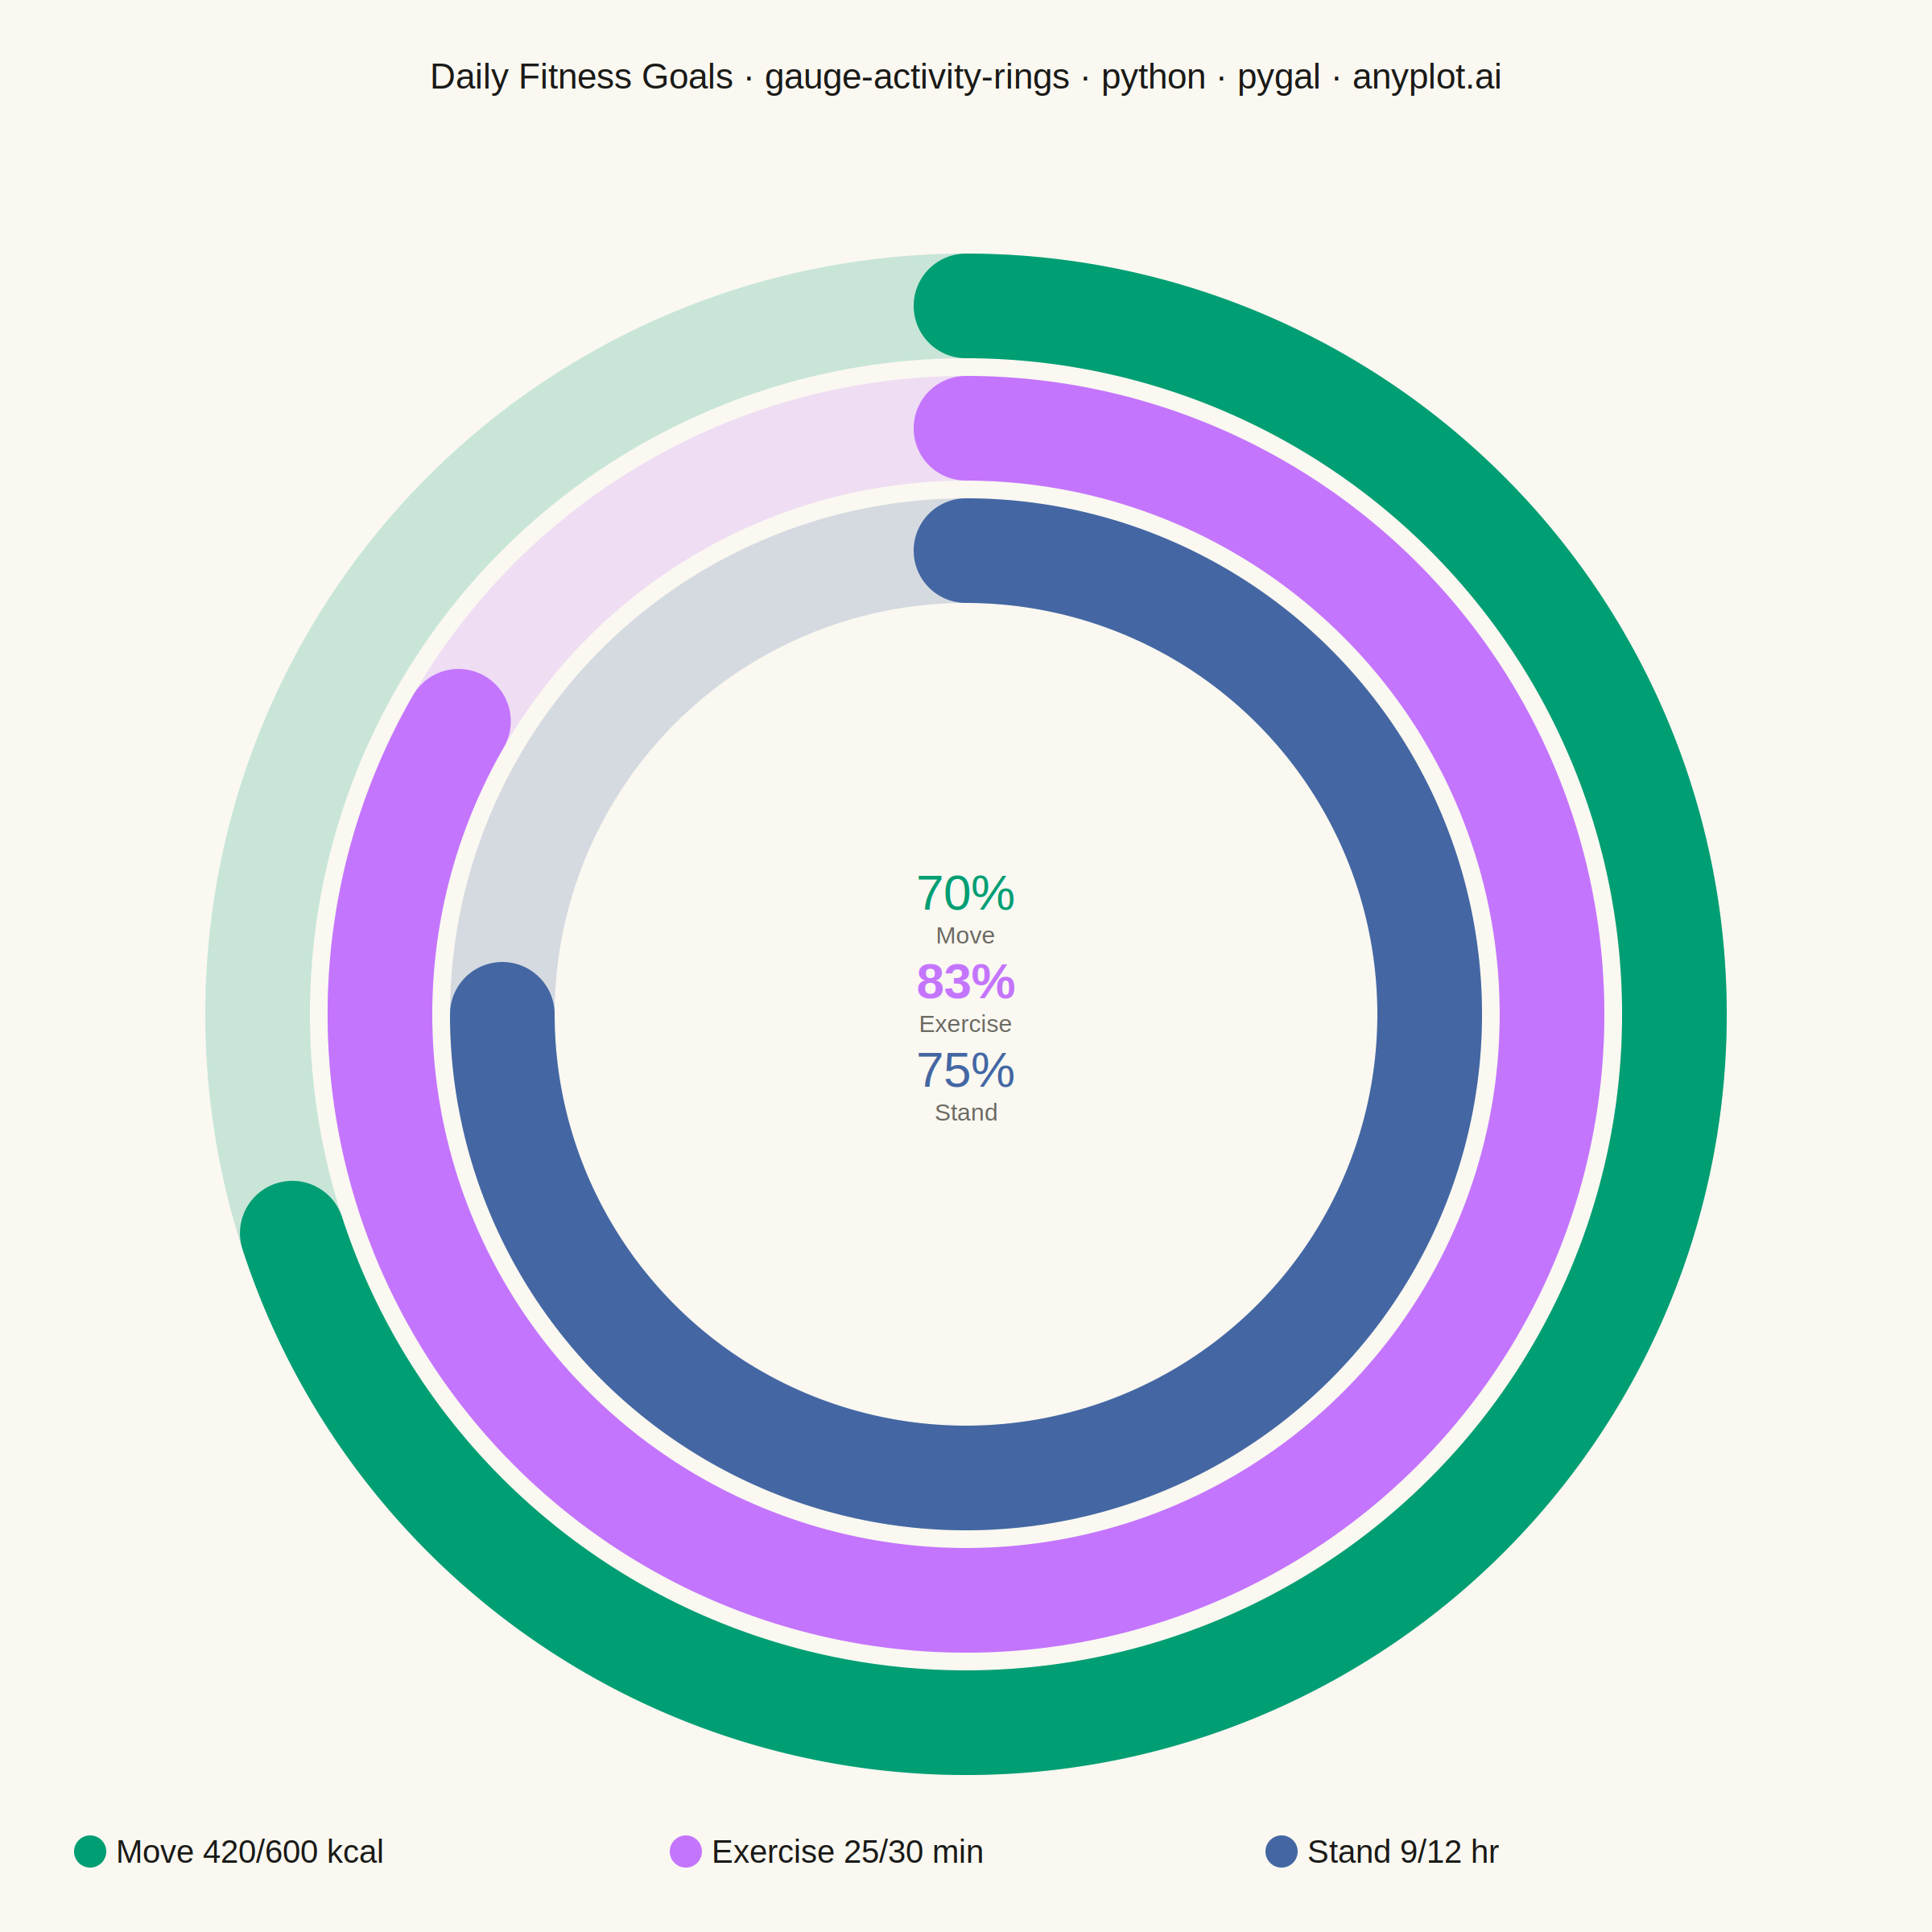
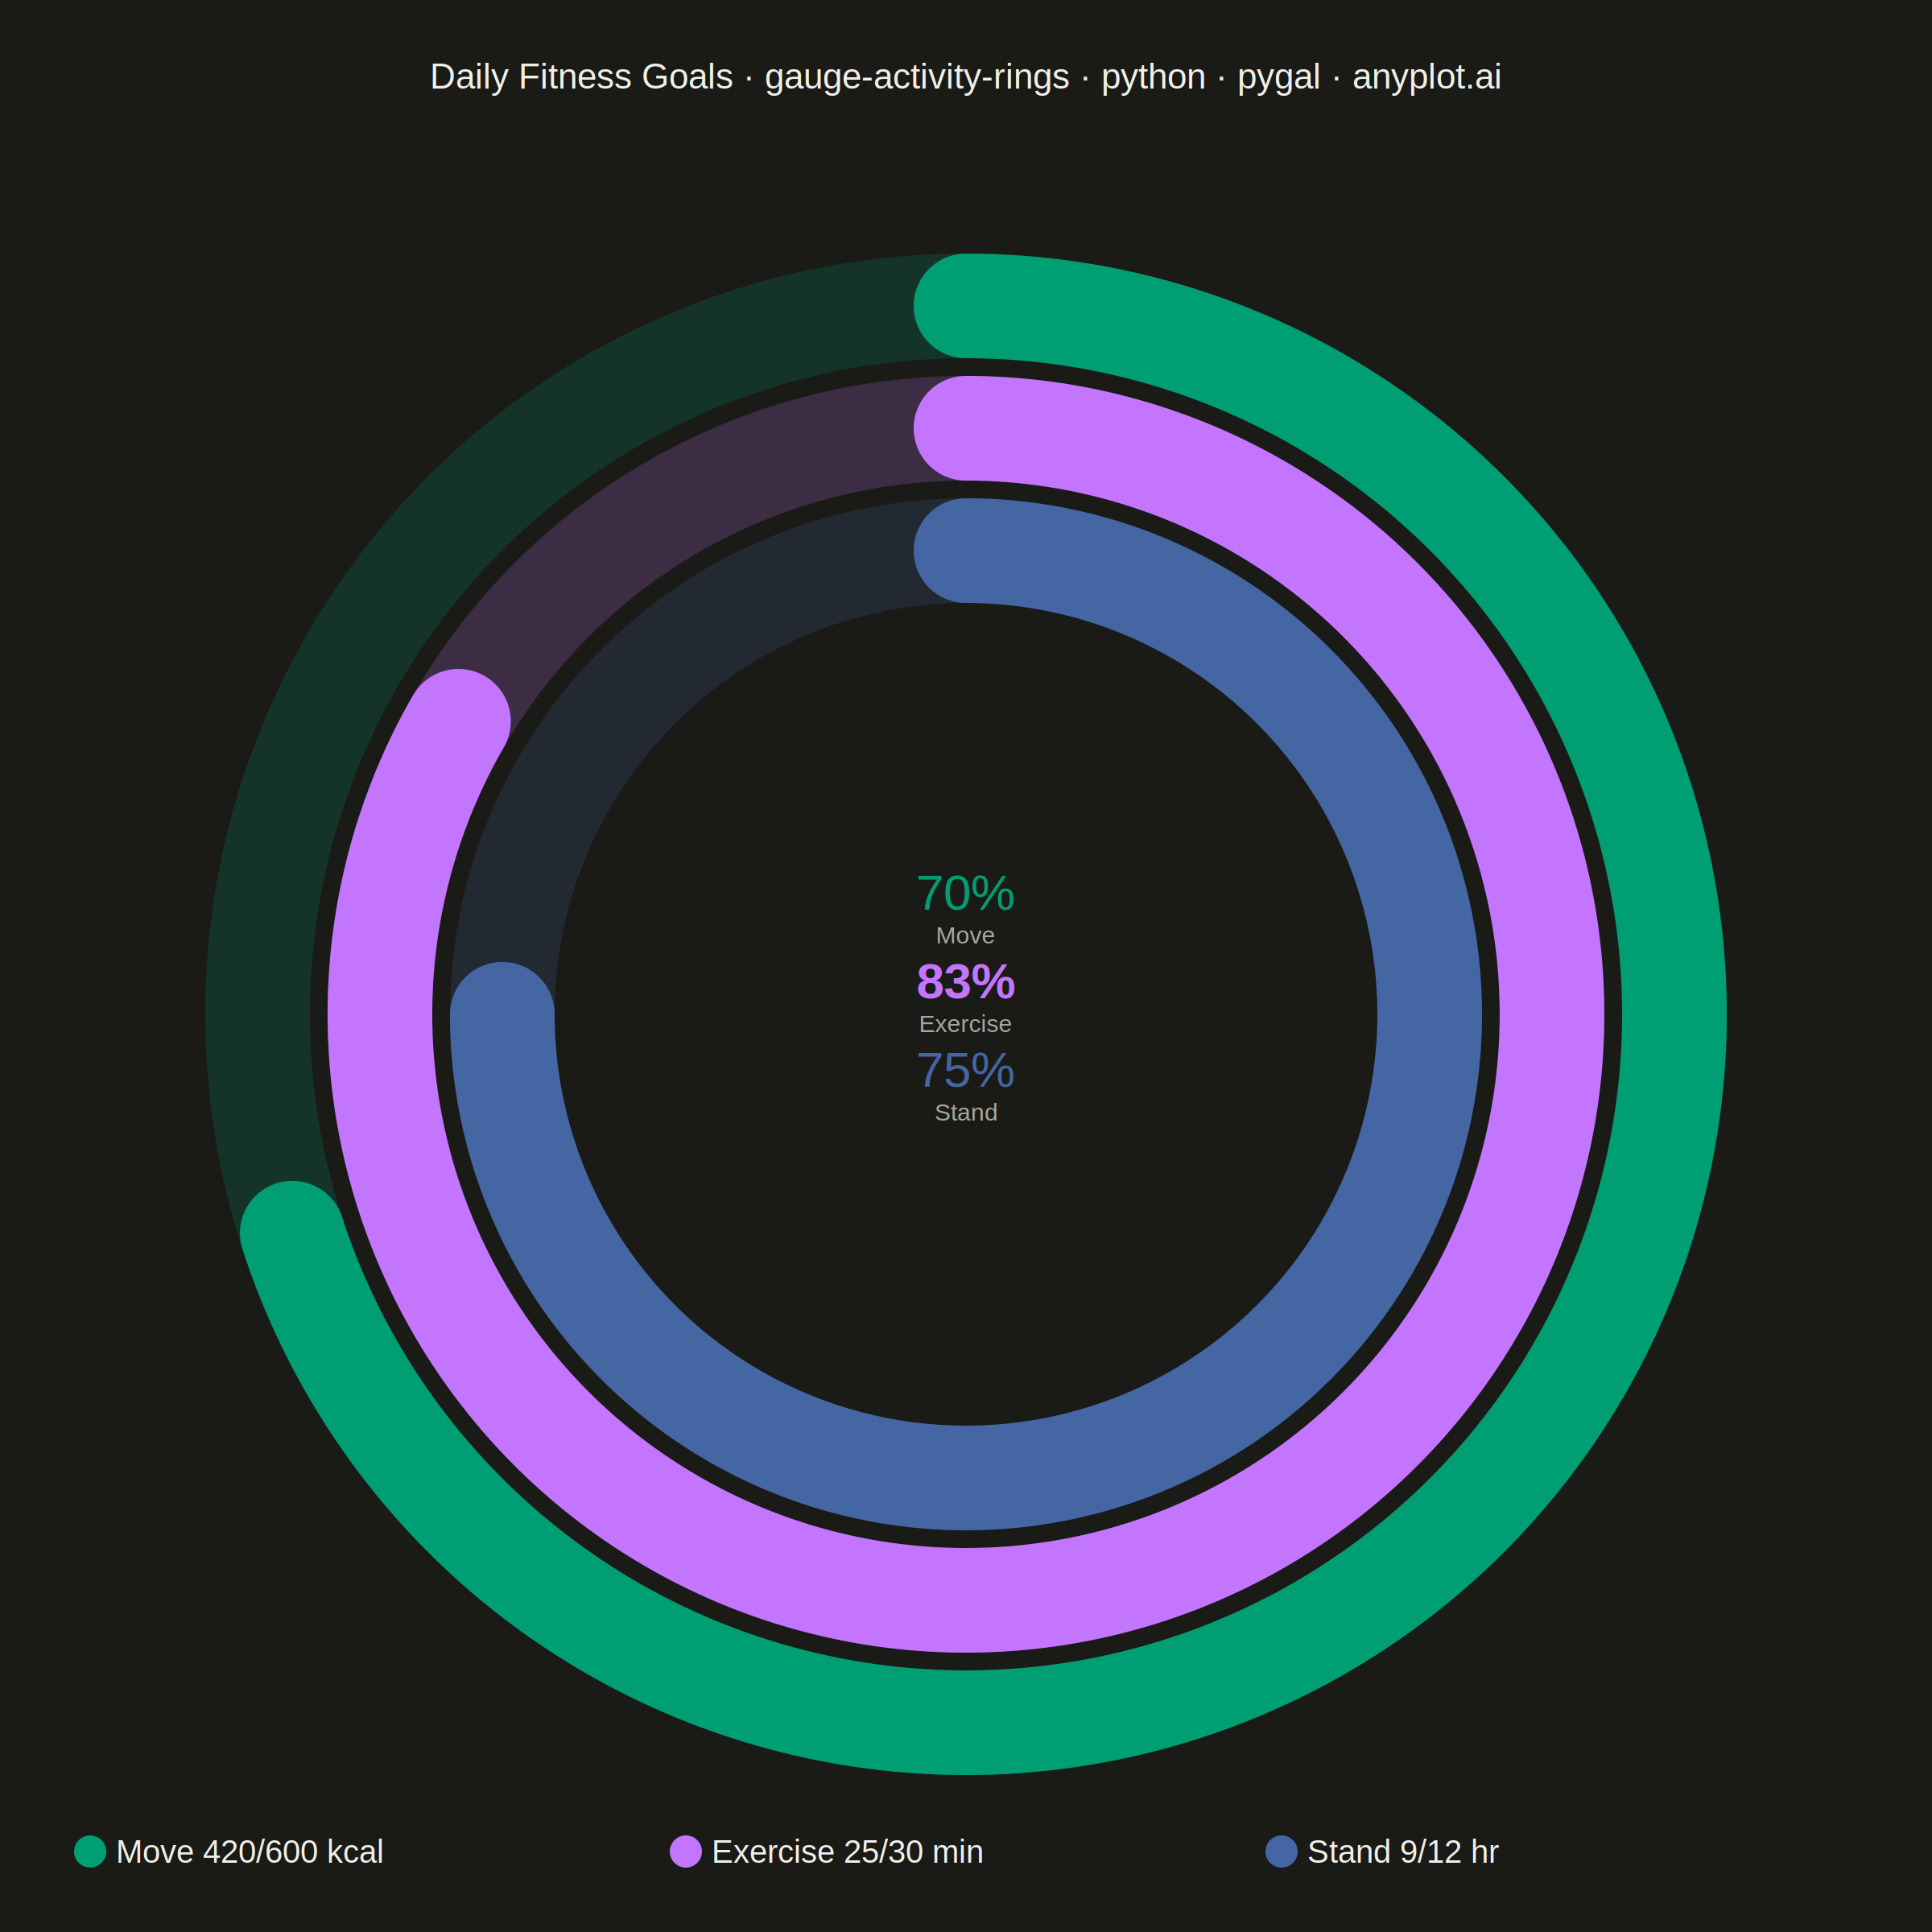
An activity rings chart displays goal completion for several metrics at once using concentric radial progress arcs, in the style popularized by fitness trackers. Each ring is a partial arc with rounded end caps that starts at the top (12 o'clock) and sweeps clockwise in proportion to how close the metric is to its goal, with a distinct color per metric and a faint background track showing the full circle. It is instantly recognizable and ideal for at-a-glance comparison of progress across a small set of related goals, filling the general radial-progress gap that needle gauges (`gauge-basic`) and polar bars (`polar-bar`) do not cover.
""" anyplot.ai
gauge-activity-rings: Activity Rings Progress Chart
Library: pygal 3.1.0 | Python 3.13.13
Quality: 81/100 | Created: 2026-06-14
"""

import math
import os
import sys


# Remove this file from sys.path so cairosvg (a pygal dep) resolves the real package
sys.path = [p for p in sys.path if os.path.abspath(p) != os.path.dirname(os.path.abspath(__file__))]

import cairosvg


THEME = os.getenv("ANYPLOT_THEME", "light")
PAGE_BG = "#FAF8F1" if THEME == "light" else "#1A1A17"
INK = "#1A1A17" if THEME == "light" else "#F0EFE8"
INK_MUTED = "#6B6A63" if THEME == "light" else "#A8A79F"

RING_COLORS = ["#009E73", "#C475FD", "#4467A3"]
metrics = ["Move", "Exercise", "Stand"]
values = [420, 25, 9]
goals = [600, 30, 12]
units = ["kcal", "min", "hr"]
fractions = [min(v / g, 1.0) for v, g in zip(values, goals, strict=False)]

W, H = 2400, 2400
STROKE = 130
GAP = 22
OUTER_R = 880
cx, cy = W / 2, H / 2 + 60

radii = [OUTER_R - i * (STROKE + GAP) for i in range(3)]


def arc_d(r, frac, ox, oy):
    if frac <= 0:
        return None
    if frac >= 1.0:
        return f"M {ox:.1f},{oy - r:.1f} A {r},{r} 0 1,1 {ox:.1f},{oy + r:.1f} A {r},{r} 0 1,1 {ox:.1f},{oy - r:.1f}"
    sweep = frac * 360
    a1, a2 = math.radians(-90), math.radians(-90 + sweep)
    x1, y1 = ox + r * math.cos(a1), oy + r * math.sin(a1)
    x2, y2 = ox + r * math.cos(a2), oy + r * math.sin(a2)
    lf = 1 if sweep > 180 else 0
    return f"M {x1:.1f},{y1:.1f} A {r},{r} 0 {lf},1 {x2:.1f},{y2:.1f}"


title = "Daily Fitness Goals · gauge-activity-rings · python · pygal · anyplot.ai"

els = [
    f'<svg xmlns="http://www.w3.org/2000/svg" width="{W}" height="{H}" viewBox="0 0 {W} {H}">',
    f'<rect width="{W}" height="{H}" fill="{PAGE_BG}"/>',
    (
        f'<text x="{W / 2:.0f}" y="110" text-anchor="middle" '
        f'font-family="Arial,sans-serif" font-size="44" fill="{INK}">{title}</text>'
    ),
]

# Background tracks (ring color at 20% opacity) + progress arcs with rounded caps
for frac, color, r in zip(fractions, RING_COLORS, radii, strict=False):
    els.append(
        f'<circle cx="{cx:.0f}" cy="{cy:.0f}" r="{r}" fill="none" '
        f'stroke="{color}" stroke-opacity="0.20" stroke-width="{STROKE}"/>'
    )
    d = arc_d(r, frac, cx, cy)
    if d:
        els.append(f'<path d="{d}" fill="none" stroke="{color}" stroke-width="{STROKE}" stroke-linecap="round"/>')

# Center labels — colored percentage (bold for best) + muted metric name
best = fractions.index(max(fractions))
ty0 = cy - 130
for i, (metric, frac, color) in enumerate(zip(metrics, fractions, RING_COLORS, strict=False)):
    py = ty0 + i * 110
    weight = "bold" if i == best else "400"
    els.extend(
        [
            (
                f'<text x="{cx:.0f}" y="{py:.0f}" text-anchor="middle" '
                f'font-family="Arial,sans-serif" font-size="62" '
                f'fill="{color}" font-weight="{weight}">{frac * 100:.0f}%</text>'
            ),
            (
                f'<text x="{cx:.0f}" y="{py + 42:.0f}" text-anchor="middle" '
                f'font-family="Arial,sans-serif" font-size="30" fill="{INK_MUTED}">{metric}</text>'
            ),
        ]
    )

# Legend at bottom
lw = 740
lx0 = (W - lw * len(metrics)) / 2
for i, (m, v, g, u, c) in enumerate(zip(metrics, values, goals, units, RING_COLORS, strict=False)):
    lx = lx0 + i * lw
    ly = H - 100
    els.extend(
        [
            f'<circle cx="{lx + 22:.0f}" cy="{ly:.0f}" r="20" fill="{c}"/>',
            (
                f'<text x="{lx + 54:.0f}" y="{ly + 14:.0f}" '
                f'font-family="Arial,sans-serif" font-size="40" fill="{INK}">'
                f"{m}  {v}/{g} {u}</text>"
            ),
        ]
    )

els.append("</svg>")
svg_str = "\n".join(els)

cairosvg.svg2png(bytestring=svg_str.encode(), write_to=f"plot-{THEME}.png")

with open(f"plot-{THEME}.html", "w", encoding="utf-8") as f:
    f.write(
        f'<!DOCTYPE html><html><head><meta charset="utf-8"></head>'
        f'<body style="margin:0;background:{PAGE_BG}">{svg_str}</body></html>'
    )
Runnable source as JSON, for any HTTP client: https://api.anyplot.ai/specs/gauge-activity-rings/pygal/code. Any spec id and library id listed in llms-full.txt fit the same URL shape; every URL below is complete and callable.
{
  "spec_id": "gauge-activity-rings",
  "language": "python",
  "library": "pygal",
  "page": "https://anyplot.ai/gauge-activity-rings/python/pygal",
  "hub": "https://anyplot.ai/gauge-activity-rings",
  "code_json": "https://api.anyplot.ai/specs/gauge-activity-rings/pygal/code",
  "spec_json": "https://api.anyplot.ai/specs/gauge-activity-rings",
  "render_light_png": "https://storage.googleapis.com/anyplot-images/plots/gauge-activity-rings/python/pygal/plot-light.png",
  "render_dark_png": "https://storage.googleapis.com/anyplot-images/plots/gauge-activity-rings/python/pygal/plot-dark.png",
  "interactive_light_html": "https://storage.googleapis.com/anyplot-images/plots/gauge-activity-rings/python/pygal/plot-light.html",
  "interactive_dark_html": "https://storage.googleapis.com/anyplot-images/plots/gauge-activity-rings/python/pygal/plot-dark.html",
  "quality_score": 81.0,
  "license": "MIT",
  "guide": "https://anyplot.ai/llms.txt"
}
Part of Activity Rings Progress Chart on anyplot.ai.