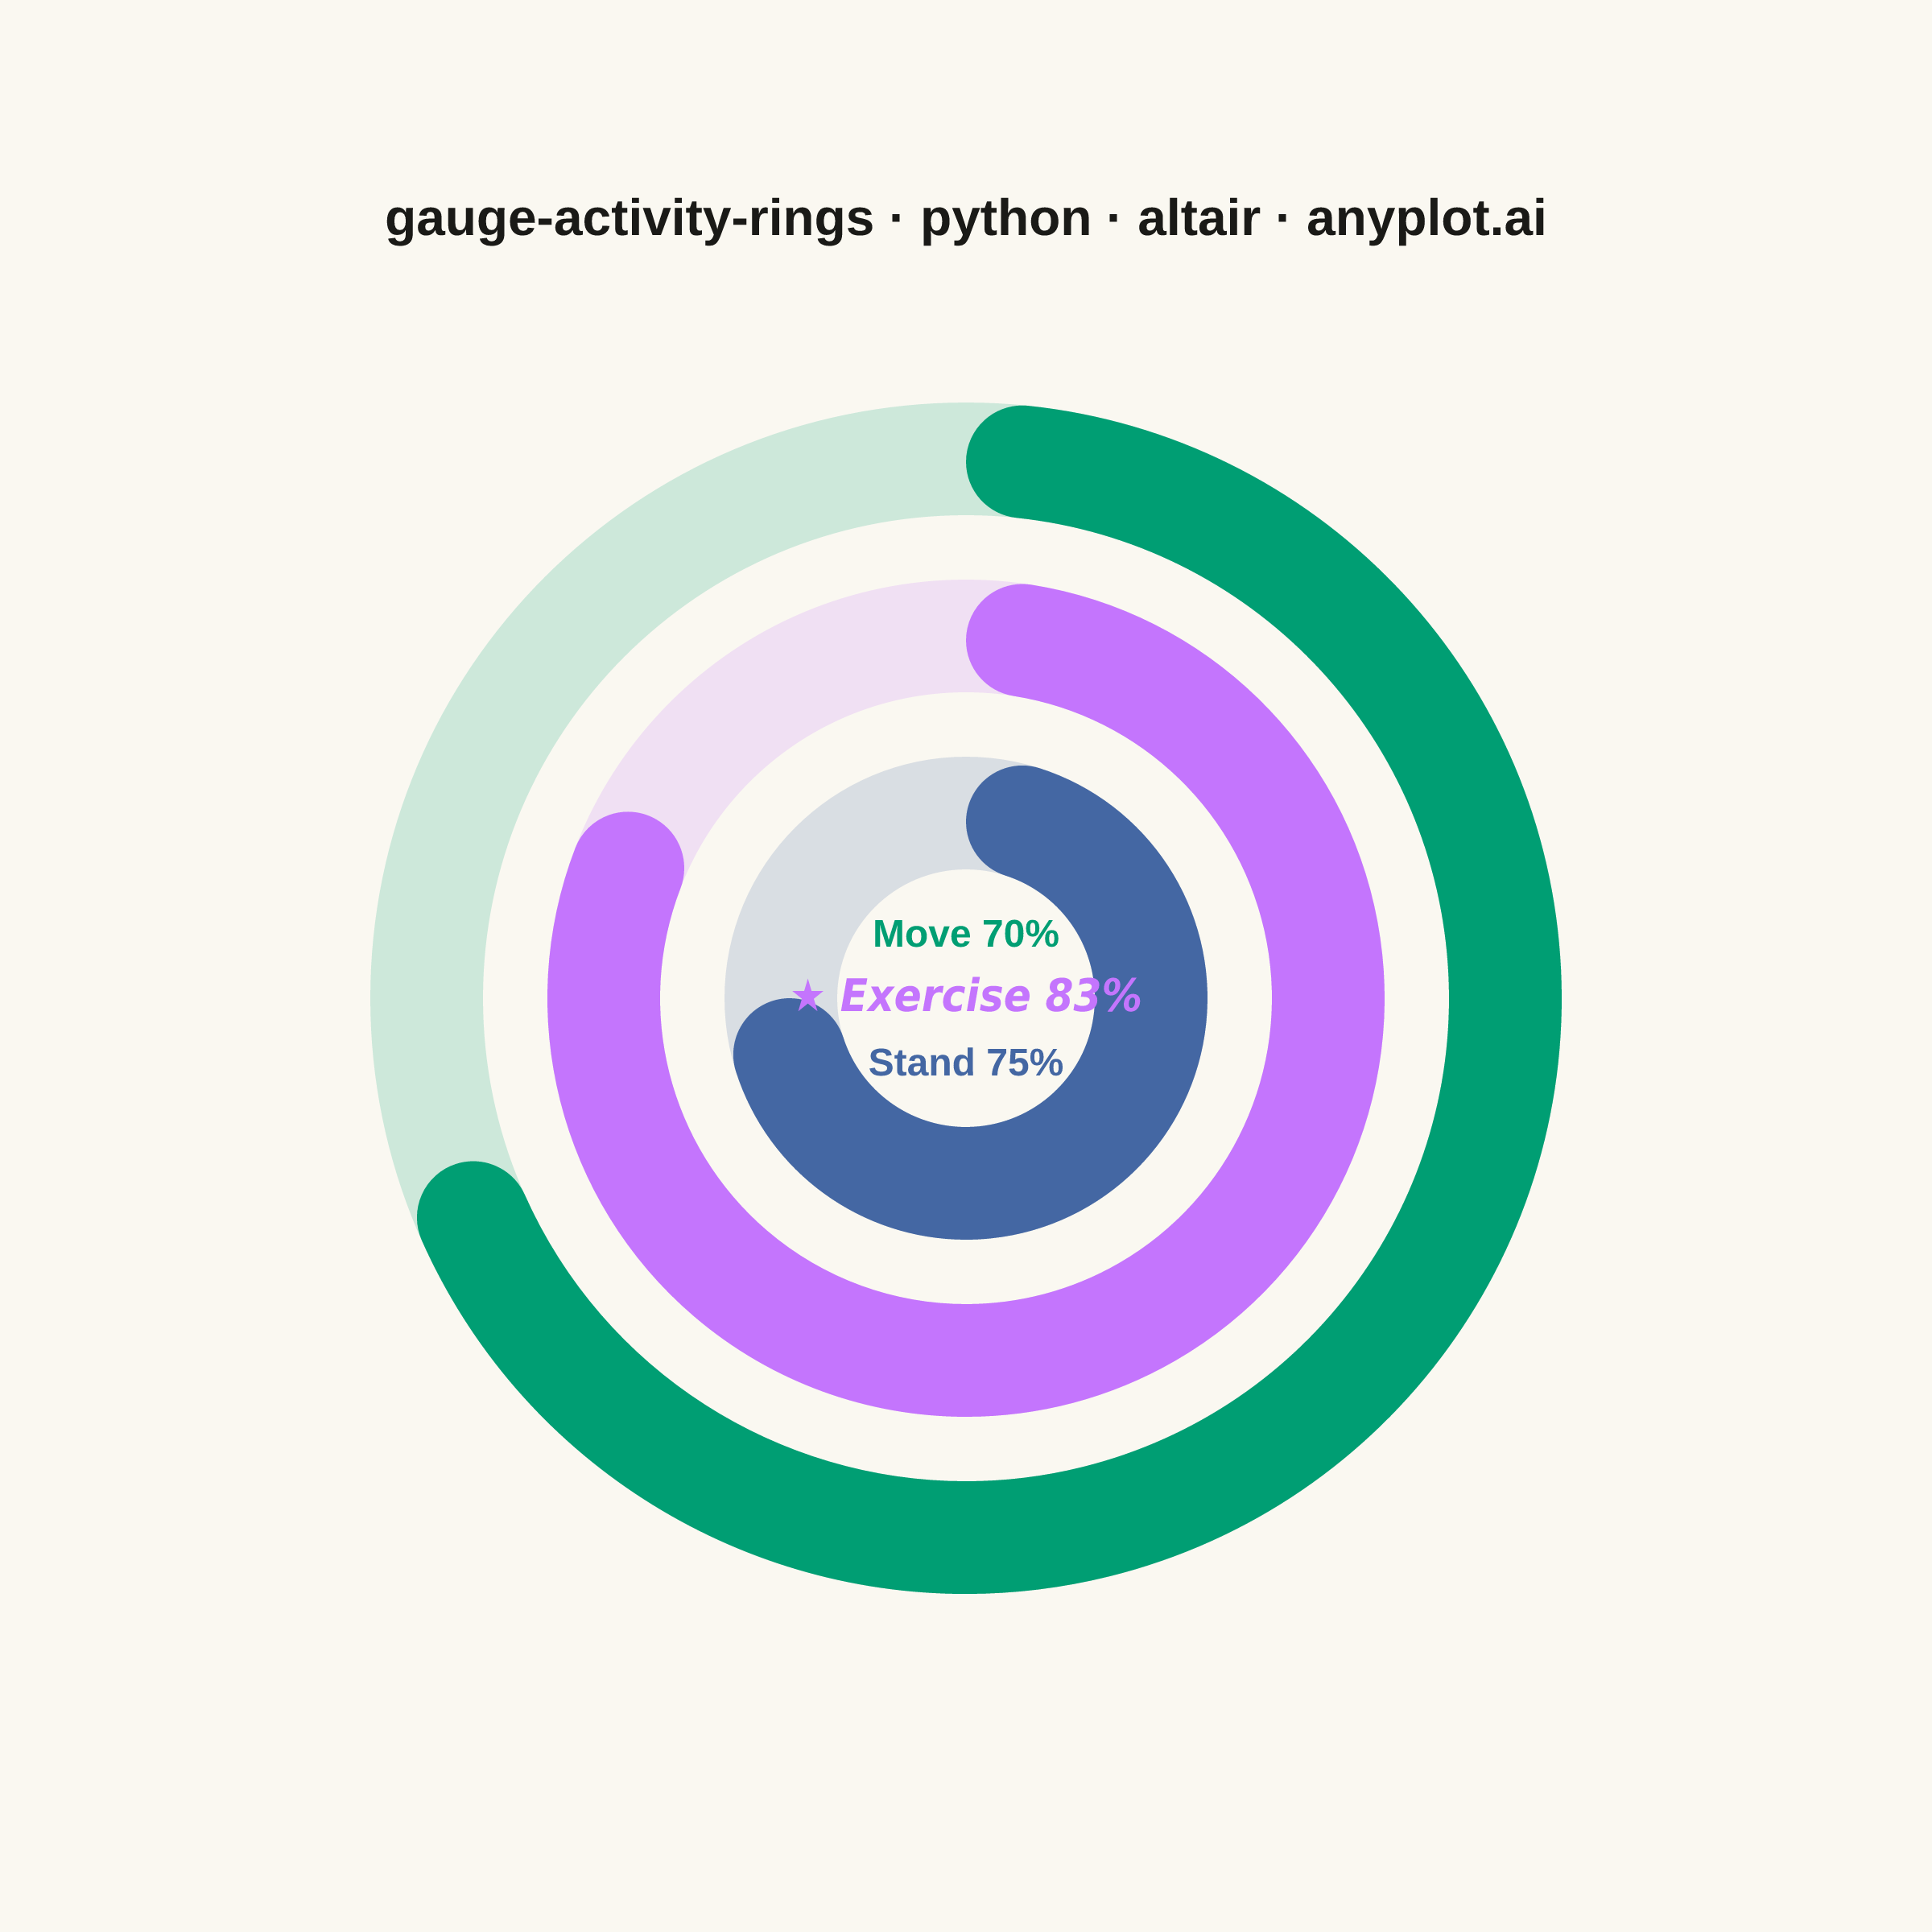
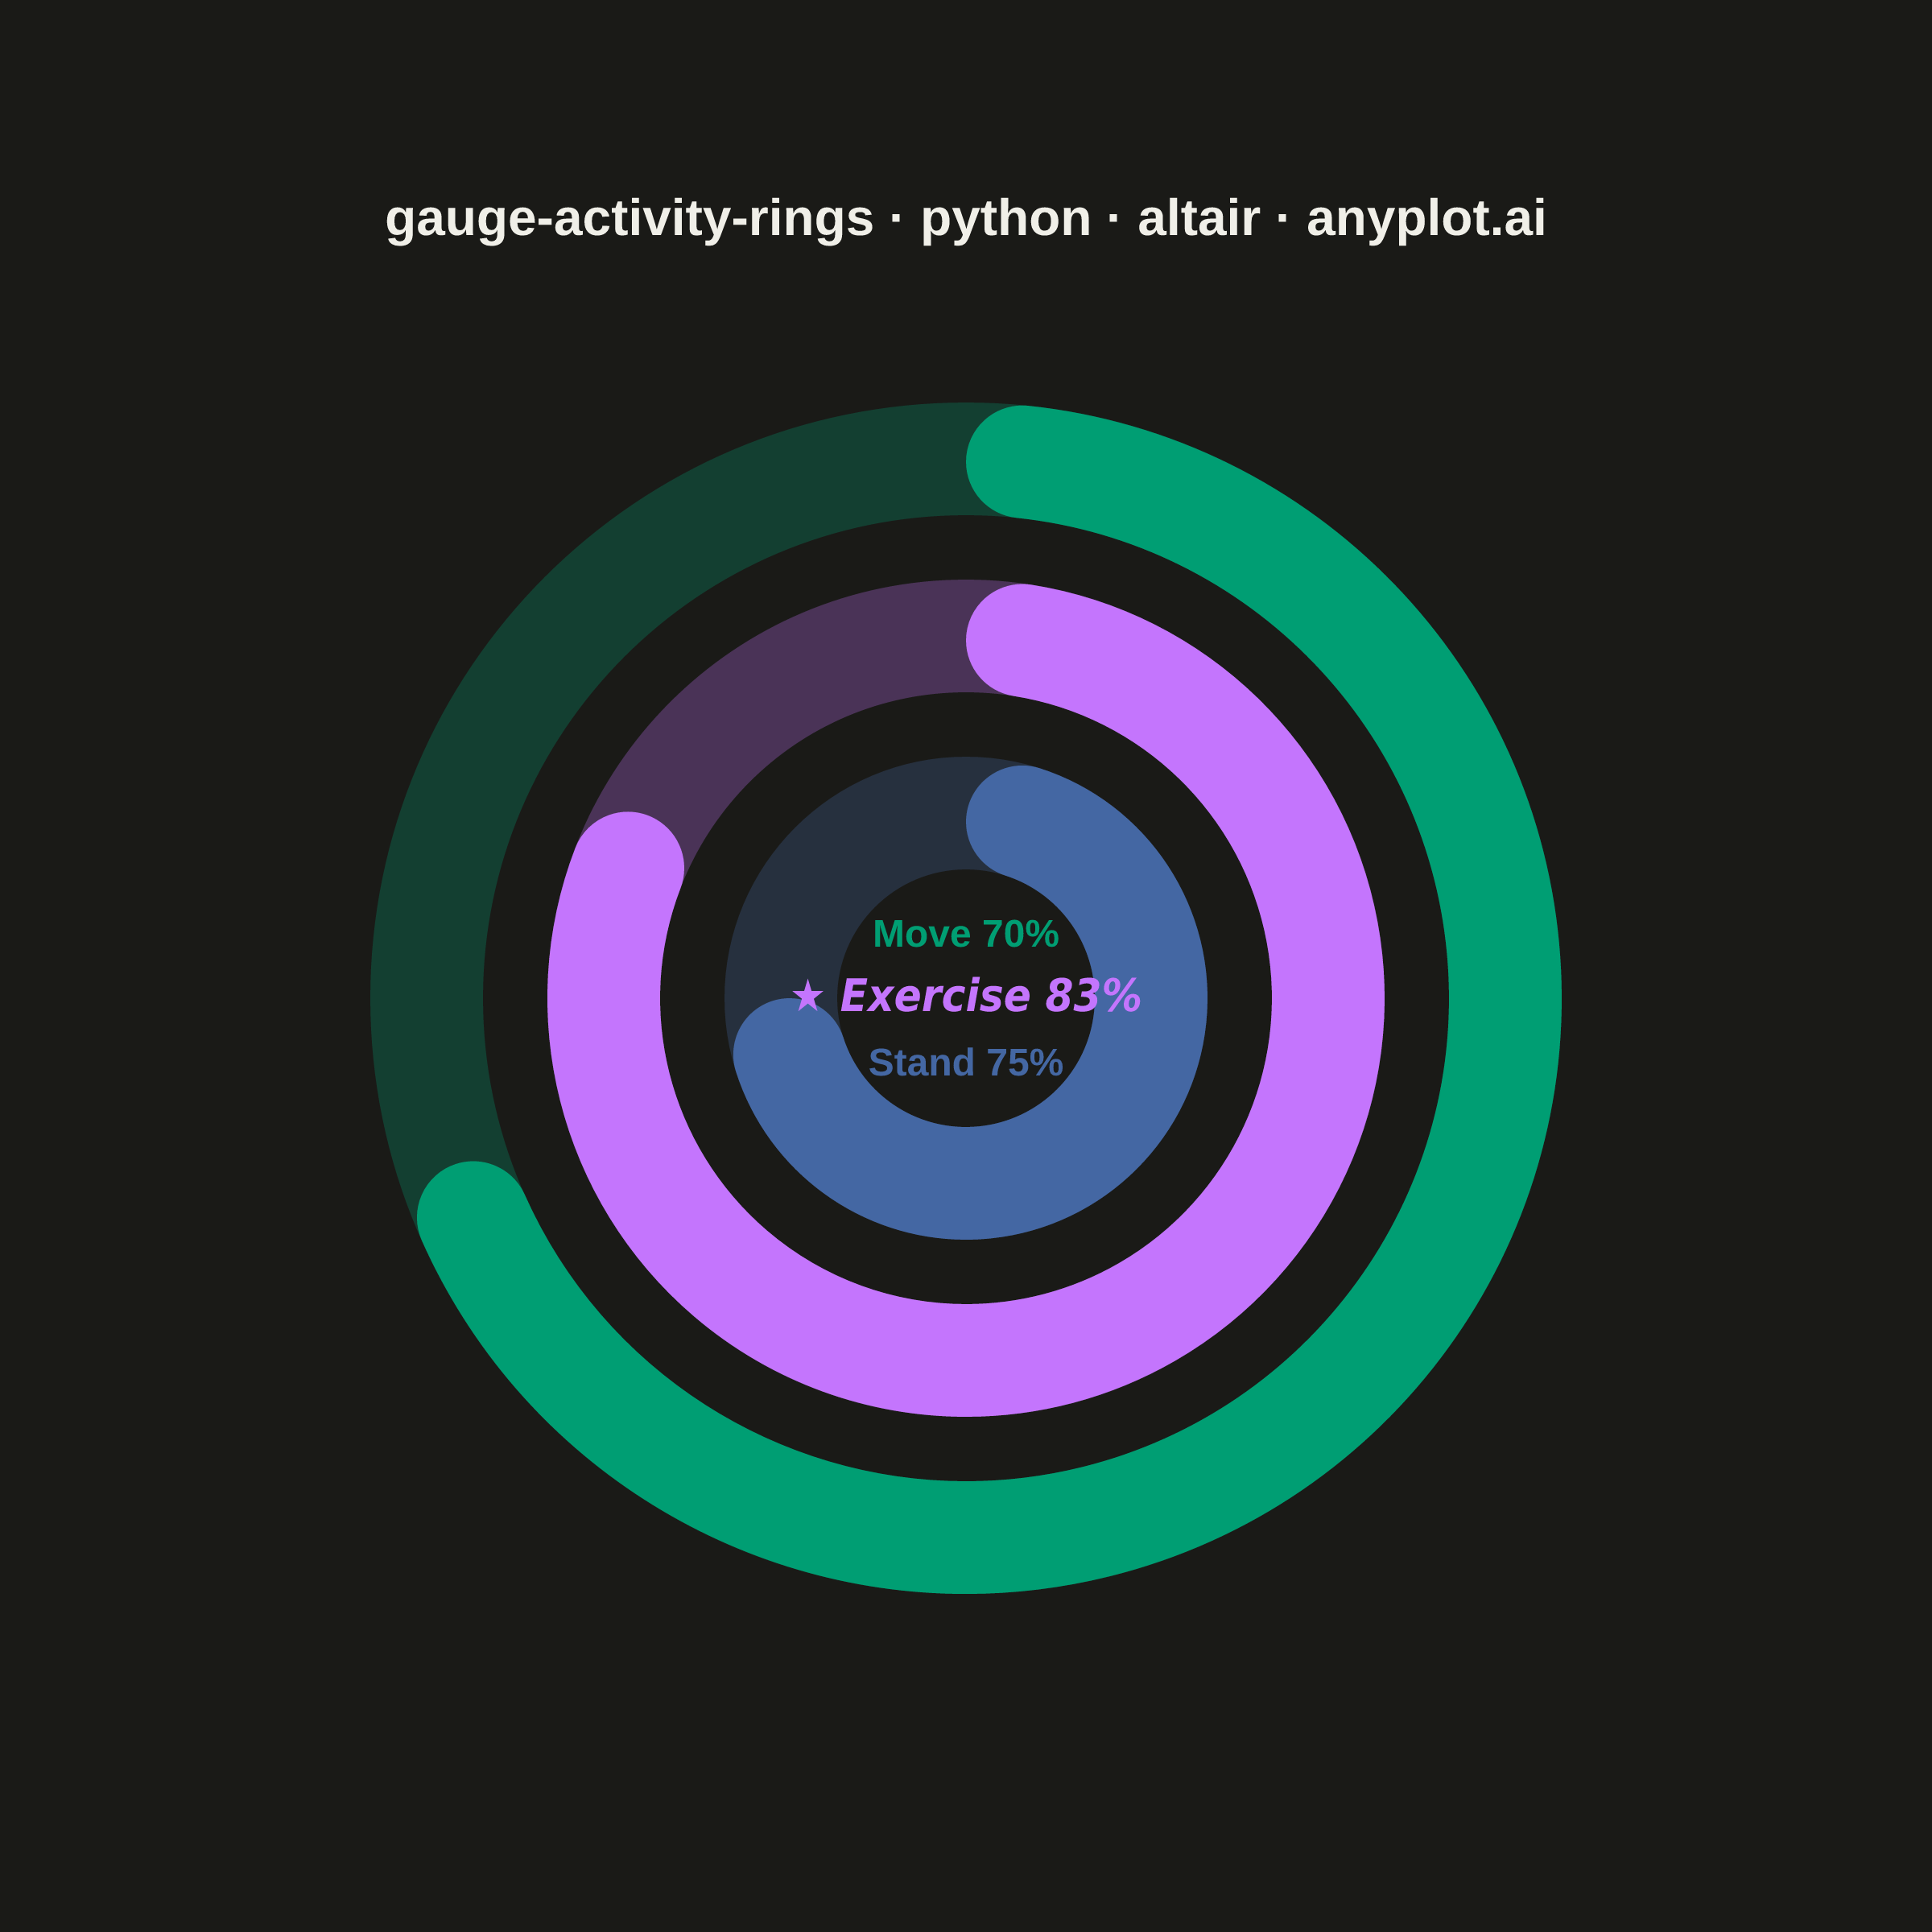
An activity rings chart displays goal completion for several metrics at once using concentric radial progress arcs, in the style popularized by fitness trackers. Each ring is a partial arc with rounded end caps that starts at the top (12 o'clock) and sweeps clockwise in proportion to how close the metric is to its goal, with a distinct color per metric and a faint background track showing the full circle. It is instantly recognizable and ideal for at-a-glance comparison of progress across a small set of related goals, filling the general radial-progress gap that needle gauges (`gauge-basic`) and polar bars (`polar-bar`) do not cover.
""" anyplot.ai
gauge-activity-rings: Activity Rings Progress Chart
Library: altair 6.2.1 | Python 3.13.13
Quality: 86/100 | Created: 2026-06-14
"""

import importlib
import os
import sys


# Drop script directory from sys.path so `altair` package resolves, not this file
sys.path[:] = [p for p in sys.path if os.path.abspath(p or ".") != os.path.dirname(os.path.abspath(__file__))]
alt = importlib.import_module("altair")
np = importlib.import_module("numpy")
pd = importlib.import_module("pandas")
Image = importlib.import_module("PIL.Image")

# Theme tokens
THEME = os.getenv("ANYPLOT_THEME", "light")
PAGE_BG = "#FAF8F1" if THEME == "light" else "#1A1A17"
ELEVATED_BG = "#FFFDF6" if THEME == "light" else "#242420"
INK = "#1A1A17" if THEME == "light" else "#F0EFE8"
INK_SOFT = "#4A4A44" if THEME == "light" else "#B8B7B0"
INK_MUTED = "#6B6A63" if THEME == "light" else "#A8A79F"
# Background track opacity — bumped for dark theme where it would otherwise vanish
TRACK_OPACITY = 0.18 if THEME == "light" else 0.28

# Imprint palette — positions 1-3 for three activity rings
IMPRINT_PALETTE = ["#009E73", "#C475FD", "#4467A3", "#BD8233", "#AE3030", "#2ABCCD", "#954477", "#99B314"]

# Data — daily fitness tracker goals
metrics = ["Move", "Exercise", "Stand"]
values = [420, 25, 9]
goals = [600, 30, 12]
units = ["kcal", "min", "hr"]
colors = IMPRINT_PALETTE[:3]

fractions = [v / g for v, g in zip(values, goals, strict=False)]
# Ring geometry: outer ring = Move (primary), inner = Stand
outer_radii = [185, 130, 75]
inner_radii = [150, 95, 40]

TWO_PI = 2 * np.pi
VIEW_CX = 250  # view center x (width / 2)
VIEW_CY = 230  # view center y (height / 2)

# Title with adaptive fontsize
title = "gauge-activity-rings · python · altair · anyplot.ai"
n = len(title)
title_size = max(11, round(16 * (67 / n if n > 67 else 1.0)))

# Index of highest-completion ring for visual storytelling emphasis (DE-03)
best_idx = fractions.index(max(fractions))

# Build arc layers inline — no helper function (KISS / CQ-01)
layers = []
for metric, val, goal, unit, color, r_out, r_in, frac in zip(
    metrics, values, goals, units, colors, outer_radii, inner_radii, fractions, strict=False
):
    tip = f"{val} / {goal} {unit}  ({round(frac * 100)}%)"
    full_df = pd.DataFrame([{"s": 0.0, "e": TWO_PI}])
    arc_df = pd.DataFrame([{"s": 0.0, "e": min(frac, 1.0) * TWO_PI, "metric": metric, "tip": tip}])
    track = (
        alt.Chart(full_df)
        .mark_arc(innerRadius=r_in, outerRadius=r_out, cornerRadius=22)
        .encode(
            theta=alt.Theta("s:Q", scale=None), theta2="e:Q", color=alt.value(color), opacity=alt.value(TRACK_OPACITY)
        )
    )
    arc = (
        alt.Chart(arc_df)
        .mark_arc(innerRadius=r_in, outerRadius=r_out, cornerRadius=22)
        .encode(
            theta=alt.Theta("s:Q", scale=None),
            theta2="e:Q",
            color=alt.value(color),
            opacity=alt.value(1.0),
            tooltip=[alt.Tooltip("metric:N", title="Activity"), alt.Tooltip("tip:N", title="Progress")],
        )
    )
    layers.append(track + arc)

# Center labels: stacked metric lines inside the inner hole
# Best-performing ring gets a ★ prefix and slightly larger font for storytelling (DE-03)
center_y_positions = [VIEW_CY - 20, VIEW_CY, VIEW_CY + 20]
center_labels = []
for i, (metric, frac, color, cy) in enumerate(zip(metrics, fractions, colors, center_y_positions, strict=False)):
    is_best = i == best_idx
    label_text = f"{'★ ' if is_best else ''}{metric}  {round(frac * 100)}%"
    label_size = 14 if is_best else 12
    lbl_df = pd.DataFrame([{"txt": label_text}])
    center_labels.append(
        alt.Chart(lbl_df)
        .mark_text(fontSize=label_size, fontWeight="bold", align="center", baseline="middle")
        .encode(x=alt.value(VIEW_CX), y=alt.value(cy), text="txt:N", color=alt.value(color))
    )

all_layers = layers + center_labels
chart = (
    alt.layer(*all_layers)
    .properties(
        width=500,
        height=460,
        background=PAGE_BG,
        title=alt.TitleParams(text=title, fontSize=title_size, color=INK, anchor="middle"),
    )
    .configure_view(fill=PAGE_BG, stroke=None)
    .configure_title(color=INK, fontSize=title_size)
)

# Save PNG
chart.save(f"plot-{THEME}.png", scale_factor=4.0)

# Pad to exact square target (2400×2400)
TW, TH = 2400, 2400
_img = Image.open(f"plot-{THEME}.png").convert("RGB")
_w, _h = _img.size
if _w > TW or _h > TH:
    raise SystemExit(
        f"altair vl-convert produced {_w}×{_h}, exceeds {TW}×{TH}. Shrink .properties(width=, height=) and re-render."
    )
if _w < TW or _h < TH:
    _canvas = Image.new("RGB", (TW, TH), PAGE_BG)
    _canvas.paste(_img, ((TW - _w) // 2, (TH - _h) // 2))
    _canvas.save(f"plot-{THEME}.png")

# Save interactive HTML
chart.save(f"plot-{THEME}.html")
Runnable source as JSON, for any HTTP client: https://api.anyplot.ai/specs/gauge-activity-rings/altair/code. Any spec id and library id listed in llms-full.txt fit the same URL shape; every URL below is complete and callable.
{
  "spec_id": "gauge-activity-rings",
  "language": "python",
  "library": "altair",
  "page": "https://anyplot.ai/gauge-activity-rings/python/altair",
  "hub": "https://anyplot.ai/gauge-activity-rings",
  "code_json": "https://api.anyplot.ai/specs/gauge-activity-rings/altair/code",
  "spec_json": "https://api.anyplot.ai/specs/gauge-activity-rings",
  "render_light_png": "https://storage.googleapis.com/anyplot-images/plots/gauge-activity-rings/python/altair/plot-light.png",
  "render_dark_png": "https://storage.googleapis.com/anyplot-images/plots/gauge-activity-rings/python/altair/plot-dark.png",
  "interactive_light_html": "https://storage.googleapis.com/anyplot-images/plots/gauge-activity-rings/python/altair/plot-light.html",
  "interactive_dark_html": "https://storage.googleapis.com/anyplot-images/plots/gauge-activity-rings/python/altair/plot-dark.html",
  "quality_score": 86.0,
  "license": "MIT",
  "guide": "https://anyplot.ai/llms.txt"
}
Part of Activity Rings Progress Chart on anyplot.ai.