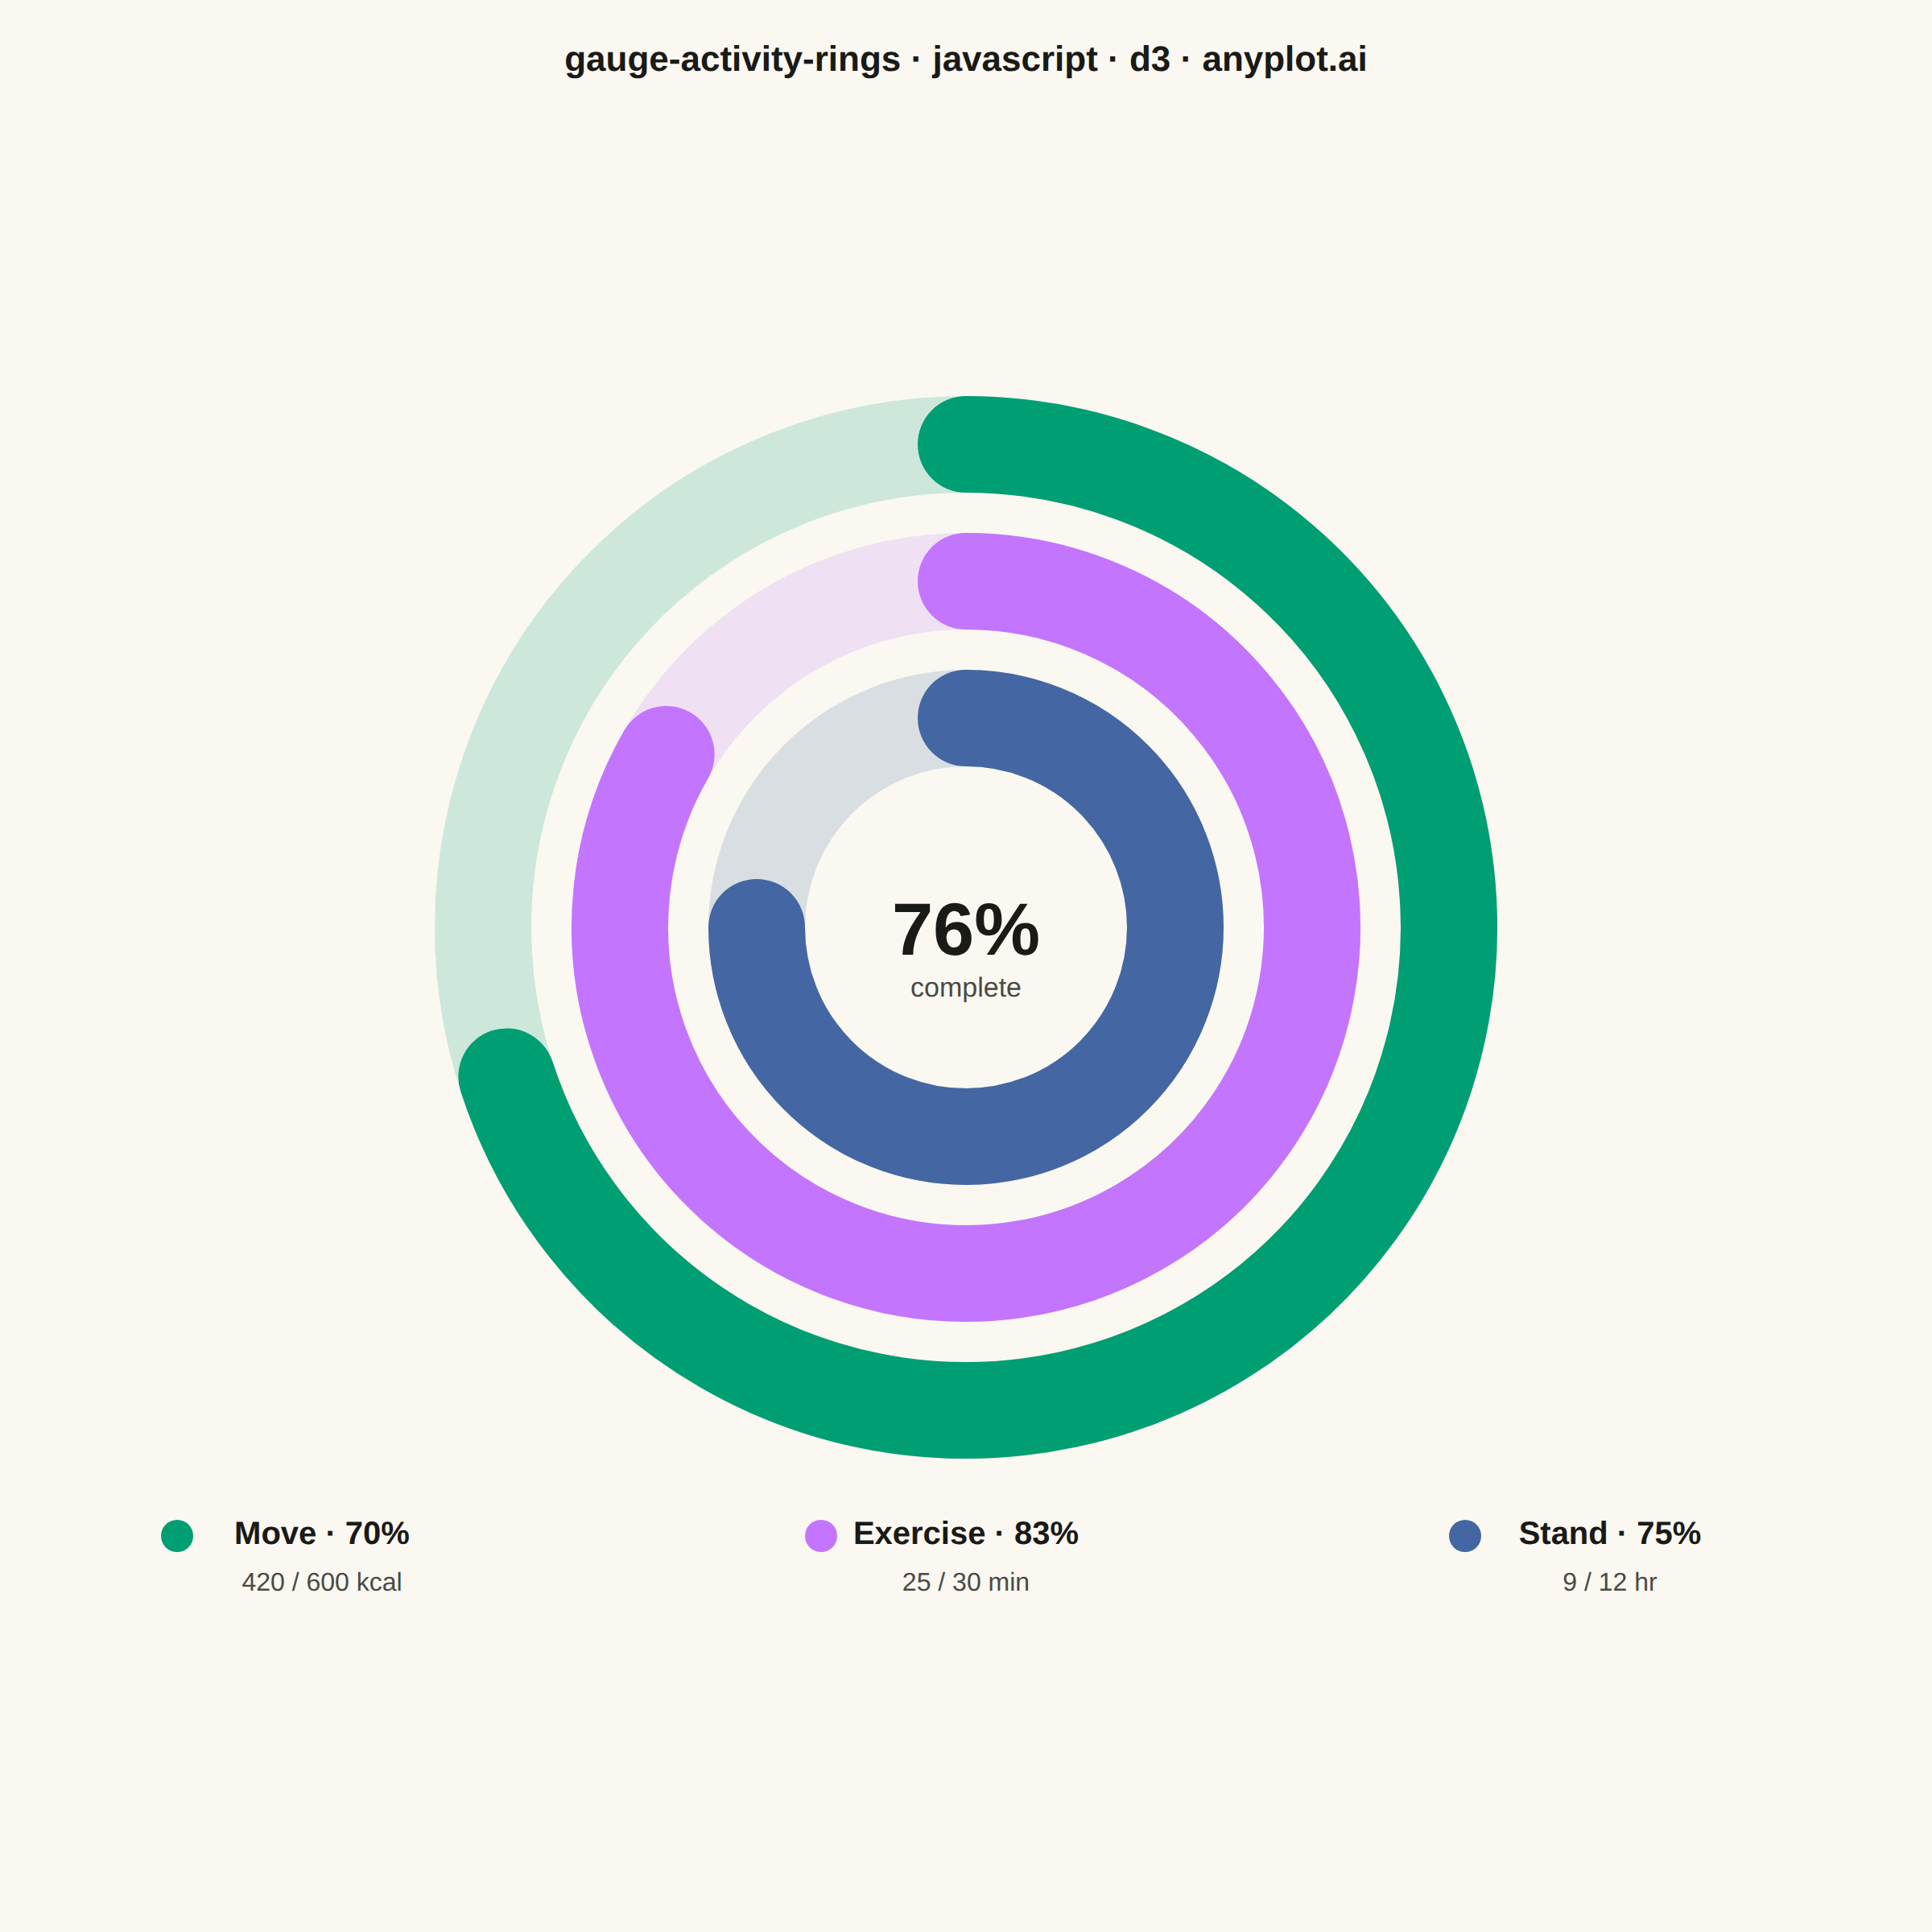
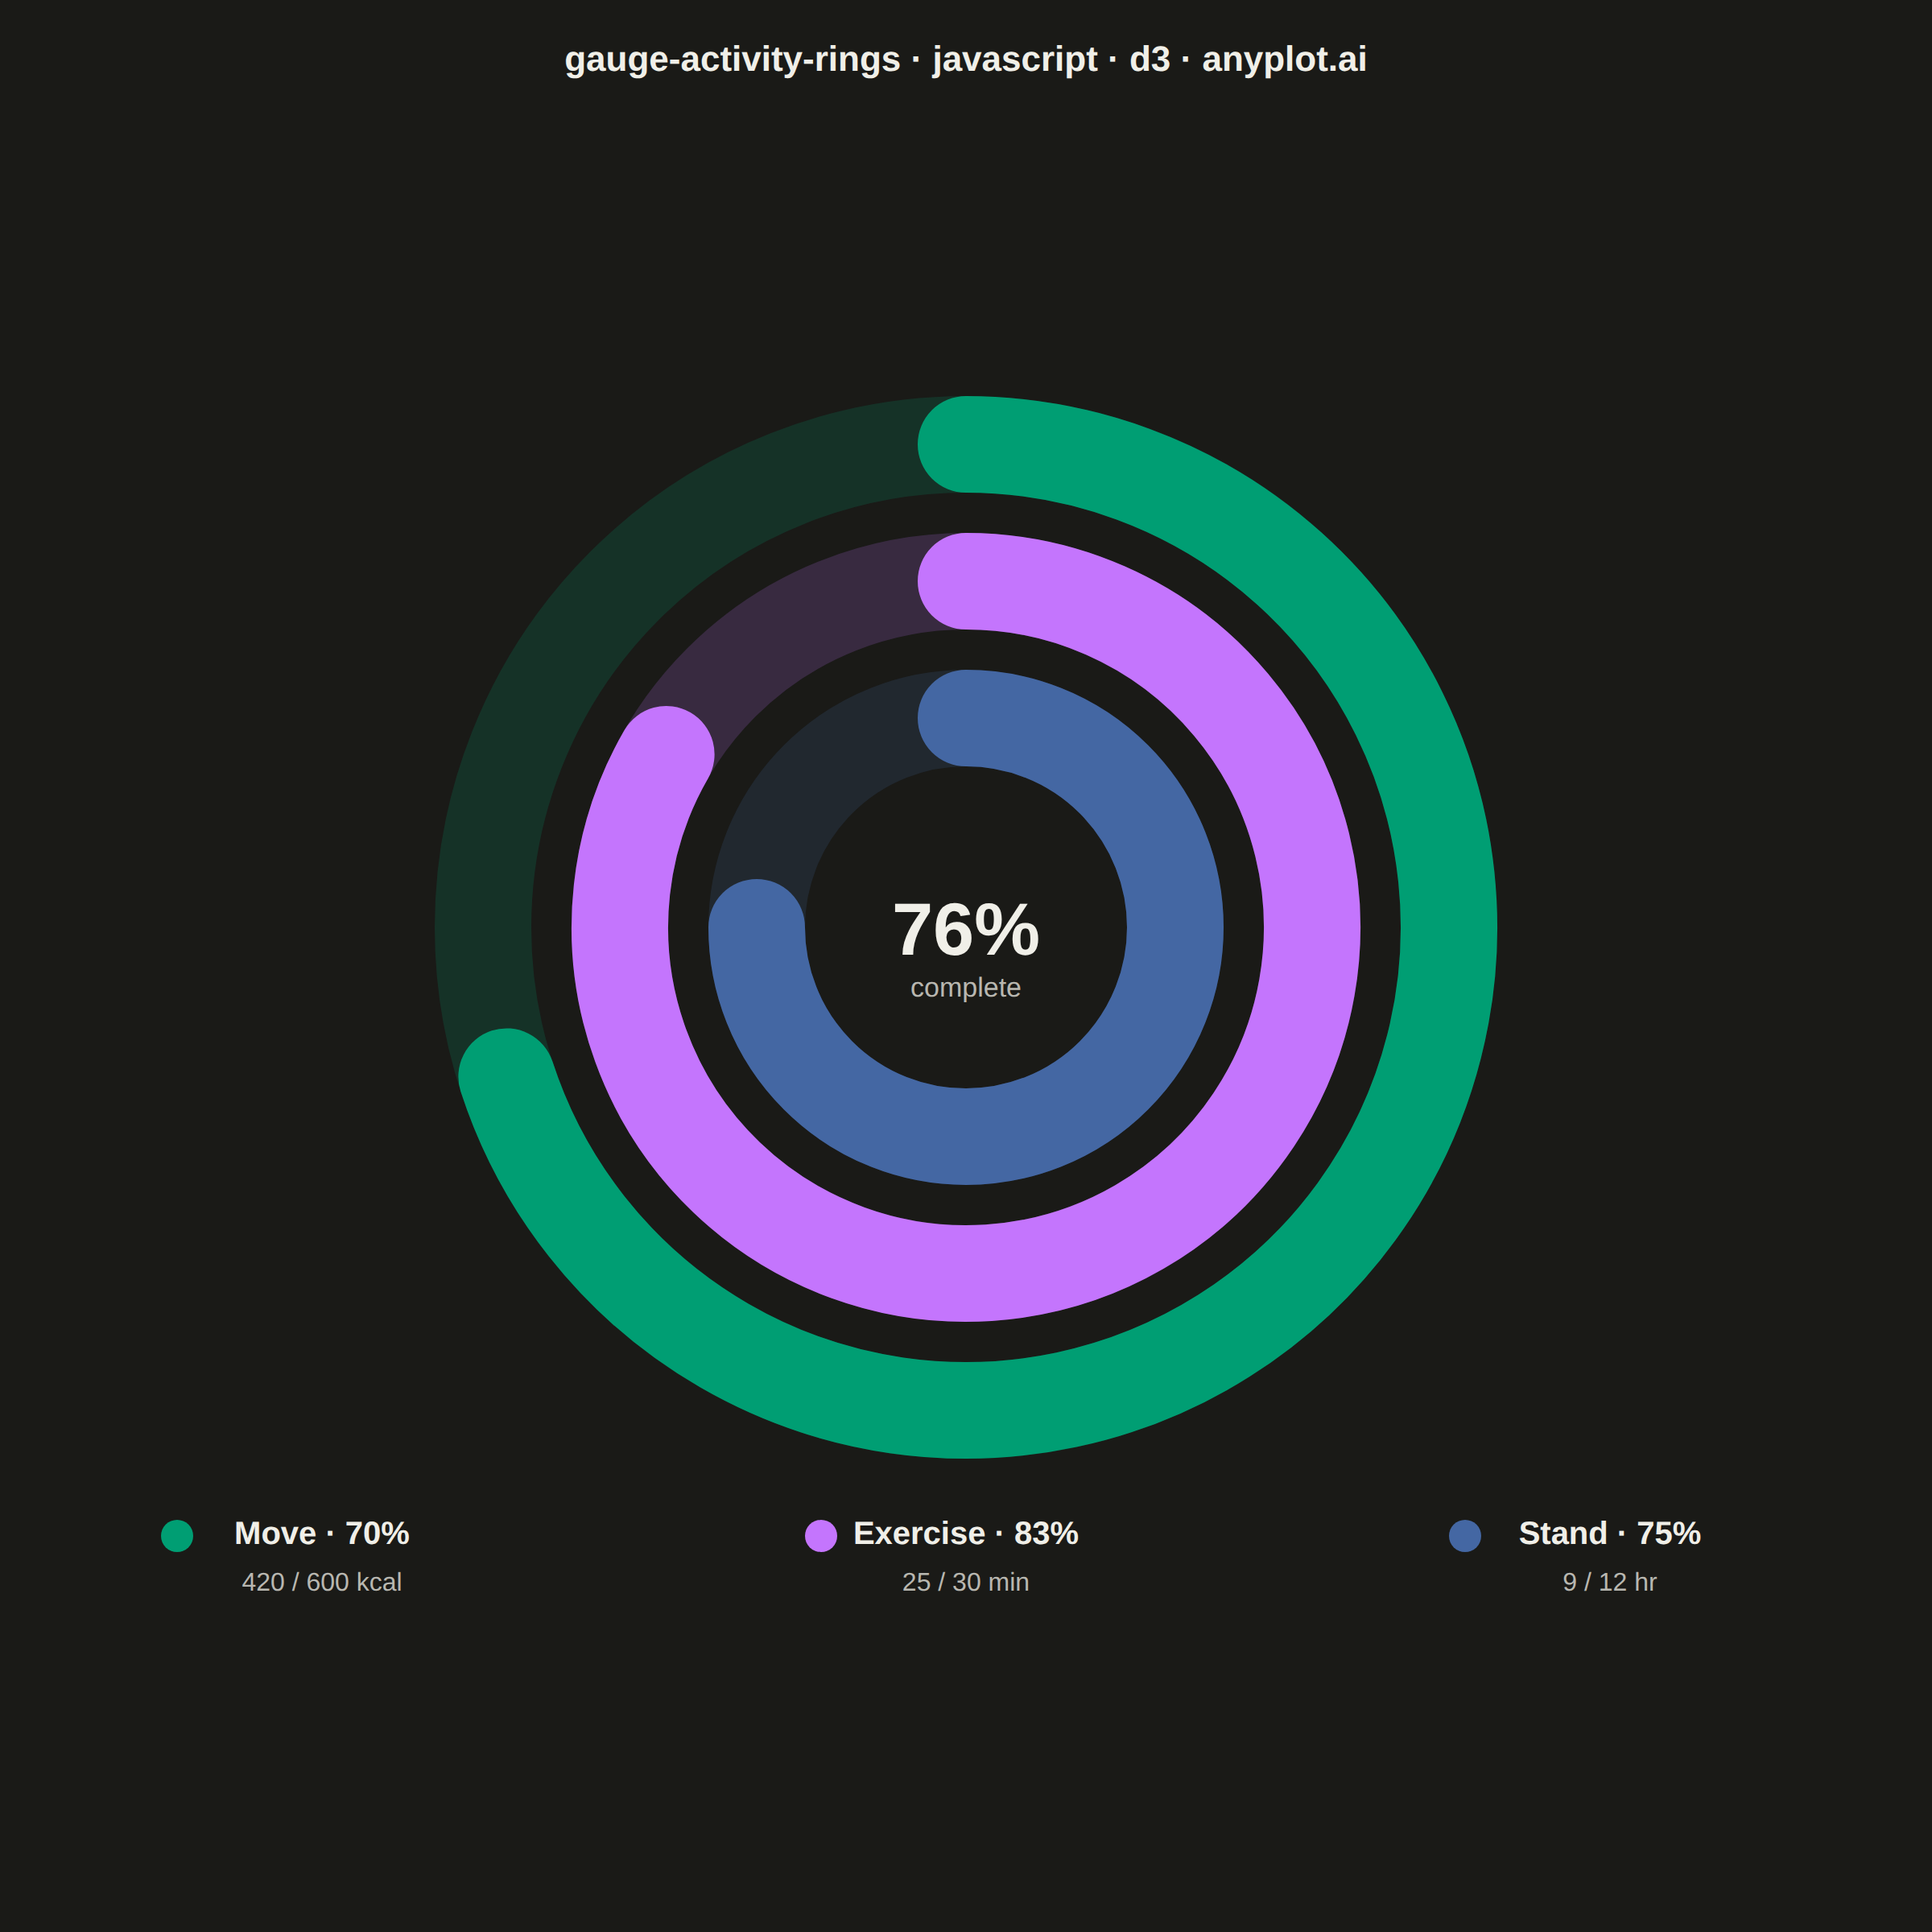
An activity rings chart displays goal completion for several metrics at once using concentric radial progress arcs, in the style popularized by fitness trackers. Each ring is a partial arc with rounded end caps that starts at the top (12 o'clock) and sweeps clockwise in proportion to how close the metric is to its goal, with a distinct color per metric and a faint background track showing the full circle. It is instantly recognizable and ideal for at-a-glance comparison of progress across a small set of related goals, filling the general radial-progress gap that needle gauges (`gauge-basic`) and polar bars (`polar-bar`) do not cover.
// anyplot.ai
// gauge-activity-rings: Activity Rings Progress Chart
// Library: d3 7.9.0 | JavaScript 22.22.3
// Quality: 89/100 | Created: 2026-06-14
//# anyplot-orientation: square

const t = window.ANYPLOT_TOKENS;
const { width, height } = window.ANYPLOT_SIZE;

// --- Data: daily fitness goals (3-ring canonical layout) --------------------
const rings = [
  { metric: "Move",     value: 420, goal: 600, unit: "kcal" },
  { metric: "Exercise", value: 25,  goal: 30,  unit: "min"  },
  { metric: "Stand",    value: 9,   goal: 12,  unit: "hr"   },
];
const colors = [t.palette[0], t.palette[1], t.palette[2]];

// --- Layout -----------------------------------------------------------------
const cx     = width / 2;
const cy     = Math.round(height * 0.48);
const strokeW = Math.round(width * 0.05);    // 60px track width at 1200 CSS px
const step    = Math.round(width * 0.0708);  // 85px center-to-center ring spacing
const outerR  = Math.round(width * 0.25);    // 300px outermost ring radius
const radii   = rings.map((_, i) => outerR - i * step);

const START = -Math.PI / 2; // 12 o'clock position

// --- SVG mount --------------------------------------------------------------
const svg = d3.select("#container")
  .append("svg")
  .attr("width", width)
  .attr("height", height);

const g = svg.append("g").attr("transform", `translate(${cx},${cy})`);

// SVG arc path for a stroke-based circular arc (supports stroke-linecap: round)
const arcPath = (r, fraction) => {
  const f = Math.min(fraction, 0.9999);
  const angle = f * 2 * Math.PI;
  const x1 = r * Math.cos(START);
  const y1 = r * Math.sin(START);
  const x2 = r * Math.cos(START + angle);
  const y2 = r * Math.sin(START + angle);
  return `M ${x1},${y1} A ${r},${r} 0 ${angle > Math.PI ? 1 : 0},1 ${x2},${y2}`;
};

// --- Draw rings (outer → inner) ---------------------------------------------
rings.forEach((d, i) => {
  const r = radii[i];
  const fraction = d.value / d.goal;
  const color = colors[i];

  // Full-circle background track
  g.append("circle")
    .attr("r", r)
    .attr("fill", "none")
    .attr("stroke", color)
    .attr("stroke-width", strokeW)
    .attr("opacity", 0.18);

  // Progress arc with rounded linecaps (iconic activity-ring look)
  g.append("path")
    .attr("d", arcPath(r, fraction))
    .attr("fill", "none")
    .attr("stroke", color)
    .attr("stroke-width", strokeW)
    .attr("stroke-linecap", "round");
});

// --- Center label: average completion ---------------------------------------
const avgPct  = Math.round(rings.reduce((s, d) => s + d.value / d.goal, 0) / rings.length * 100);
const pctSize = Math.round(width * 0.038);  // 46px
const subSize = Math.round(width * 0.014);  // 17px

g.append("text")
  .attr("text-anchor", "middle")
  .attr("y", Math.round(pctSize * 0.36))
  .attr("fill", t.ink)
  .style("font-size", `${pctSize}px`)
  .style("font-weight", "700")
  .text(`${avgPct}%`);

g.append("text")
  .attr("text-anchor", "middle")
  .attr("y", Math.round(pctSize * 0.36 + subSize + 9))
  .attr("fill", t.inkSoft)
  .style("font-size", `${subSize}px`)
  .text("complete");

// --- Legend below rings -----------------------------------------------------
const legendY  = Math.round(cy + outerR + strokeW / 2 + height * 0.04);
const colW     = Math.round(width / 3);
const nameSize = Math.round(width * 0.017);  // 20px
const valSize  = Math.round(width * 0.013);  // 16px
const dotR     = Math.round(width * 0.008);  // 10px

rings.forEach((d, i) => {
  const lx   = colW * i + colW / 2;
  const pct  = Math.round(d.value / d.goal * 100);
  const color = colors[i];

  svg.append("circle")
    .attr("cx", lx - Math.round(nameSize * 4.5))
    .attr("cy", legendY)
    .attr("r", dotR)
    .attr("fill", color);

  svg.append("text")
    .attr("x", lx)
    .attr("y", legendY + 5)
    .attr("text-anchor", "middle")
    .attr("fill", t.ink)
    .style("font-size", `${nameSize}px`)
    .style("font-weight", "600")
    .text(`${d.metric}  ·  ${pct}%`);

  svg.append("text")
    .attr("x", lx)
    .attr("y", legendY + nameSize + 14)
    .attr("text-anchor", "middle")
    .attr("fill", t.inkSoft)
    .style("font-size", `${valSize}px`)
    .text(`${d.value} / ${d.goal} ${d.unit}`);
});

// --- Title ------------------------------------------------------------------
svg.append("text")
  .attr("x", width / 2)
  .attr("y", 44)
  .attr("text-anchor", "middle")
  .attr("fill", t.ink)
  .style("font-size", "22px")
  .style("font-weight", "600")
  .text("gauge-activity-rings · javascript · d3 · anyplot.ai");
Runnable source as JSON, for any HTTP client: https://api.anyplot.ai/specs/gauge-activity-rings/d3/code. Any spec id and library id listed in llms-full.txt fit the same URL shape; every URL below is complete and callable.
{
  "spec_id": "gauge-activity-rings",
  "language": "javascript",
  "library": "d3",
  "page": "https://anyplot.ai/gauge-activity-rings/javascript/d3",
  "hub": "https://anyplot.ai/gauge-activity-rings",
  "code_json": "https://api.anyplot.ai/specs/gauge-activity-rings/d3/code",
  "spec_json": "https://api.anyplot.ai/specs/gauge-activity-rings",
  "render_light_png": "https://storage.googleapis.com/anyplot-images/plots/gauge-activity-rings/javascript/d3/plot-light.png",
  "render_dark_png": "https://storage.googleapis.com/anyplot-images/plots/gauge-activity-rings/javascript/d3/plot-dark.png",
  "interactive_light_html": "https://storage.googleapis.com/anyplot-images/plots/gauge-activity-rings/javascript/d3/plot-light.html",
  "interactive_dark_html": "https://storage.googleapis.com/anyplot-images/plots/gauge-activity-rings/javascript/d3/plot-dark.html",
  "quality_score": 89.0,
  "license": "MIT",
  "guide": "https://anyplot.ai/llms.txt"
}
Part of Activity Rings Progress Chart on anyplot.ai.