The same plot in 14 other libraries — JavaScript: D3.js, Apache ECharts, Highcharts, MUI X Charts; Python: Altair, Bokeh, lets-plot, Matplotlib, Plotly, plotnine, Pygal, Seaborn; R: ggplot2; Julia: Makie.jl. Compare all 15 side by side: Actuarial Loss Development Triangle in Python, R, Julia and JavaScript.
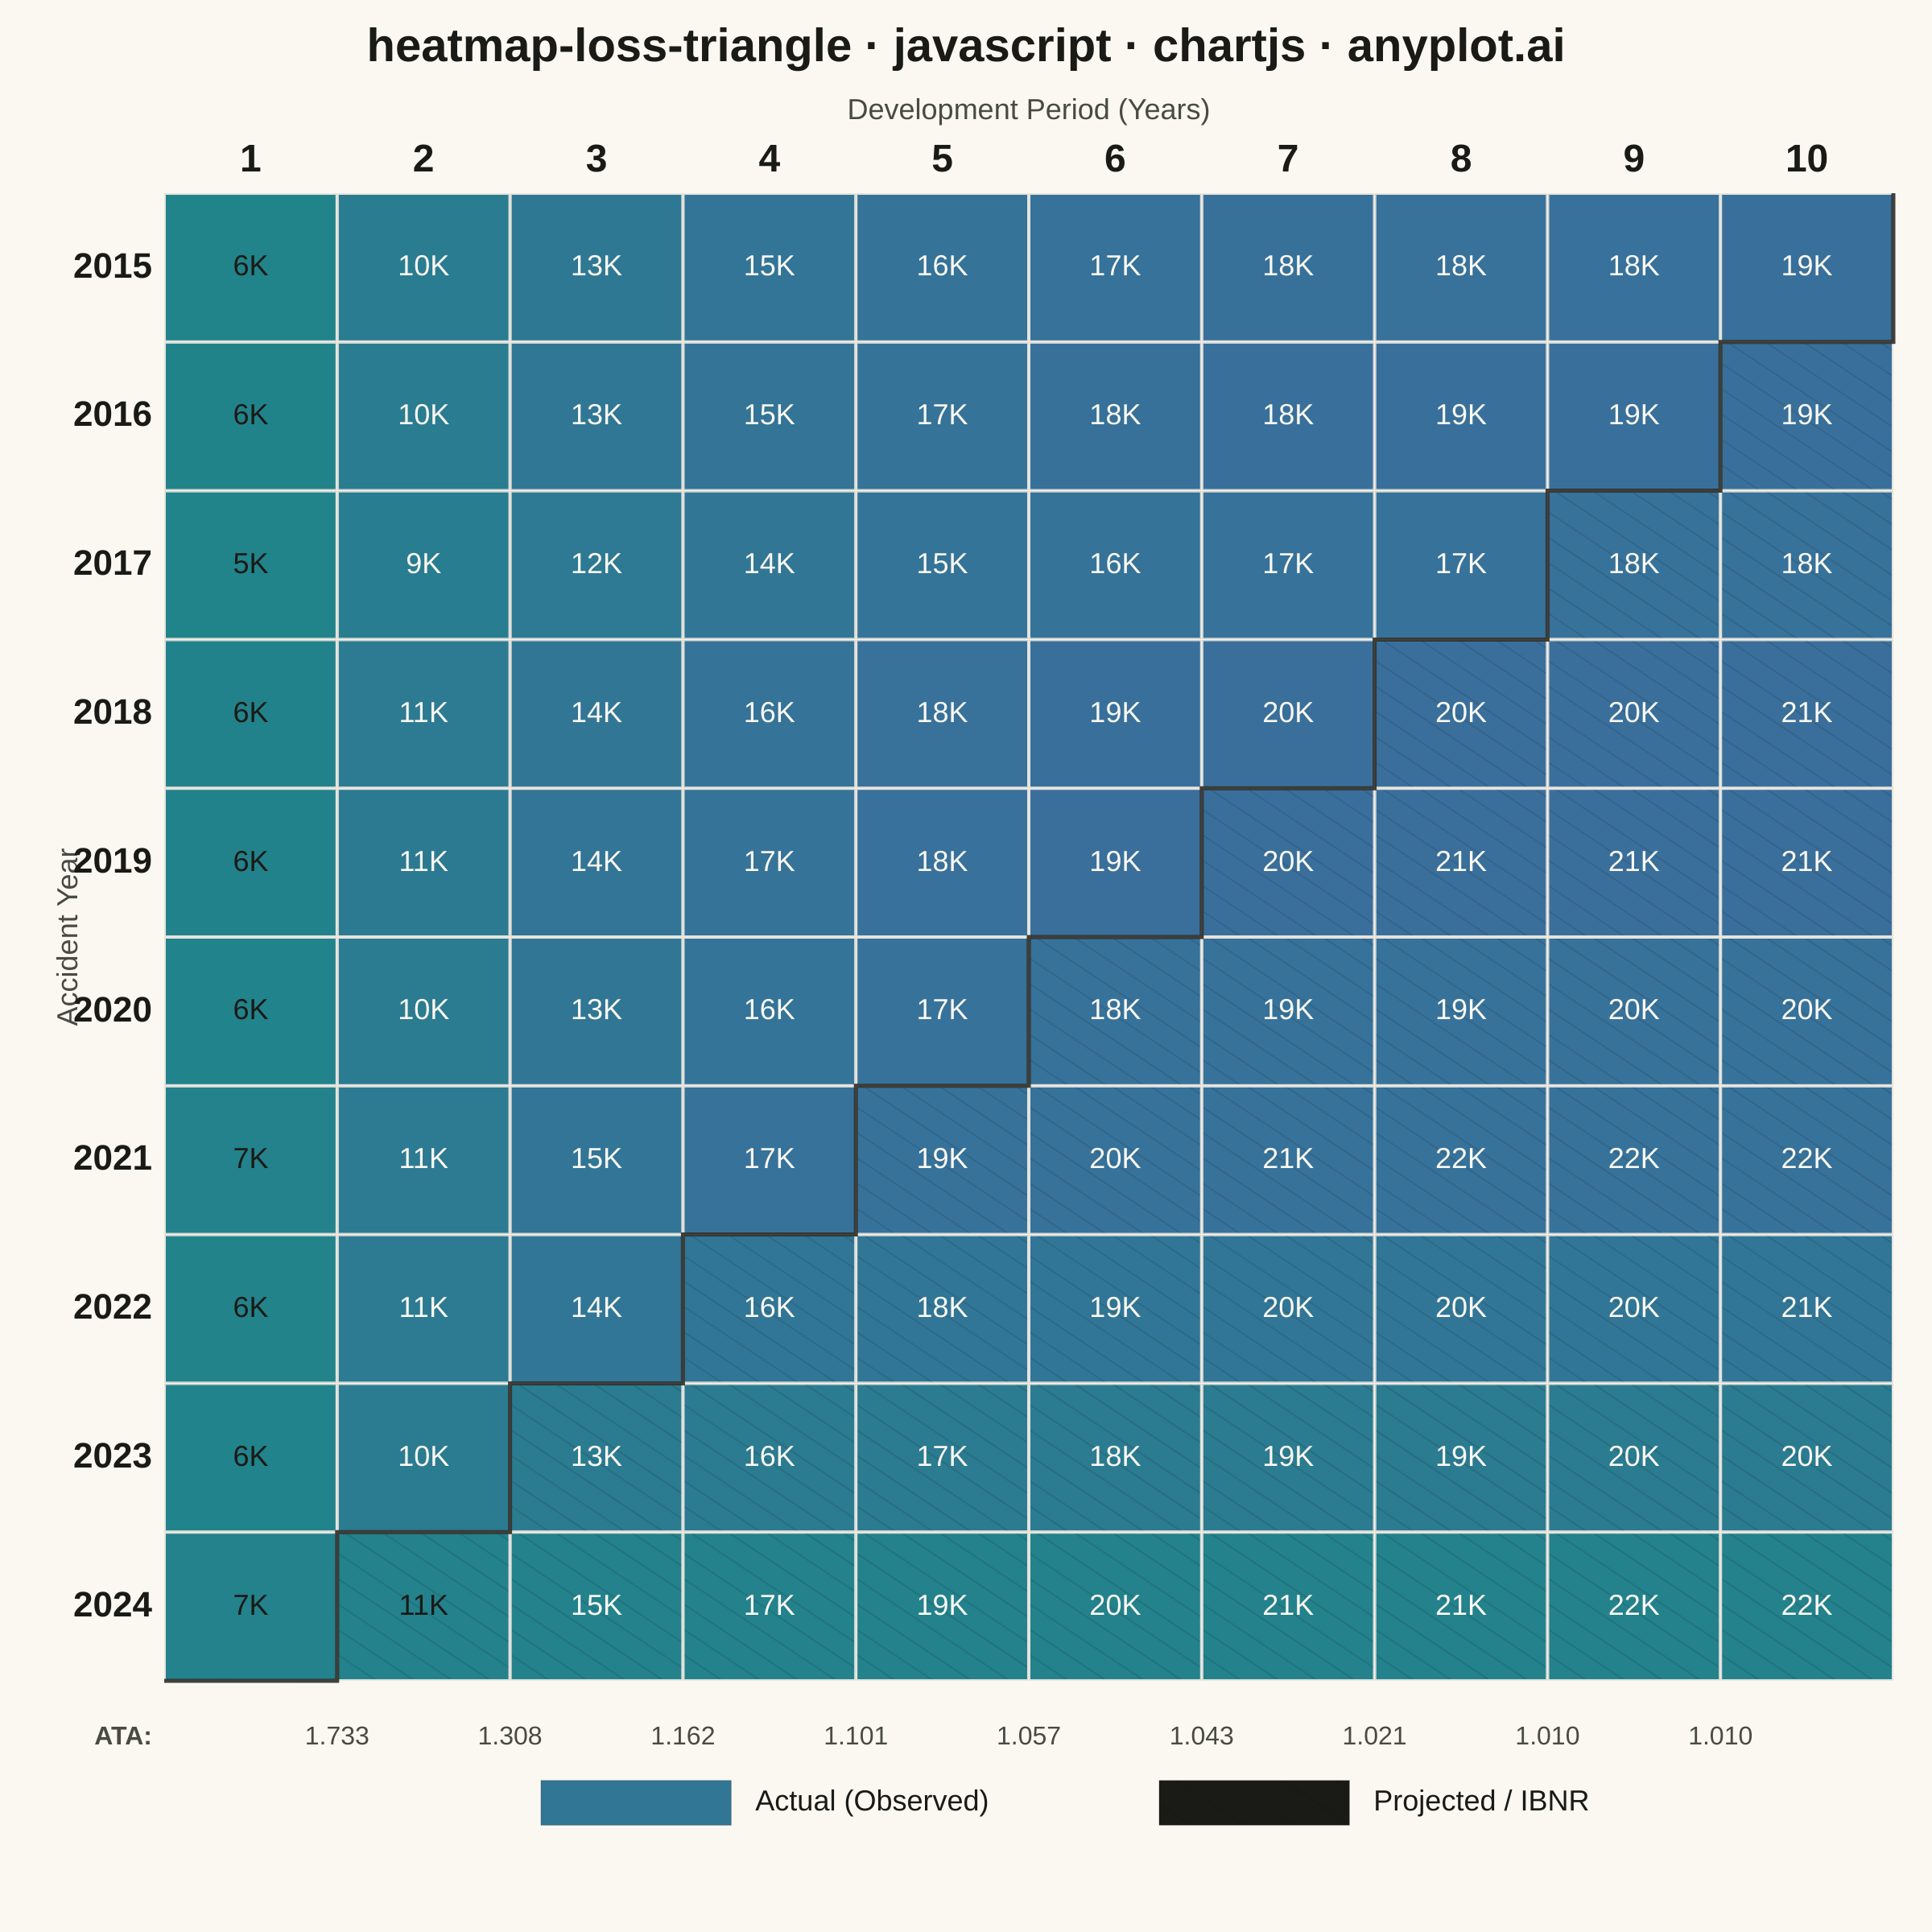
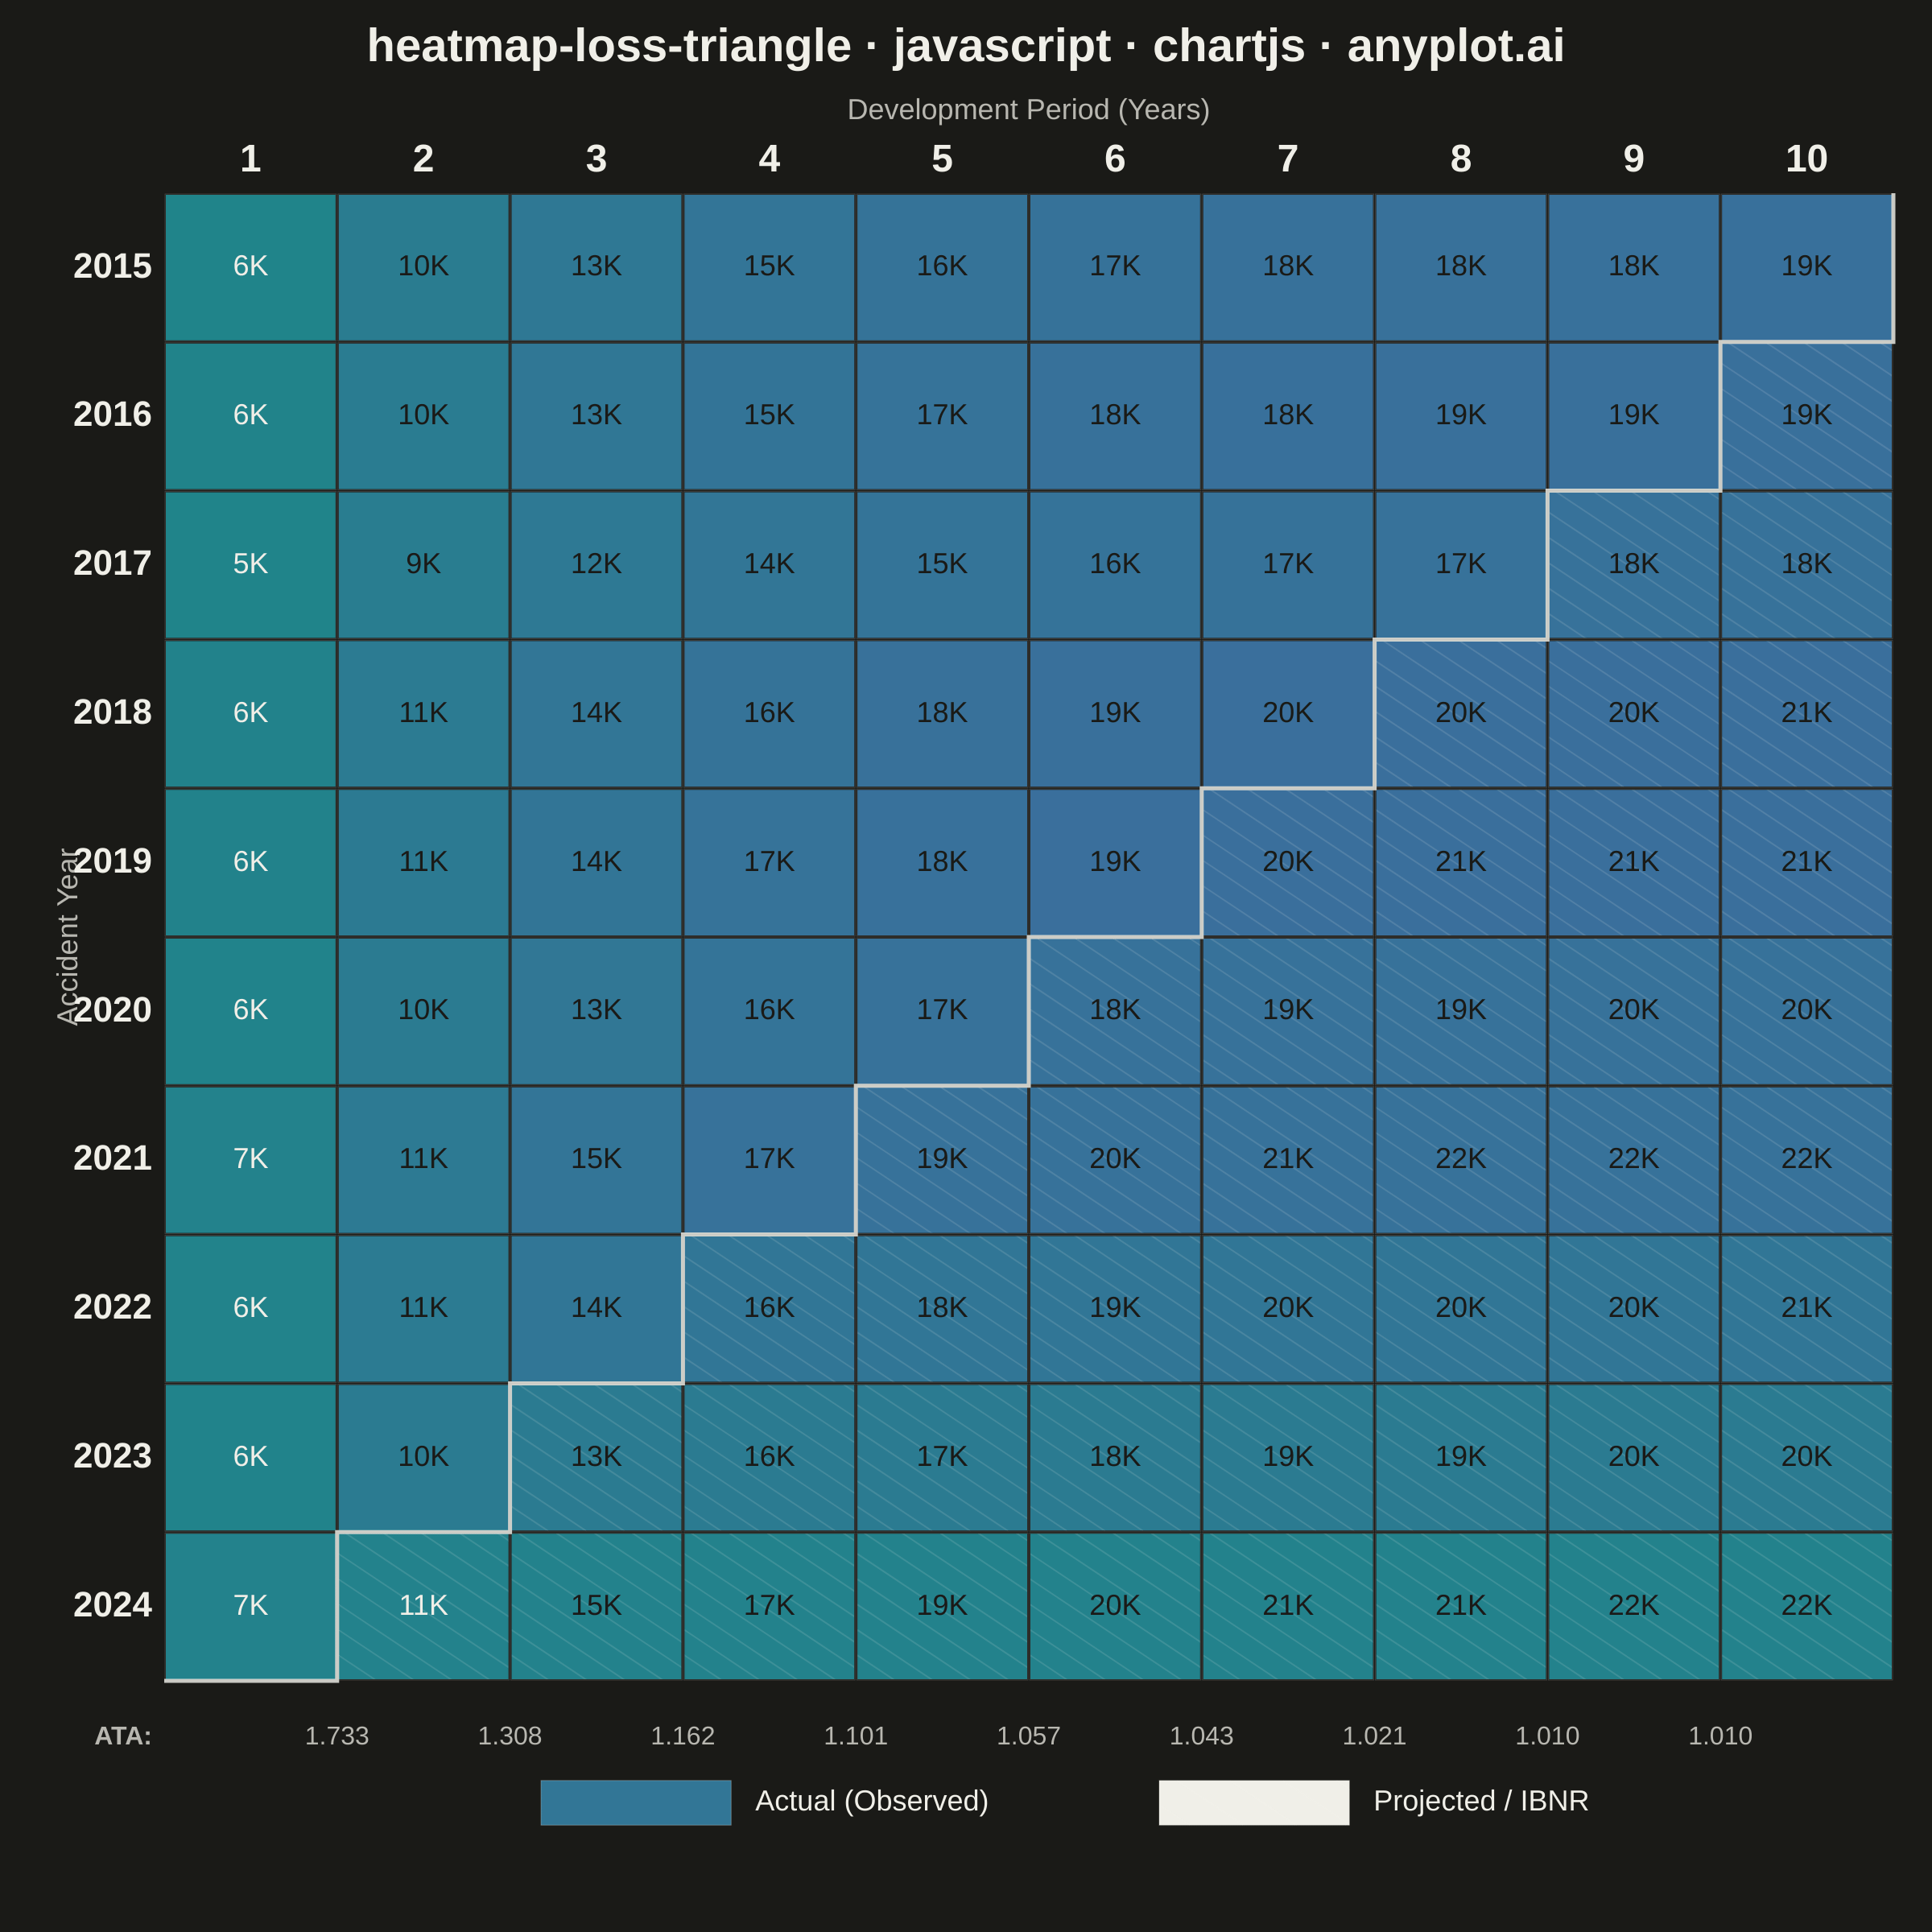
A triangular matrix visualization showing cumulative insurance claim payments developing over time. Rows represent accident/origin years, columns represent development periods (e.g., 1-10 years), with the upper-left triangle displaying actual observed cumulative claims and the lower-right triangle showing projected/estimated values (IBNR). This plot is essential for actuarial reserving, enabling analysts to visualize the chain-ladder method and identify development patterns in loss data.
// anyplot.ai
// heatmap-loss-triangle: Actuarial Loss Development Triangle
// Library: chartjs 4.4.7 | JavaScript 22.22.3
// Quality: 91/100 | Created: 2026-06-03
//# anyplot-orientation: square

const t = window.ANYPLOT_TOKENS;
const THEME = window.ANYPLOT_THEME;

// --- Data -------------------------------------------------------------------
const accidentYears = [2015, 2016, 2017, 2018, 2019, 2020, 2021, 2022, 2023, 2024];
const devPeriods    = [1, 2, 3, 4, 5, 6, 7, 8, 9, 10];
const ROWS = 10, COLS = 10;

// Base ultimate losses ($thousands) per accident year
const ultimates = [18500, 19200, 17800, 20600, 21100, 19800, 22000, 20500, 19700, 21800];

// Cumulative development pattern (fraction of ultimate reported by each period)
const devPct = [0.30, 0.52, 0.68, 0.79, 0.87, 0.92, 0.96, 0.98, 0.99, 1.00];

// Build loss triangle — upper-left actual, lower-right projected
const cumulative = [], isProjected = [];
for (let r = 0; r < ROWS; r++) {
    cumulative[r] = [];
    isProjected[r] = [];
    for (let c = 0; c < COLS; c++) {
        cumulative[r][c] = Math.round(ultimates[r] * devPct[c]);
        isProjected[r][c] = (r + c) >= ROWS;
    }
}

// Volume-weighted age-to-age factors (only actual observations)
const ataFactors = [];
for (let c = 0; c < COLS - 1; c++) {
    let num = 0, den = 0;
    for (let r = 0; r < ROWS; r++) {
        if (r + c < ROWS - 1) {
            den += cumulative[r][c];
            num += cumulative[r][c + 1];
        }
    }
    ataFactors[c] = den > 0 ? num / den : null;
}

const maxVal = Math.max(...cumulative.flat());

// Interpolate between two hex colors
function lerpColor(hex1, hex2, f) {
    const parse = h => [parseInt(h.slice(1,3),16), parseInt(h.slice(3,5),16), parseInt(h.slice(5,7),16)];
    const [r1,g1,b1] = parse(hex1);
    const [r2,g2,b2] = parse(hex2);
    return `rgb(${Math.round(r1+(r2-r1)*f)},${Math.round(g1+(g2-g1)*f)},${Math.round(b1+(b2-b1)*f)})`;
}

// imprint_seq fill — projected cells blended toward page bg for visual distinction
function cellFill(value, proj) {
    const ratio = Math.pow(value / maxVal, 0.5);
    const base  = lerpColor(t.seq[0], t.seq[1], ratio * 0.85 + 0.05);
    return proj ? lerpColor(t.pageBg, base, 0.68) : base;
}

function fmtK(v) { return v >= 1000 ? (v / 1000).toFixed(0) + 'K' : String(v); }

// --- Custom drawing plugin --------------------------------------------------
const trianglePlugin = {
    id: 'lossTriangle',
    beforeDraw(chart) {
        const { ctx, width, height } = chart;
        ctx.fillStyle = t.pageBg;
        ctx.fillRect(0, 0, width, height);
    },
    afterDraw(chart) {
        const { ctx, width, height } = chart;

        // Layout proportions
        const mTop   = height * 0.10;
        const mBot   = height * 0.13;
        const mLeft  = width  * 0.085;
        const mRight = width  * 0.02;
        const gX = mLeft, gY = mTop;
        const gW = width  - mLeft - mRight;
        const gH = height - mTop  - mBot;
        const cW = gW / COLS, cH = gH / ROWS;

        // Title
        const title     = 'heatmap-loss-triangle · javascript · chartjs · anyplot.ai';
        const titleSize = Math.round(Math.min(width, height) * 0.024);
        ctx.save();
        ctx.font         = `bold ${titleSize}px sans-serif`;
        ctx.fillStyle    = t.ink;
        ctx.textAlign    = 'center';
        ctx.textBaseline = 'top';
        ctx.fillText(title, width / 2, height * 0.013);
        ctx.restore();

        // Column axis label
        const axisLblSize = Math.round(cW * 0.17);
        ctx.save();
        ctx.font         = `${axisLblSize}px sans-serif`;
        ctx.fillStyle    = t.inkSoft;
        ctx.textAlign    = 'center';
        ctx.textBaseline = 'middle';
        ctx.fillText('Development Period (Years)', gX + gW / 2, gY - cH * 0.55);
        ctx.restore();

        // Column headers
        const hdrSize = Math.round(cW * 0.22);
        ctx.save();
        ctx.font         = `bold ${hdrSize}px sans-serif`;
        ctx.fillStyle    = t.ink;
        ctx.textAlign    = 'center';
        ctx.textBaseline = 'middle';
        for (let c = 0; c < COLS; c++) {
            ctx.fillText(devPeriods[c], gX + c * cW + cW / 2, gY - cH * 0.22);
        }
        ctx.restore();

        // Row axis label (rotated)
        ctx.save();
        ctx.translate(gX - mLeft * 0.58, gY + gH / 2);
        ctx.rotate(-Math.PI / 2);
        ctx.font         = `${axisLblSize}px sans-serif`;
        ctx.fillStyle    = t.inkSoft;
        ctx.textAlign    = 'center';
        ctx.textBaseline = 'middle';
        ctx.fillText('Accident Year', 0, 0);
        ctx.restore();

        // Row headers
        const rowHdrSize = Math.round(cH * 0.24);
        ctx.save();
        ctx.font         = `bold ${rowHdrSize}px sans-serif`;
        ctx.fillStyle    = t.ink;
        ctx.textAlign    = 'right';
        ctx.textBaseline = 'middle';
        for (let r = 0; r < ROWS; r++) {
            ctx.fillText(accidentYears[r], gX - cW * 0.07, gY + r * cH + cH / 2);
        }
        ctx.restore();

        // Draw all cells
        const valSize = Math.round(Math.min(cW, cH) * 0.20);
        for (let r = 0; r < ROWS; r++) {
            for (let c = 0; c < COLS; c++) {
                const cx   = gX + c * cW;
                const cy   = gY + r * cH;
                const val  = cumulative[r][c];
                const proj = isProjected[r][c];

                ctx.fillStyle = cellFill(val, proj);
                ctx.fillRect(cx + 1, cy + 1, cW - 2, cH - 2);

                // Diagonal hatching on projected cells
                if (proj) {
                    ctx.save();
                    ctx.beginPath();
                    ctx.rect(cx + 1, cy + 1, cW - 2, cH - 2);
                    ctx.clip();
                    ctx.globalAlpha    = 0.13;
                    ctx.strokeStyle    = THEME === 'light' ? '#1A1A17' : '#F0EFE8';
                    ctx.lineWidth      = 1;
                    const sp = cW * 0.22;
                    for (let d = -cH * 2; d < cW * 2; d += sp) {
                        ctx.beginPath();
                        ctx.moveTo(cx + d, cy);
                        ctx.lineTo(cx + d + cH * 1.5, cy + cH);
                        ctx.stroke();
                    }
                    ctx.restore();
                }

                // Cell border
                ctx.strokeStyle = THEME === 'light' ? 'rgba(26,26,23,0.18)' : 'rgba(240,239,232,0.18)';
                ctx.lineWidth   = 0.5;
                ctx.strokeRect(cx + 0.5, cy + 0.5, cW - 1, cH - 1);

                // Cell value text
                const ratio   = Math.pow(val / maxVal, 0.5);
                const darkBg  = (ratio > 0.55 && !proj) || (ratio > 0.72 && proj);
                ctx.save();
                ctx.font         = `${valSize}px sans-serif`;
                ctx.fillStyle    = darkBg ? t.pageBg : t.ink;
                ctx.textAlign    = 'center';
                ctx.textBaseline = 'middle';
                ctx.fillText(fmtK(val), cx + cW / 2, cy + cH / 2);
                ctx.restore();
            }
        }

        // Step diagonal: boundary between actual (upper-left) and projected (lower-right)
        ctx.save();
        ctx.strokeStyle = THEME === 'light' ? 'rgba(26,26,23,0.82)' : 'rgba(240,239,232,0.82)';
        ctx.lineWidth   = 2.5;
        ctx.lineJoin    = 'miter';
        ctx.beginPath();
        ctx.moveTo(gX + COLS * cW, gY);
        for (let r = 0; r < ROWS; r++) {
            const bx = gX + (ROWS - r) * cW;
            ctx.lineTo(bx, gY + (r + 1) * cH);
            if (r < ROWS - 1) ctx.lineTo(gX + (ROWS - r - 1) * cW, gY + (r + 1) * cH);
        }
        ctx.lineTo(gX, gY + ROWS * cH);
        ctx.stroke();
        ctx.restore();

        // ATA factors row
        const ataSize = Math.round(cH * 0.17);
        const ataY    = gY + gH + cH * 0.38;
        ctx.save();
        ctx.font         = `bold ${ataSize}px sans-serif`;
        ctx.fillStyle    = t.inkSoft;
        ctx.textAlign    = 'right';
        ctx.textBaseline = 'middle';
        ctx.fillText('ATA:', gX - cW * 0.07, ataY);
        ctx.font      = `${ataSize}px sans-serif`;
        ctx.textAlign = 'center';
        for (let c = 0; c < COLS - 1; c++) {
            const f = ataFactors[c];
            if (f != null) ctx.fillText(f.toFixed(3), gX + (c + 1) * cW, ataY);
        }
        ctx.restore();

        // Legend
        const legY   = gY + gH + cH * 0.82;
        const boxW   = cW * 1.1, boxH = cH * 0.30;
        const legSize = Math.round(cH * 0.19);

        // Actual swatch
        const legX1 = width * 0.28;
        ctx.fillStyle = cellFill(maxVal * 0.65, false);
        ctx.fillRect(legX1, legY - boxH / 2, boxW, boxH);
        ctx.strokeStyle = THEME === 'light' ? 'rgba(26,26,23,0.3)' : 'rgba(240,239,232,0.3)';
        ctx.lineWidth   = 0.5;
        ctx.strokeRect(legX1, legY - boxH / 2, boxW, boxH);
        ctx.font         = `${legSize}px sans-serif`;
        ctx.fillStyle    = t.ink;
        ctx.textAlign    = 'left';
        ctx.textBaseline = 'middle';
        ctx.fillText('Actual (Observed)', legX1 + boxW + cW * 0.14, legY);

        // Projected swatch
        const legX2 = width * 0.60;
        ctx.fillStyle = cellFill(maxVal * 0.5, true);
        ctx.fillRect(legX2, legY - boxH / 2, boxW, boxH);
        ctx.save();
        ctx.beginPath();
        ctx.rect(legX2, legY - boxH / 2, boxW, boxH);
        ctx.clip();
        ctx.globalAlpha  = 0.15;
        ctx.strokeStyle  = THEME === 'light' ? '#1A1A17' : '#F0EFE8';
        ctx.lineWidth    = 1;
        const sp2 = boxW * 0.28;
        for (let d = -boxH * 2; d < boxW * 2; d += sp2) {
            ctx.beginPath();
            ctx.moveTo(legX2 + d, legY - boxH / 2);
            ctx.lineTo(legX2 + d + boxH * 1.5, legY + boxH / 2);
            ctx.stroke();
        }
        ctx.restore();
        ctx.strokeStyle = THEME === 'light' ? 'rgba(26,26,23,0.3)' : 'rgba(240,239,232,0.3)';
        ctx.lineWidth   = 0.5;
        ctx.strokeRect(legX2, legY - boxH / 2, boxW, boxH);
        ctx.font         = `${legSize}px sans-serif`;
        ctx.fillStyle    = t.ink;
        ctx.textAlign    = 'left';
        ctx.textBaseline = 'middle';
        ctx.fillText('Projected / IBNR', legX2 + boxW + cW * 0.14, legY);
    }
};

// --- Mount ------------------------------------------------------------------
const canvas = document.createElement('canvas');
document.getElementById('container').appendChild(canvas);

// --- Chart ------------------------------------------------------------------
new Chart(canvas, {
    type: 'scatter',
    data: { datasets: [] },
    plugins: [trianglePlugin],
    options: {
        responsive: true,
        maintainAspectRatio: false,
        animation: false,
        plugins: {
            legend:  { display: false },
            title:   { display: false },
            tooltip: { enabled: false },
        },
        scales: {
            x: { display: false },
            y: { display: false },
        },
    },
});
Runnable source as JSON, for any HTTP client: https://api.anyplot.ai/specs/heatmap-loss-triangle/chartjs/code. Any spec id and library id listed in llms-full.txt fit the same URL shape; every URL below is complete and callable.
{
  "spec_id": "heatmap-loss-triangle",
  "language": "javascript",
  "library": "chartjs",
  "page": "https://anyplot.ai/heatmap-loss-triangle/javascript/chartjs",
  "hub": "https://anyplot.ai/heatmap-loss-triangle",
  "code_json": "https://api.anyplot.ai/specs/heatmap-loss-triangle/chartjs/code",
  "spec_json": "https://api.anyplot.ai/specs/heatmap-loss-triangle",
  "render_light_png": "https://storage.googleapis.com/anyplot-images/plots/heatmap-loss-triangle/javascript/chartjs/plot-light.png",
  "render_dark_png": "https://storage.googleapis.com/anyplot-images/plots/heatmap-loss-triangle/javascript/chartjs/plot-dark.png",
  "interactive_light_html": "https://storage.googleapis.com/anyplot-images/plots/heatmap-loss-triangle/javascript/chartjs/plot-light.html",
  "interactive_dark_html": "https://storage.googleapis.com/anyplot-images/plots/heatmap-loss-triangle/javascript/chartjs/plot-dark.html",
  "quality_score": 91.0,
  "license": "MIT",
  "guide": "https://anyplot.ai/llms.txt"
}
Part of Actuarial Loss Development Triangle on anyplot.ai.