The same plot in 14 other libraries — JavaScript: Chart.js, D3.js, Apache ECharts, MUI X Charts; Python: Altair, Bokeh, lets-plot, Matplotlib, Plotly, plotnine, Pygal, Seaborn; R: ggplot2; Julia: Makie.jl. Compare all 15 side by side: Actuarial Loss Development Triangle in Python, R, Julia and JavaScript.
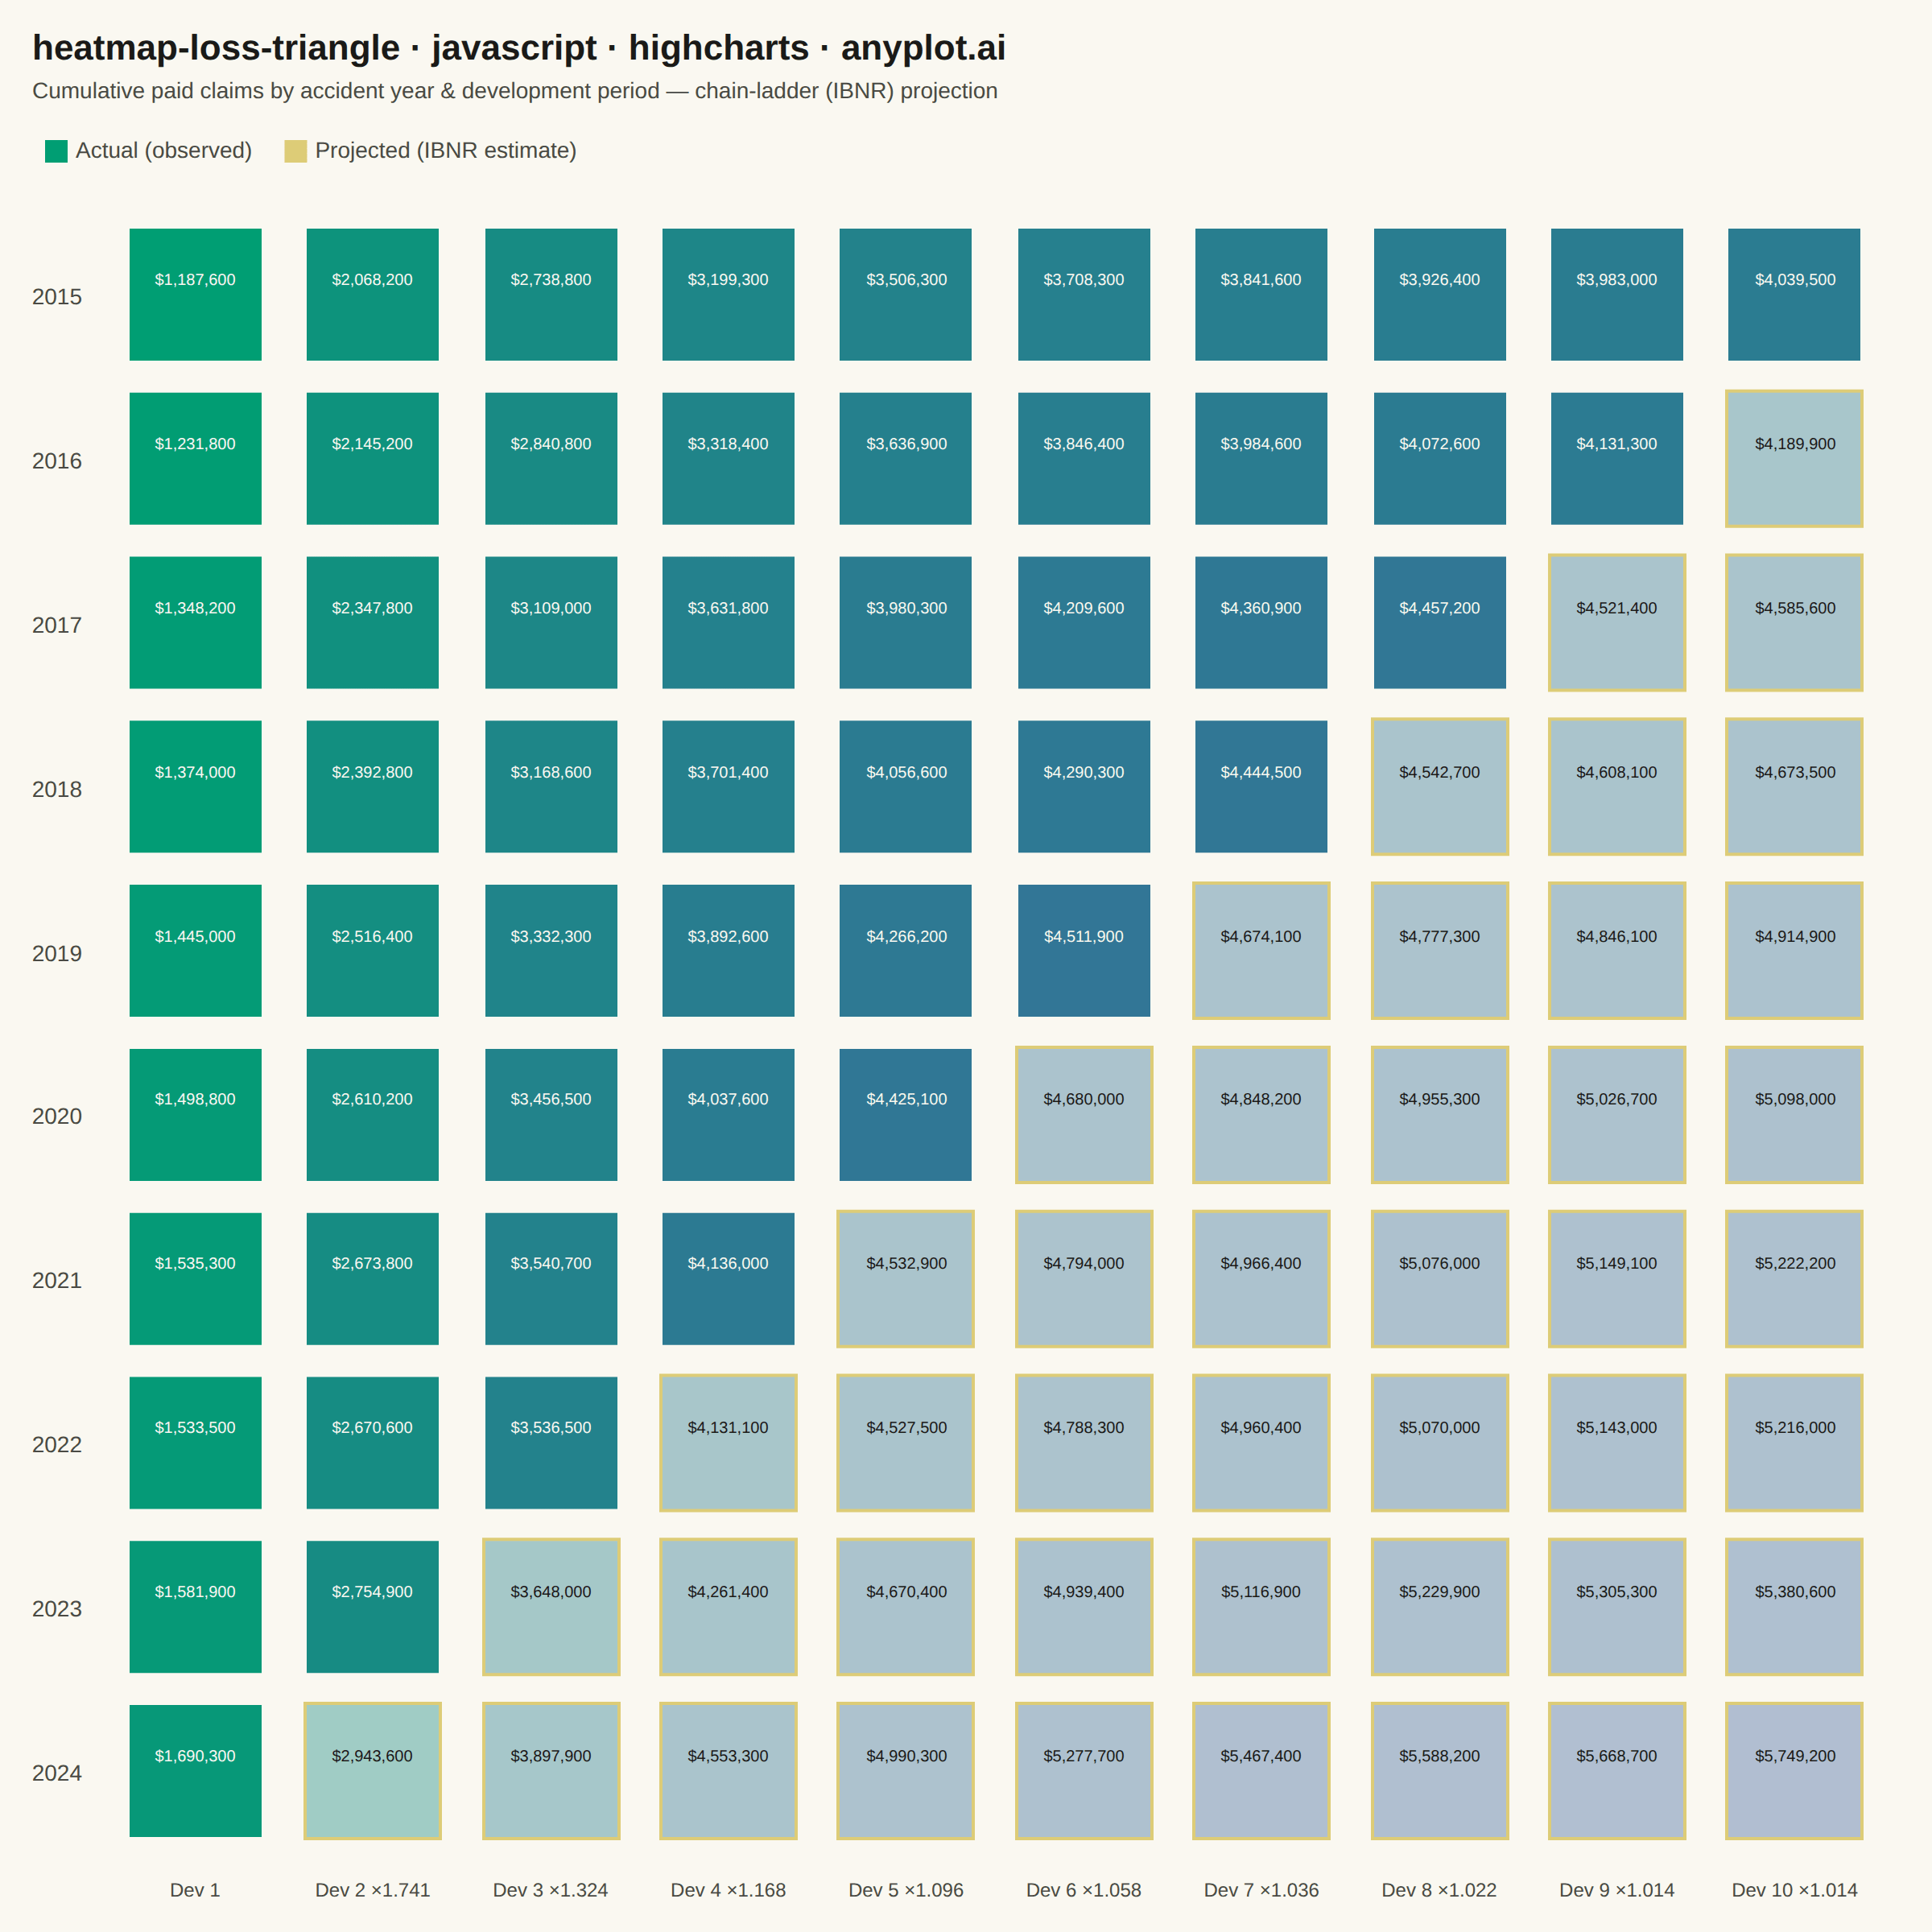
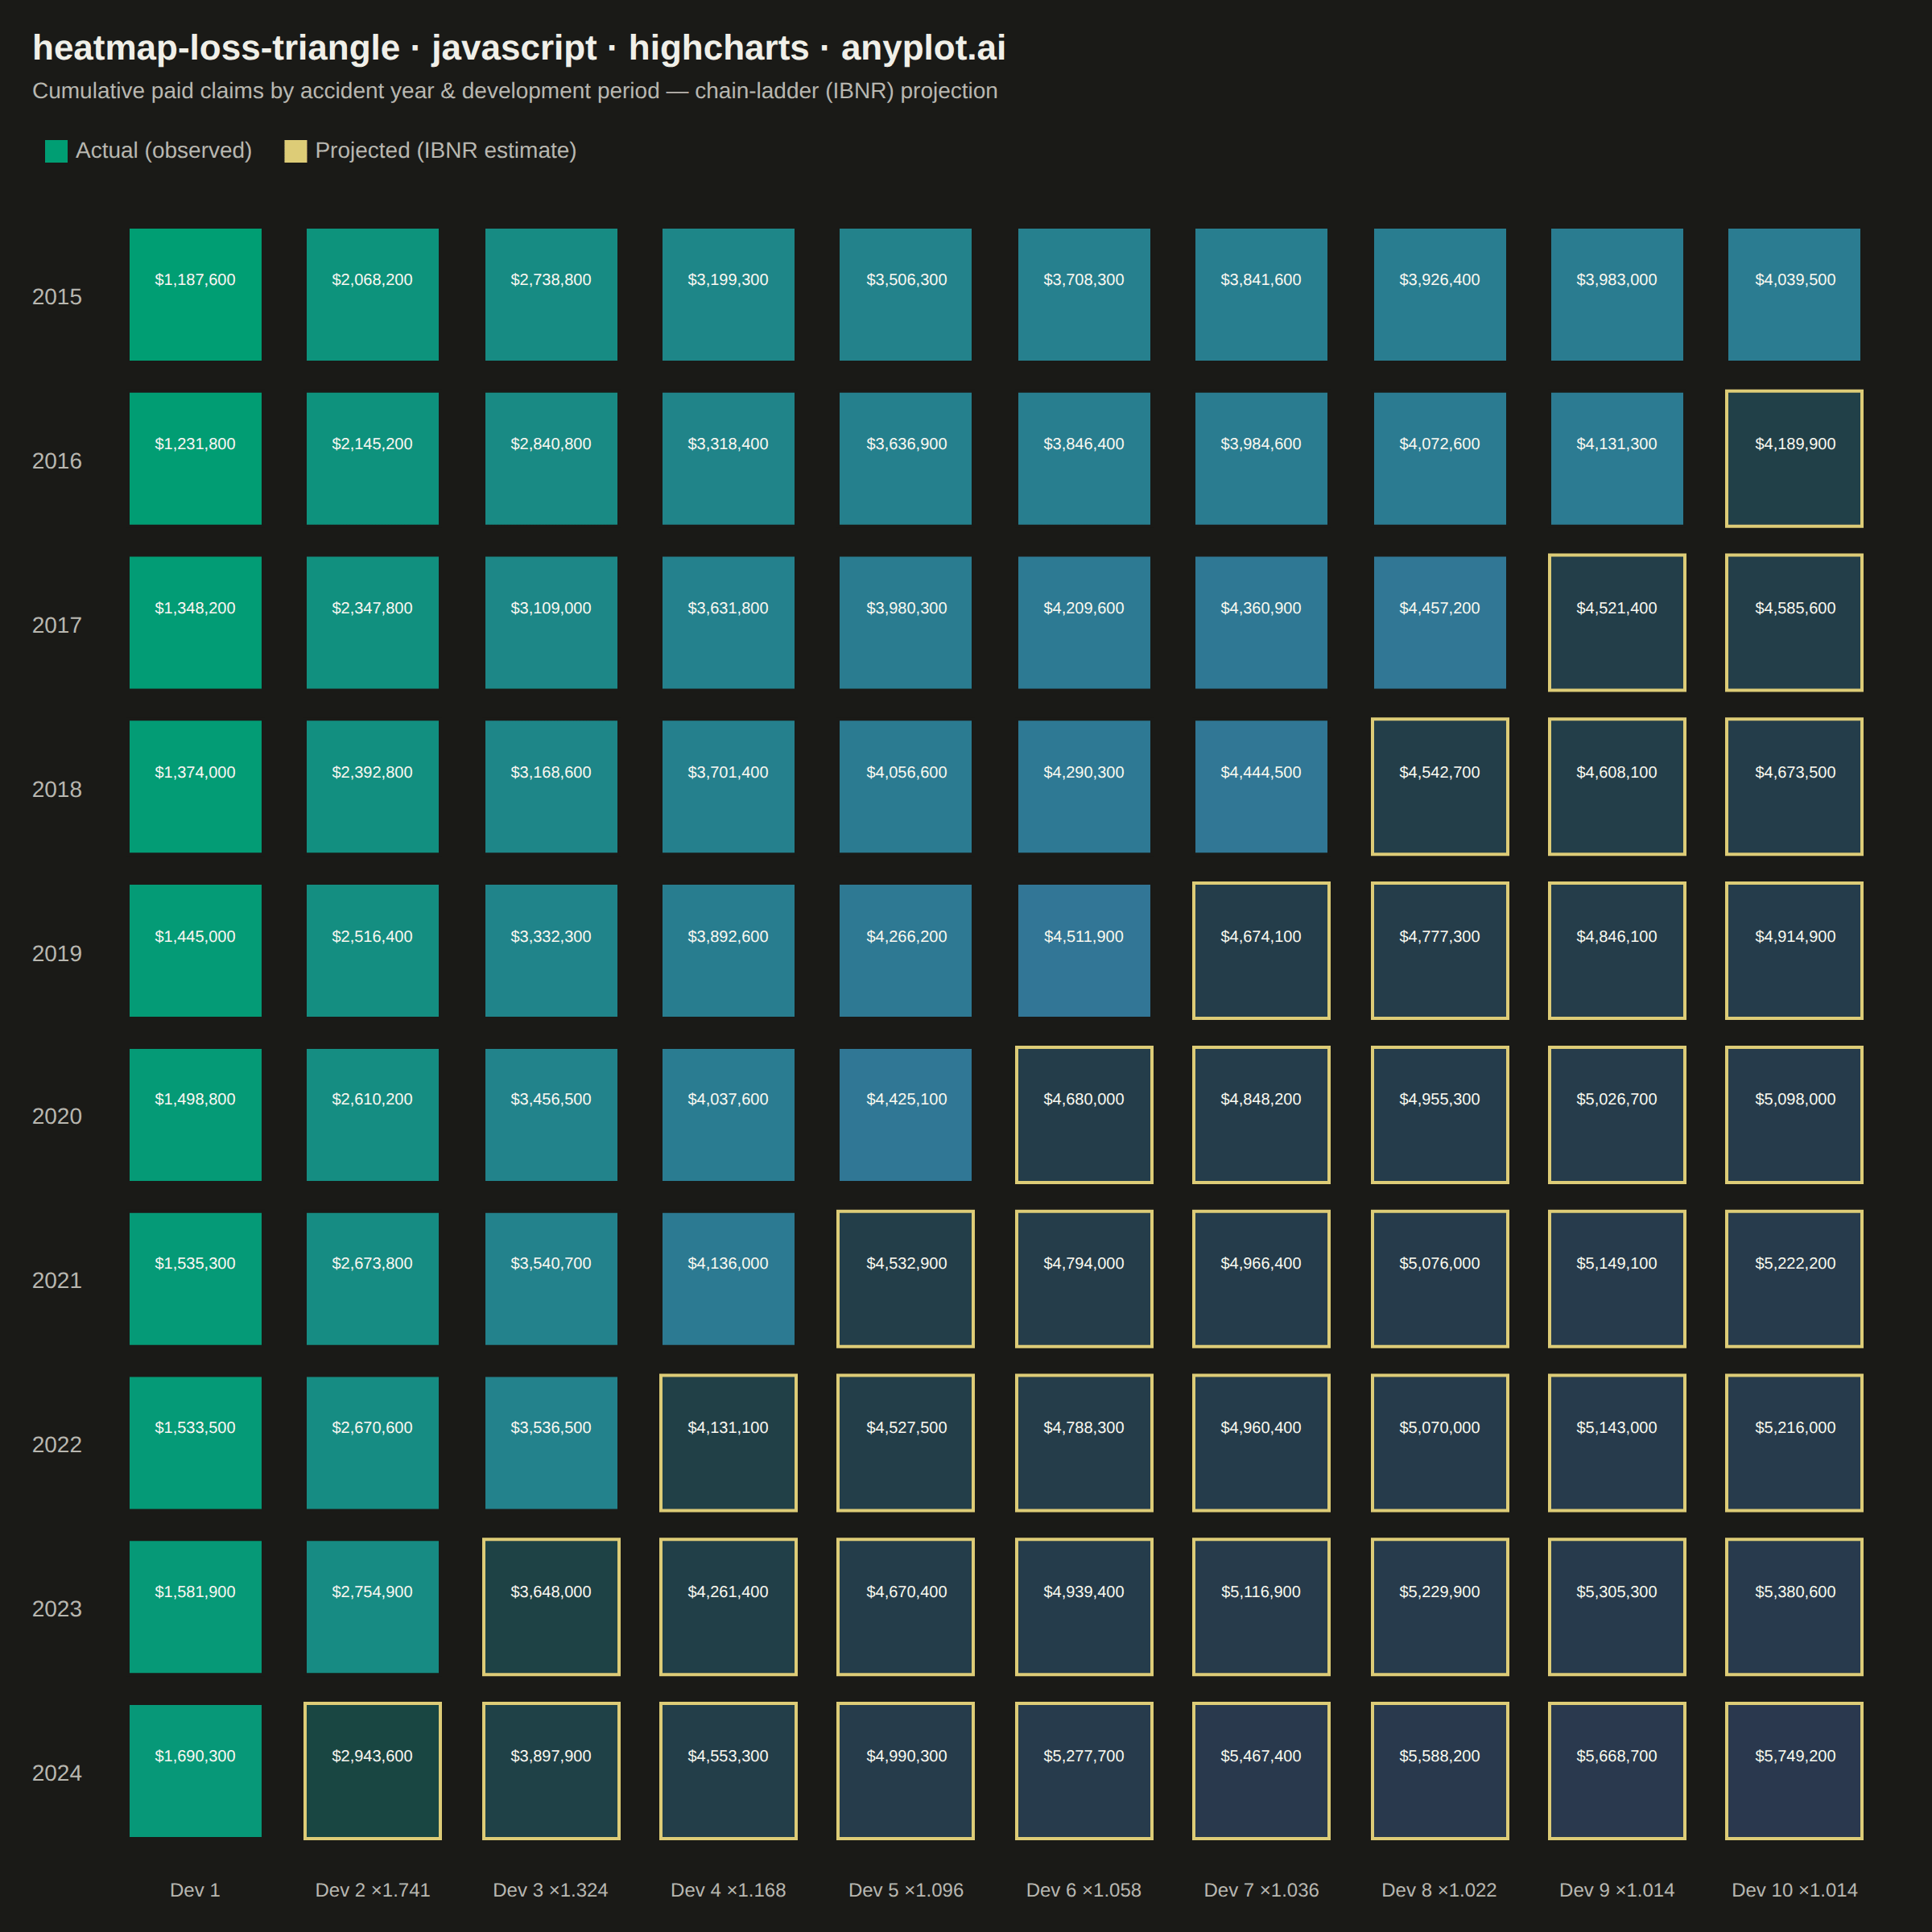
A triangular matrix visualization showing cumulative insurance claim payments developing over time. Rows represent accident/origin years, columns represent development periods (e.g., 1-10 years), with the upper-left triangle displaying actual observed cumulative claims and the lower-right triangle showing projected/estimated values (IBNR). This plot is essential for actuarial reserving, enabling analysts to visualize the chain-ladder method and identify development patterns in loss data.
// anyplot.ai
// heatmap-loss-triangle: Actuarial Loss Development Triangle
// Library: highcharts 12.6.0 | JavaScript 22.23.2
// Quality: 88/100 | Created: 2026-08-20

//# anyplot-orientation: square

const t = window.ANYPLOT_TOKENS;

// --- Color helpers -----------------------------------------------------
// Data-mark fills (Imprint sequential hues) stay dark on both themes, so
// on-mark labels use a fixed light tone — the light-theme page background
// hex, reused here as a foreground — instead of the theme-adaptive ink
// token, which would render dark-on-dark for the projected cells in dark
// mode once blended toward a near-black page background.
const LIGHT_LABEL = "#FAF8F1";

function hexToRgb(hex) {
  const n = parseInt(hex.replace("#", ""), 16);
  return [(n >> 16) & 255, (n >> 8) & 255, n & 255];
}

function mixRgb(hexA, hexB, frac) {
  const a = hexToRgb(hexA);
  const b = hexToRgb(hexB);
  return a.map((ch, i) => Math.round(ch + (b[i] - ch) * frac));
}

function blendOver(rgb, alpha, bgHex) {
  const bg = hexToRgb(bgHex);
  return rgb.map((ch, i) => Math.round(ch * alpha + bg[i] * (1 - alpha)));
}

function relLuminance(rgb) {
  const srgb = rgb
    .map((ch) => ch / 255)
    .map((v) => (v <= 0.03928 ? v / 12.92 : Math.pow((v + 0.055) / 1.055, 2.4)));
  return 0.2126 * srgb[0] + 0.7152 * srgb[1] + 0.0722 * srgb[2];
}

function rgbStr(rgb) {
  return `rgb(${rgb[0]}, ${rgb[1]}, ${rgb[2]})`;
}

function rgbaStr(rgb, alpha) {
  return `rgba(${rgb[0]}, ${rgb[1]}, ${rgb[2]}, ${alpha})`;
}

// --- Data (in-memory, deterministic) ----------------------------------
// Chain-ladder style claim development: a fixed reporting pattern (the
// fraction of ultimate loss reported by each development period) applied
// to a per-accident-year ultimate loss estimate. A tiny seeded LCG adds
// realistic accident-year variation without relying on Math.random().
let lcgSeed = 42;
function nextRandom() {
  lcgSeed = (lcgSeed * 1103515245 + 12345) & 0x7fffffff;
  return lcgSeed / 0x7fffffff;
}

const LATEST_CALENDAR_YEAR = 2024;
const accidentYears = Array.from({ length: 10 }, (_, i) => 2015 + i);
const devPeriods = Array.from({ length: 10 }, (_, i) => i + 1);

// Cumulative fraction of ultimate loss reported by development period
const reportPattern = [0.294, 0.512, 0.678, 0.792, 0.868, 0.918, 0.951, 0.972, 0.986, 1.0];
// Age-to-age development factors between consecutive periods
const devFactors = reportPattern.slice(1).map((p, i) => p / reportPattern[i]);

const ultimateByYear = accidentYears.map((_, i) => {
  const trend = 4_000_000 * Math.pow(1.045, i);
  const jitter = 0.94 + nextRandom() * 0.12;
  return trend * jitter;
});

const cells = [];
accidentYears.forEach((year, rowIdx) => {
  devPeriods.forEach((dev, colIdx) => {
    const calendarYear = year + dev - 1;
    const amount = Math.round((ultimateByYear[rowIdx] * reportPattern[colIdx]) / 100) * 100;
    cells.push({
      x: colIdx,
      y: rowIdx,
      amount,
      isProjected: calendarYear > LATEST_CALENDAR_YEAR,
    });
  });
});

const amounts = cells.map((c) => c.amount);
const minAmount = Math.min(...amounts);
const maxAmount = Math.max(...amounts);

function pointFor(cell) {
  const frac = (cell.amount - minAmount) / (maxAmount - minAmount);
  const solidRgb = mixRgb(t.seq[0], t.seq[1], frac);
  const alpha = cell.isProjected ? 0.4 : 1;
  const displayedRgb = cell.isProjected ? blendOver(solidRgb, alpha, t.pageBg) : solidRgb;
  const labelColor = relLuminance(displayedRgb) < 0.5 ? LIGHT_LABEL : t.ink;

  return {
    x: cell.x,
    y: cell.y,
    amount: cell.amount,
    marker: {
      fillColor: cell.isProjected ? rgbaStr(solidRgb, alpha) : rgbStr(solidRgb),
      lineColor: cell.isProjected ? t.amber : t.pageBg,
      lineWidth: 2,
    },
    dataLabels: { style: { color: labelColor } },
  };
}

const actualPoints = cells.filter((c) => !c.isProjected).map(pointFor);
const projectedPoints = cells.filter((c) => c.isProjected).map(pointFor);

// --- Chart ---------------------------------------------------------------
Highcharts.chart("container", {
  chart: {
    type: "scatter",
    backgroundColor: "transparent",
    animation: false,
    style: { fontFamily: "inherit" },
    spacing: [20, 30, 20, 20],
    events: {
      load: function () {
        // Size the square markers to the actual rendered grid so cells
        // tile edge-to-edge regardless of the auto-computed axis margins.
        const cellW = this.plotWidth / devPeriods.length;
        const cellH = this.plotHeight / accidentYears.length;
        const radius = Math.floor(Math.min(cellW, cellH) * 0.42);
        this.series.forEach((s) => {
          s.points.forEach((p) => {
            // point.update() replaces the whole marker object rather than
            // merging it, so re-spread the point's own fillColor/lineColor
            // or the radius-only update would wipe out its per-cell color.
            const marker = Object.assign({}, p.options.marker, { radius });
            p.update({ marker }, false);
          });
        });
        this.redraw(false);
      },
    },
  },
  credits: { enabled: false },
  colors: t.palette,
  title: {
    text: "heatmap-loss-triangle · javascript · highcharts · anyplot.ai",
    align: "left",
    style: { color: t.ink, fontSize: "22px", fontWeight: "600" },
  },
  subtitle: {
    text: "Cumulative paid claims by accident year & development period — chain-ladder (IBNR) projection",
    align: "left",
    style: { color: t.inkSoft, fontSize: "14px" },
  },
  xAxis: {
    min: -0.5,
    max: devPeriods.length - 0.5,
    tickInterval: 1,
    startOnTick: false,
    endOnTick: false,
    gridLineWidth: 0,
    lineWidth: 0,
    tickLength: 0,
    title: { text: "Development Period", style: { color: t.inkSoft, fontSize: "16px" } },
    labels: {
      style: { color: t.inkSoft, fontSize: "12px" },
      formatter: function () {
        const idx = this.pos;
        if (idx < 0 || idx >= devPeriods.length) return "";
        return idx === 0
          ? `Dev ${devPeriods[idx]}`
          : `Dev ${devPeriods[idx]} ×${devFactors[idx - 1].toFixed(3)}`;
      },
    },
  },
  yAxis: {
    min: -0.5,
    max: accidentYears.length - 0.5,
    reversed: true,
    tickInterval: 1,
    startOnTick: false,
    endOnTick: false,
    gridLineWidth: 0,
    lineWidth: 0,
    tickLength: 0,
    title: { text: "Accident Year", style: { color: t.inkSoft, fontSize: "16px" } },
    labels: {
      style: { color: t.inkSoft, fontSize: "14px" },
      formatter: function () {
        const idx = this.pos;
        if (idx < 0 || idx >= accidentYears.length) return "";
        return String(accidentYears[idx]);
      },
    },
  },
  legend: {
    align: "left",
    verticalAlign: "top",
    layout: "horizontal",
    floating: false,
    margin: 24,
    itemStyle: { color: t.inkSoft, fontSize: "14px" },
    itemHoverStyle: { color: t.ink },
    symbolWidth: 14,
    symbolHeight: 14,
    symbolRadius: 2,
  },
  tooltip: { enabled: false },
  plotOptions: {
    series: {
      marker: { symbol: "square", radius: 40, states: { hover: { enabled: false } } },
      dataLabels: {
        enabled: true,
        formatter: function () {
          return "$" + (this.point.amount / 1e6).toFixed(2) + "M";
        },
        style: { fontSize: "11px", fontWeight: "600", textOutline: "none" },
      },
      animation: false,
      states: { hover: { enabled: false } },
    },
  },
  series: [
    { name: "Actual (observed)", color: t.palette[0], data: actualPoints },
    { name: "Projected (IBNR estimate)", color: t.amber, data: projectedPoints },
  ],
});
Runnable source as JSON, for any HTTP client: https://api.anyplot.ai/specs/heatmap-loss-triangle/highcharts/code. Any spec id and library id listed in llms-full.txt fit the same URL shape; every URL below is complete and callable.
{
  "spec_id": "heatmap-loss-triangle",
  "language": "javascript",
  "library": "highcharts",
  "page": "https://anyplot.ai/heatmap-loss-triangle/javascript/highcharts",
  "hub": "https://anyplot.ai/heatmap-loss-triangle",
  "code_json": "https://api.anyplot.ai/specs/heatmap-loss-triangle/highcharts/code",
  "spec_json": "https://api.anyplot.ai/specs/heatmap-loss-triangle",
  "render_light_png": "https://storage.googleapis.com/anyplot-images/plots/heatmap-loss-triangle/javascript/highcharts/plot-light.png",
  "render_dark_png": "https://storage.googleapis.com/anyplot-images/plots/heatmap-loss-triangle/javascript/highcharts/plot-dark.png",
  "interactive_light_html": "https://storage.googleapis.com/anyplot-images/plots/heatmap-loss-triangle/javascript/highcharts/plot-light.html",
  "interactive_dark_html": "https://storage.googleapis.com/anyplot-images/plots/heatmap-loss-triangle/javascript/highcharts/plot-dark.html",
  "quality_score": 88.0,
  "license": "MIT",
  "guide": "https://anyplot.ai/llms.txt"
}
Part of Actuarial Loss Development Triangle on anyplot.ai.