The same plot in 14 other libraries — JavaScript: Chart.js, Apache ECharts, Highcharts, MUI X Charts; Python: Altair, Bokeh, lets-plot, Matplotlib, Plotly, plotnine, Pygal, Seaborn; R: ggplot2; Julia: Makie.jl. Compare all 15 side by side: Actuarial Loss Development Triangle in Python, R, Julia and JavaScript.
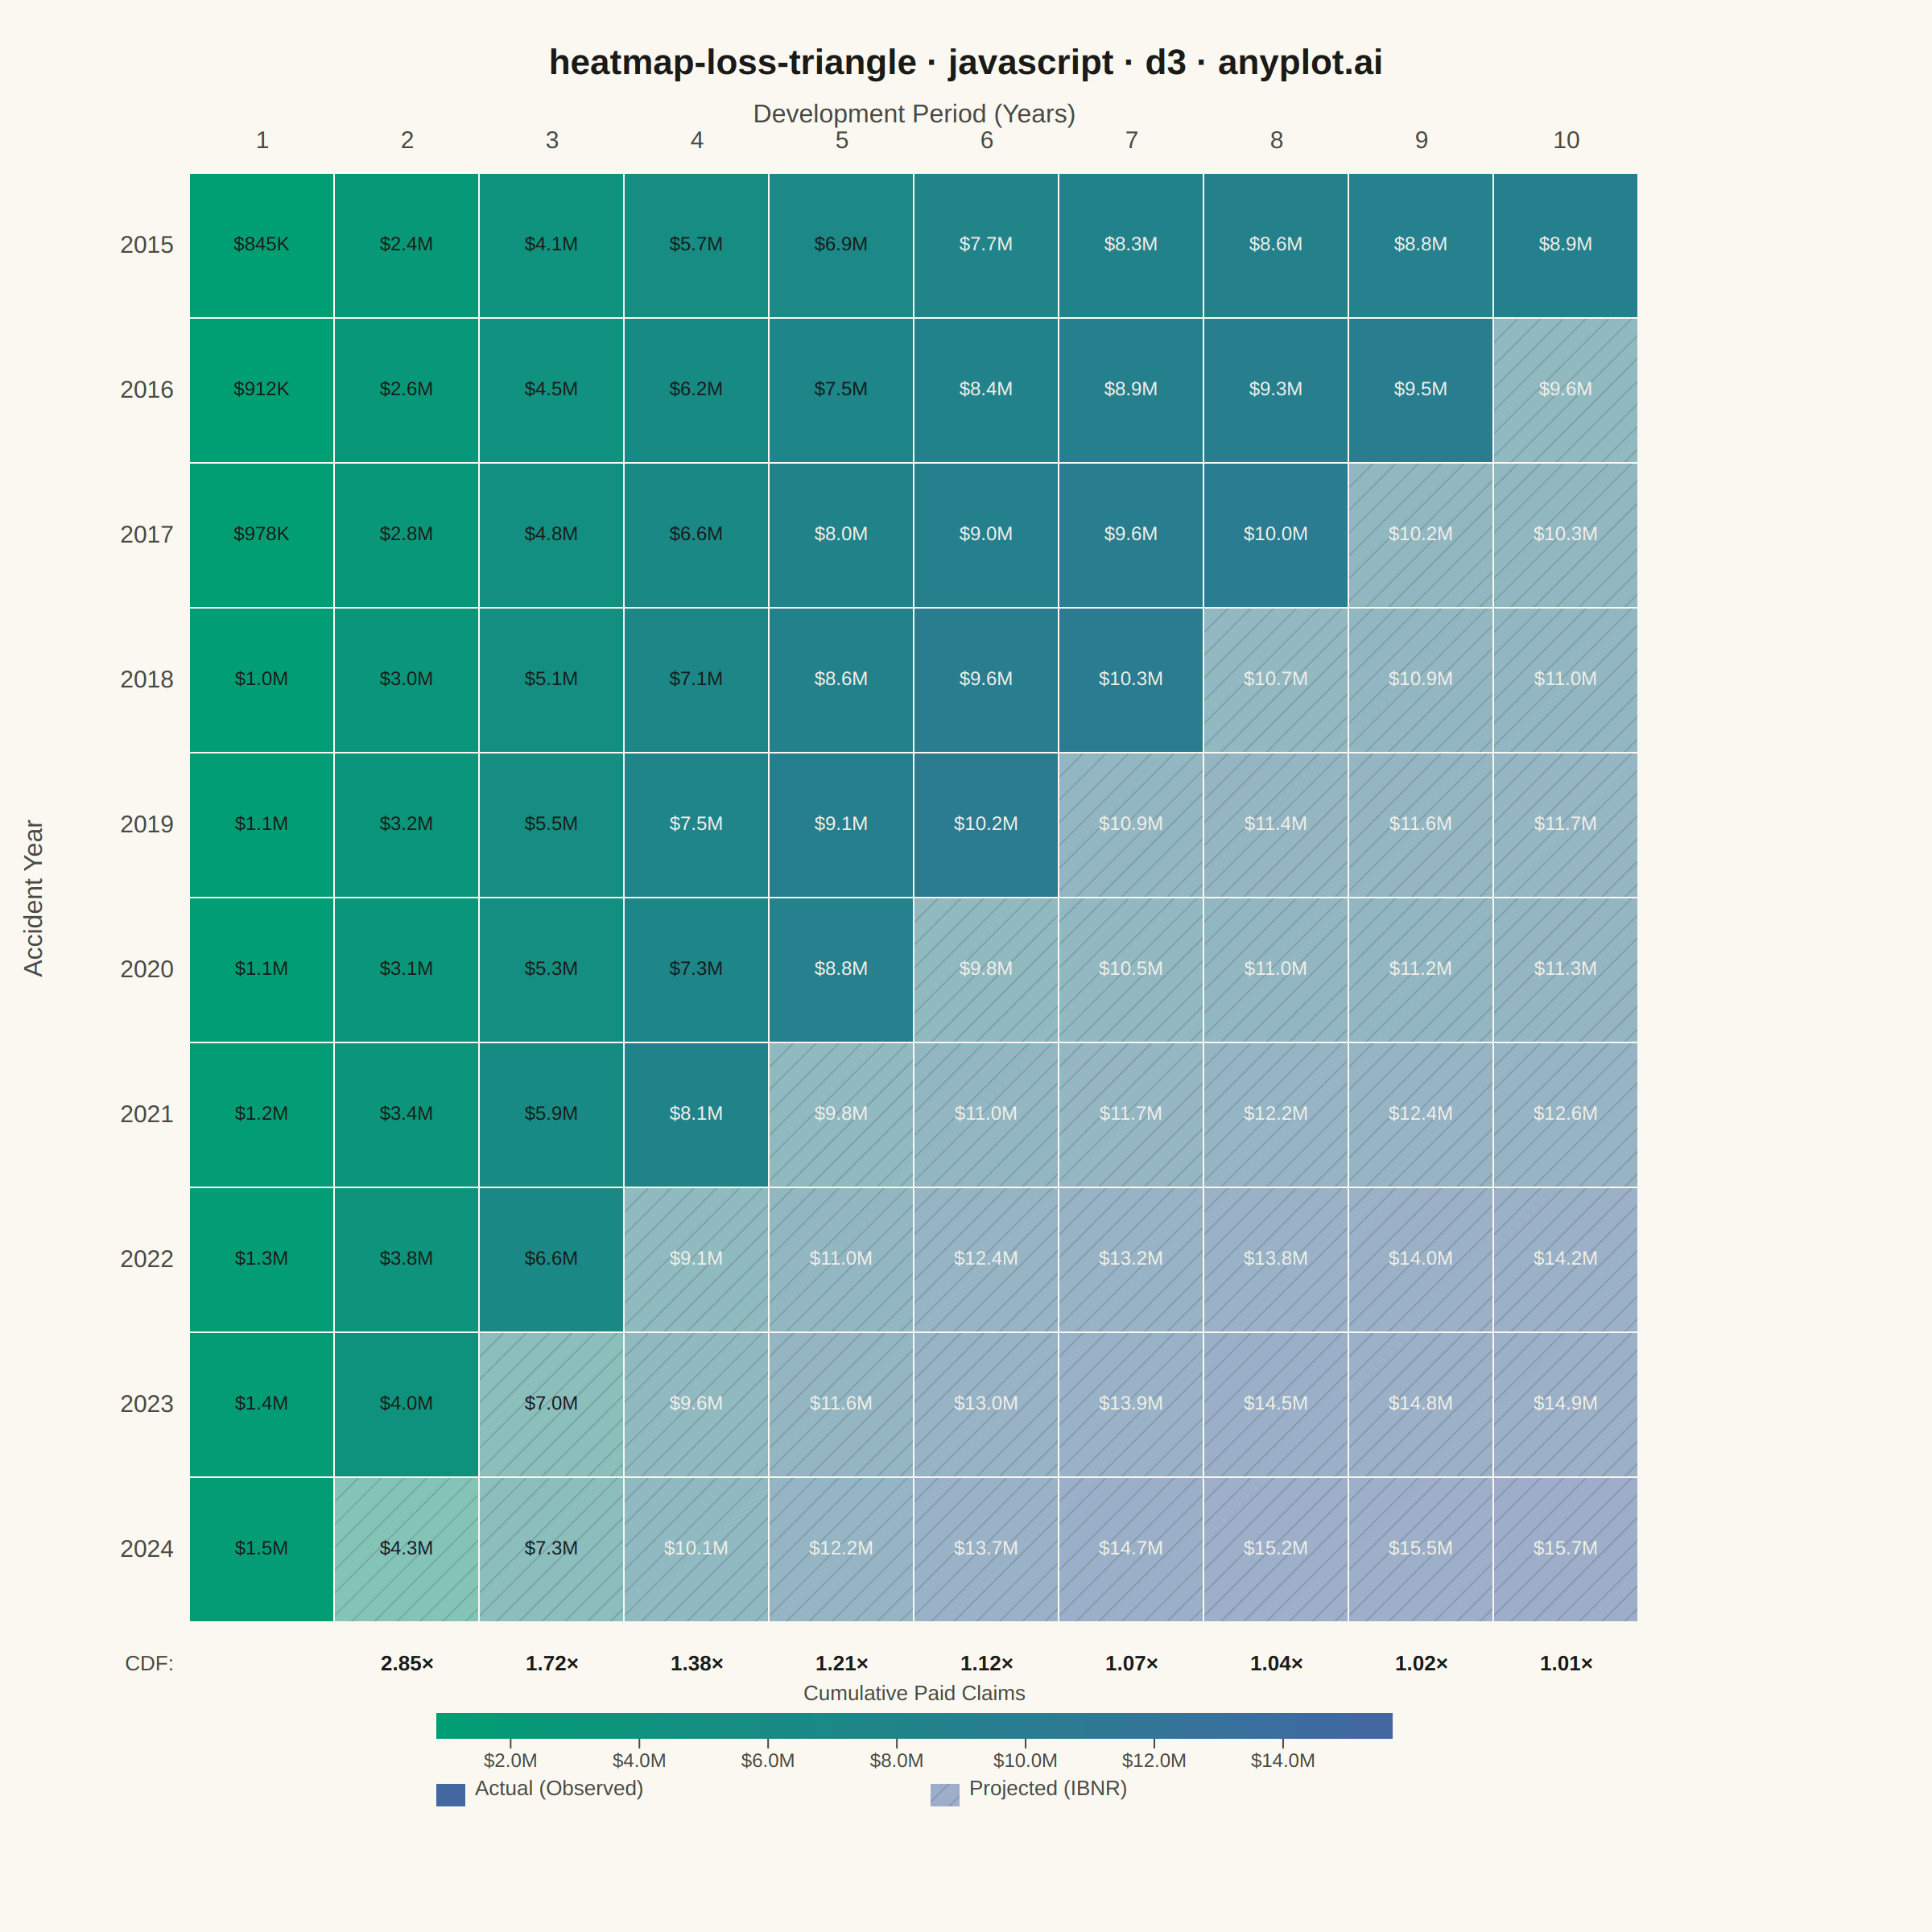
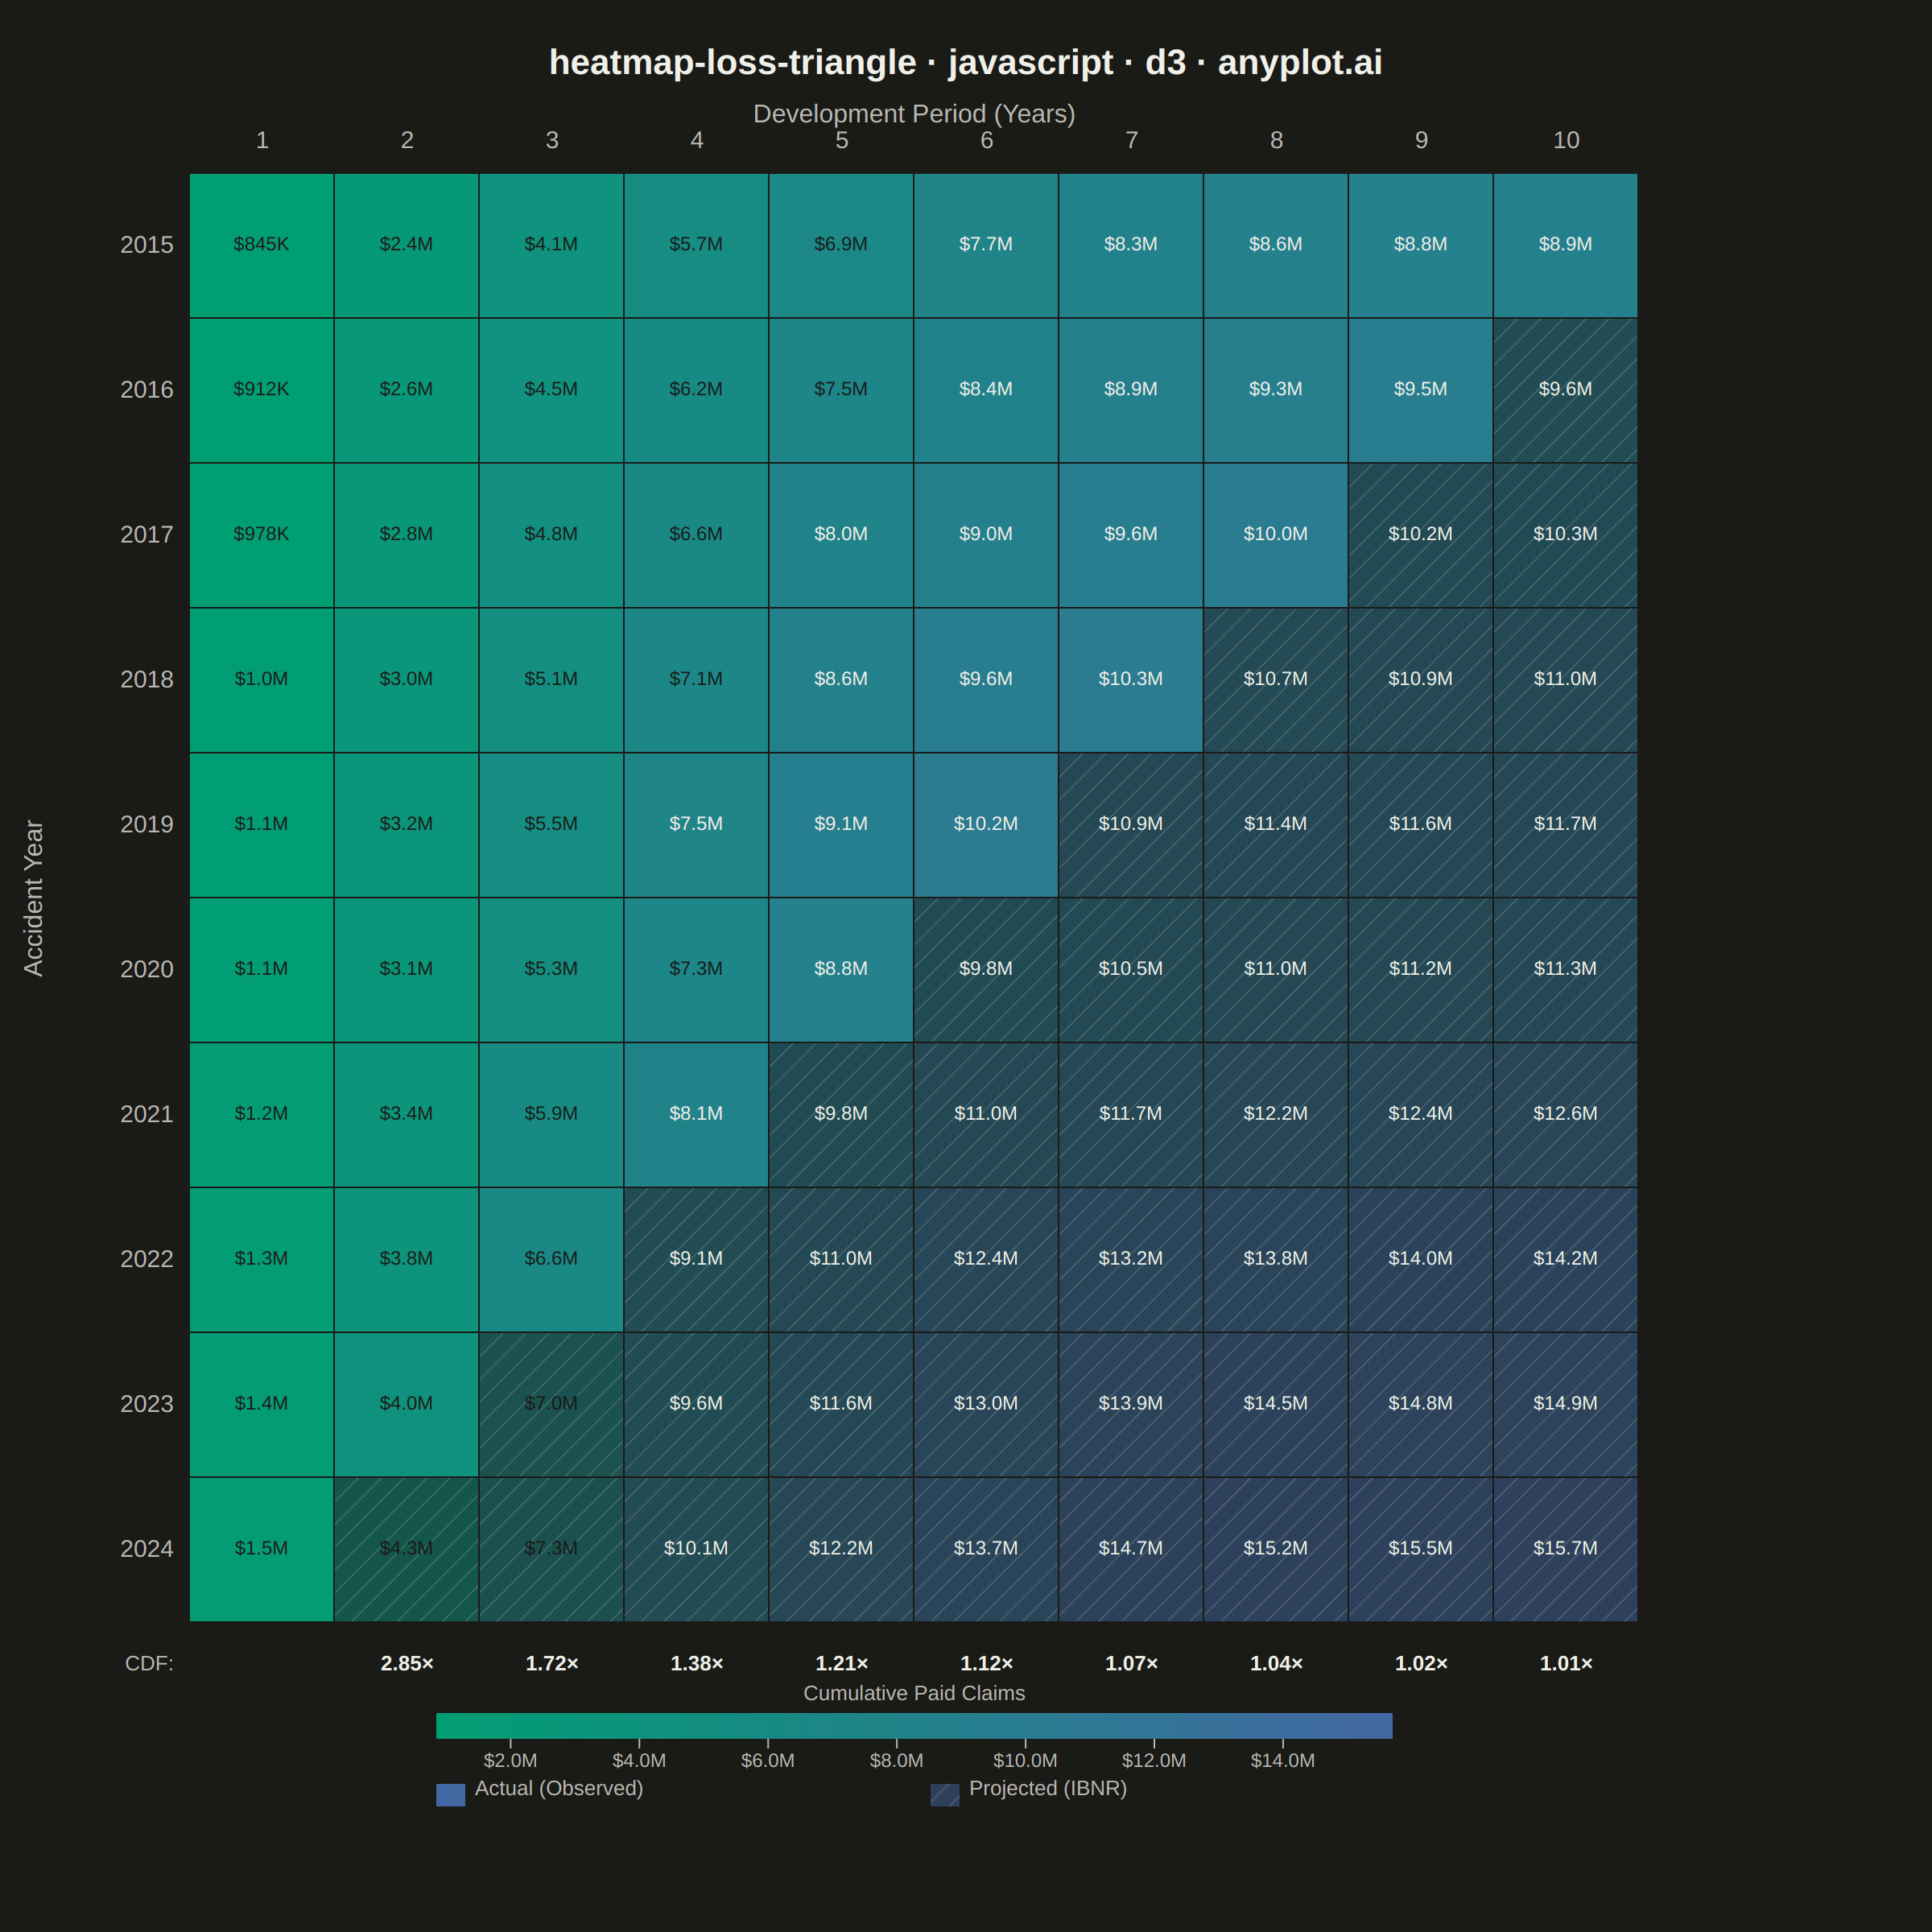
A triangular matrix visualization showing cumulative insurance claim payments developing over time. Rows represent accident/origin years, columns represent development periods (e.g., 1-10 years), with the upper-left triangle displaying actual observed cumulative claims and the lower-right triangle showing projected/estimated values (IBNR). This plot is essential for actuarial reserving, enabling analysts to visualize the chain-ladder method and identify development patterns in loss data.
// anyplot.ai
// heatmap-loss-triangle: Actuarial Loss Development Triangle
// Library: d3 7.9.0 | JavaScript 22.22.3
// Quality: 90/100 | Created: 2026-06-03
//# anyplot-orientation: square

const t = window.ANYPLOT_TOKENS;
const { width, height } = window.ANYPLOT_SIZE;

// --- Data: actuarial loss triangle (chain-ladder method) -------------------
const accidentYears = [2015, 2016, 2017, 2018, 2019, 2020, 2021, 2022, 2023, 2024];
const nYears = accidentYears.length;
const nPeriods = 10;

// Age-to-age cumulative development factors (period 1→2, 2→3, ..., 9→10)
const devFactors = [2.85, 1.72, 1.38, 1.21, 1.12, 1.07, 1.04, 1.02, 1.01];

// Initial paid claims at development period 1 (dollars, gradual upward trend by year)
const initialPaid = [845000, 912000, 978000, 1048000, 1115000, 1074000, 1196000, 1348000, 1420000, 1494000];

// Build cumulative triangle: apply chain-ladder factors sequentially
const cells = [];
for (let i = 0; i < nYears; i++) {
  let cumVal = initialPaid[i];
  for (let j = 0; j < nPeriods; j++) {
    // Upper-left triangle (i + j < nYears) is observed; lower-right is projected
    const actual = i + j < nYears;
    cells.push({ i, j, year: accidentYears[i], period: j + 1, value: cumVal, actual });
    if (j < nPeriods - 1) cumVal *= devFactors[j];
  }
}

const vMin = d3.min(cells, d => d.value);
const vMax = d3.max(cells, d => d.value);

// --- Layout ---------------------------------------------------------------
const cellSize = 90;
const gridW = cellSize * nPeriods;   // 900
const gridH = cellSize * nYears;     // 900
const marginLeft = 118;
const marginTop = 108;

const svg = d3.select("#container").append("svg")
  .attr("width", width).attr("height", height);
const g = svg.append("g").attr("transform", `translate(${marginLeft},${marginTop})`);

// --- Defs -----------------------------------------------------------------
const defs = svg.append("defs");

// Diagonal hatch pattern for projected cells
const hatchPat = defs.append("pattern")
  .attr("id", "hatch")
  .attr("patternUnits", "userSpaceOnUse")
  .attr("width", 10).attr("height", 10)
  .attr("patternTransform", "rotate(45 0 0)");
hatchPat.append("line")
  .attr("x1", 0).attr("y1", 0).attr("x2", 0).attr("y2", 10)
  .attr("stroke", t.ink).attr("stroke-width", 1.4).attr("stroke-opacity", 0.20);

// Sequential gradient for legend bar
const seqGrad = defs.append("linearGradient")
  .attr("id", "seq-grad").attr("x1", "0%").attr("x2", "100%");
seqGrad.append("stop").attr("offset", "0%").attr("stop-color", t.seq[0]);
seqGrad.append("stop").attr("offset", "100%").attr("stop-color", t.seq[1]);

// --- Color scale (Imprint sequential: green → blue) ----------------------
const colorScale = d3.scaleSequential(d3.interpolateRgbBasis(t.seq)).domain([vMin, vMax]);

// Cell text: light text on darker (high-value blue) cells, dark on lighter (low-value green)
const textColor = d => ((d.value - vMin) / (vMax - vMin)) > 0.45 ? "#F0EFE8" : "#1A1A17";

// Value formatter: $1.2M for millions, $845K for thousands
const fmt = v => v >= 1e6 ? `$${(v / 1e6).toFixed(1)}M` : `$${Math.round(v / 1000)}K`;

// --- Axis labels ----------------------------------------------------------
svg.append("text")
  .attr("x", marginLeft + gridW / 2).attr("y", 76)
  .attr("text-anchor", "middle")
  .attr("fill", t.inkSoft)
  .style("font-size", "16px").style("font-weight", "500")
  .text("Development Period (Years)");

svg.append("text")
  .attr("transform", `translate(26,${marginTop + gridH / 2}) rotate(-90)`)
  .attr("text-anchor", "middle")
  .attr("fill", t.inkSoft)
  .style("font-size", "16px").style("font-weight", "500")
  .text("Accident Year");

// Column headers (1–10)
g.selectAll(".col-hdr").data(d3.range(nPeriods)).join("text")
  .attr("class", "col-hdr")
  .attr("x", j => j * cellSize + cellSize / 2)
  .attr("y", -16)
  .attr("text-anchor", "middle")
  .attr("fill", t.inkSoft)
  .style("font-size", "15px")
  .text(j => j + 1);

// Row labels (2015–2024)
g.selectAll(".row-lbl").data(accidentYears).join("text")
  .attr("class", "row-lbl")
  .attr("x", -10)
  .attr("y", (_, i) => i * cellSize + cellSize / 2)
  .attr("text-anchor", "end").attr("dominant-baseline", "middle")
  .attr("fill", t.inkSoft)
  .style("font-size", "15px")
  .text(d => d);

// --- Heatmap cells --------------------------------------------------------
const cellG = g.selectAll(".cell").data(cells).join("g")
  .attr("class", "cell")
  .attr("transform", d => `translate(${d.j * cellSize},${d.i * cellSize})`);

// Color fill (projected cells at 50% opacity so background shows through)
cellG.append("rect")
  .attr("width", cellSize - 1).attr("height", cellSize - 1)
  .attr("fill", d => colorScale(d.value))
  .attr("opacity", d => d.actual ? 1.0 : 0.50);

// Diagonal hatch overlay distinguishes projected from actual
cellG.filter(d => !d.actual).append("rect")
  .attr("width", cellSize - 1).attr("height", cellSize - 1)
  .attr("fill", "url(#hatch)");

// Cell value annotations (formatted with thousands separator)
cellG.append("text")
  .attr("x", (cellSize - 1) / 2).attr("y", (cellSize - 1) / 2)
  .attr("text-anchor", "middle").attr("dominant-baseline", "middle")
  .attr("fill", textColor)
  .style("font-size", "12px").style("font-weight", "500")
  .text(d => fmt(d.value));

// --- Age-to-age development factors row -----------------------------------
const cdfBaseY = gridH + 12;

g.append("text")
  .attr("x", -10).attr("y", cdfBaseY + 14)
  .attr("text-anchor", "end").attr("dominant-baseline", "middle")
  .attr("fill", t.inkSoft).style("font-size", "13px")
  .text("CDF:");

d3.range(1, nPeriods).forEach(j => {
  g.append("text")
    .attr("x", j * cellSize + cellSize / 2)
    .attr("y", cdfBaseY + 14)
    .attr("text-anchor", "middle").attr("dominant-baseline", "middle")
    .attr("fill", t.ink)
    .style("font-size", "13px").style("font-weight", "600")
    .text(devFactors[j - 1].toFixed(2) + "×");
});

// --- Color legend ---------------------------------------------------------
const lgY = gridH + 56;
const lgW = Math.round(gridW * 0.66);
const lgX = Math.round((gridW - lgW) / 2);
const lgBarH = 16;

// Gradient bar
g.append("rect")
  .attr("x", lgX).attr("y", lgY).attr("width", lgW).attr("height", lgBarH)
  .attr("fill", "url(#seq-grad)");

// Axis below bar
const lgScale = d3.scaleLinear().domain([vMin, vMax]).range([lgX, lgX + lgW]);
g.append("g").attr("transform", `translate(0,${lgY + lgBarH})`)
  .call(d3.axisBottom(lgScale).ticks(5).tickFormat(fmt))
  .call(ax => {
    ax.select(".domain").remove();
    ax.selectAll("text").attr("fill", t.inkSoft).style("font-size", "12px");
    ax.selectAll("line").attr("stroke", t.inkSoft);
  });

// Legend title
g.append("text")
  .attr("x", lgX + lgW / 2).attr("y", lgY - 8)
  .attr("text-anchor", "middle")
  .attr("fill", t.inkSoft).style("font-size", "13px")
  .text("Cumulative Paid Claims");

// Actual vs projected swatches
const lgItemY = lgY + lgBarH + 38;

g.append("rect").attr("x", lgX).attr("y", lgItemY - 10)
  .attr("width", 18).attr("height", 14).attr("fill", t.seq[1]).attr("opacity", 1.0);
g.append("text").attr("x", lgX + 24).attr("y", lgItemY - 3)
  .attr("fill", t.inkSoft).style("font-size", "13px").text("Actual (Observed)");

const projSwatchX = lgX + lgW / 2 + 10;
g.append("rect").attr("x", projSwatchX).attr("y", lgItemY - 10)
  .attr("width", 18).attr("height", 14).attr("fill", t.seq[1]).attr("opacity", 0.50);
g.append("rect").attr("x", projSwatchX).attr("y", lgItemY - 10)
  .attr("width", 18).attr("height", 14).attr("fill", "url(#hatch)");
g.append("text").attr("x", projSwatchX + 24).attr("y", lgItemY - 3)
  .attr("fill", t.inkSoft).style("font-size", "13px").text("Projected (IBNR)");

// --- Title ----------------------------------------------------------------
svg.append("text")
  .attr("x", width / 2).attr("y", 46)
  .attr("text-anchor", "middle")
  .attr("fill", t.ink)
  .style("font-size", "22px").style("font-weight", "600")
  .text("heatmap-loss-triangle · javascript · d3 · anyplot.ai");
Runnable source as JSON, for any HTTP client: https://api.anyplot.ai/specs/heatmap-loss-triangle/d3/code. Any spec id and library id listed in llms-full.txt fit the same URL shape; every URL below is complete and callable.
{
  "spec_id": "heatmap-loss-triangle",
  "language": "javascript",
  "library": "d3",
  "page": "https://anyplot.ai/heatmap-loss-triangle/javascript/d3",
  "hub": "https://anyplot.ai/heatmap-loss-triangle",
  "code_json": "https://api.anyplot.ai/specs/heatmap-loss-triangle/d3/code",
  "spec_json": "https://api.anyplot.ai/specs/heatmap-loss-triangle",
  "render_light_png": "https://storage.googleapis.com/anyplot-images/plots/heatmap-loss-triangle/javascript/d3/plot-light.png",
  "render_dark_png": "https://storage.googleapis.com/anyplot-images/plots/heatmap-loss-triangle/javascript/d3/plot-dark.png",
  "interactive_light_html": "https://storage.googleapis.com/anyplot-images/plots/heatmap-loss-triangle/javascript/d3/plot-light.html",
  "interactive_dark_html": "https://storage.googleapis.com/anyplot-images/plots/heatmap-loss-triangle/javascript/d3/plot-dark.html",
  "quality_score": 90.0,
  "license": "MIT",
  "guide": "https://anyplot.ai/llms.txt"
}
Part of Actuarial Loss Development Triangle on anyplot.ai.