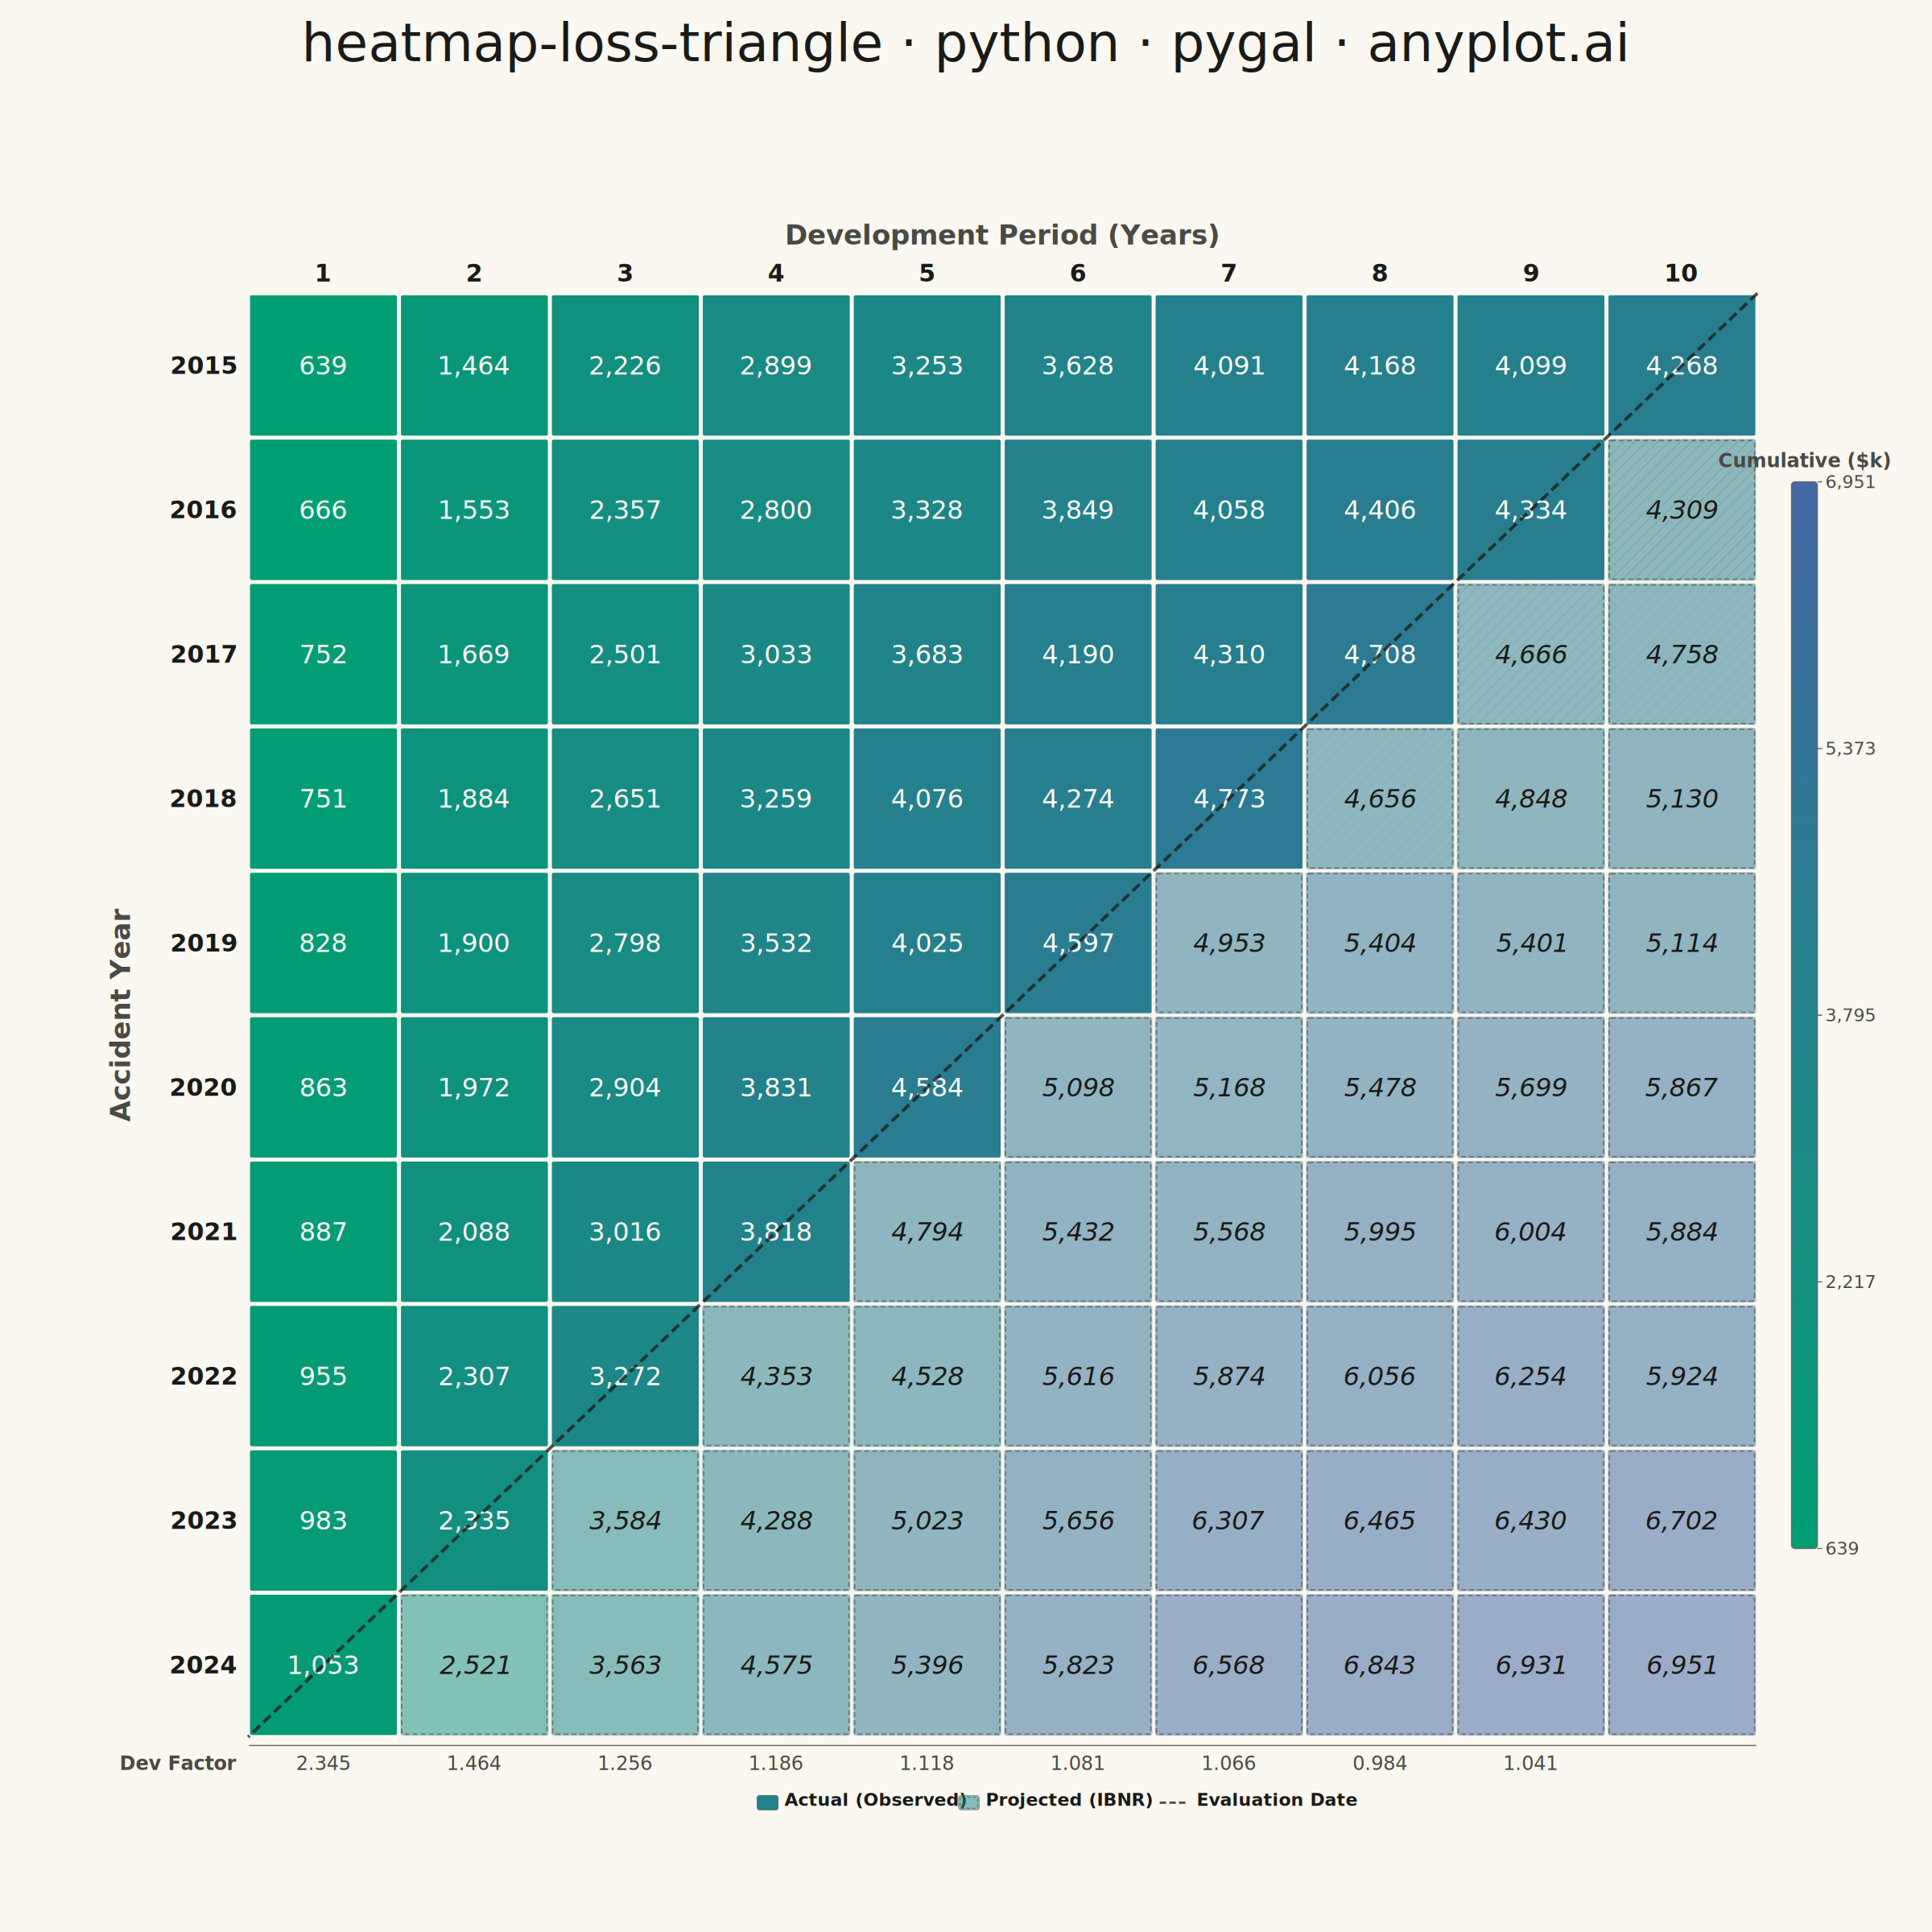
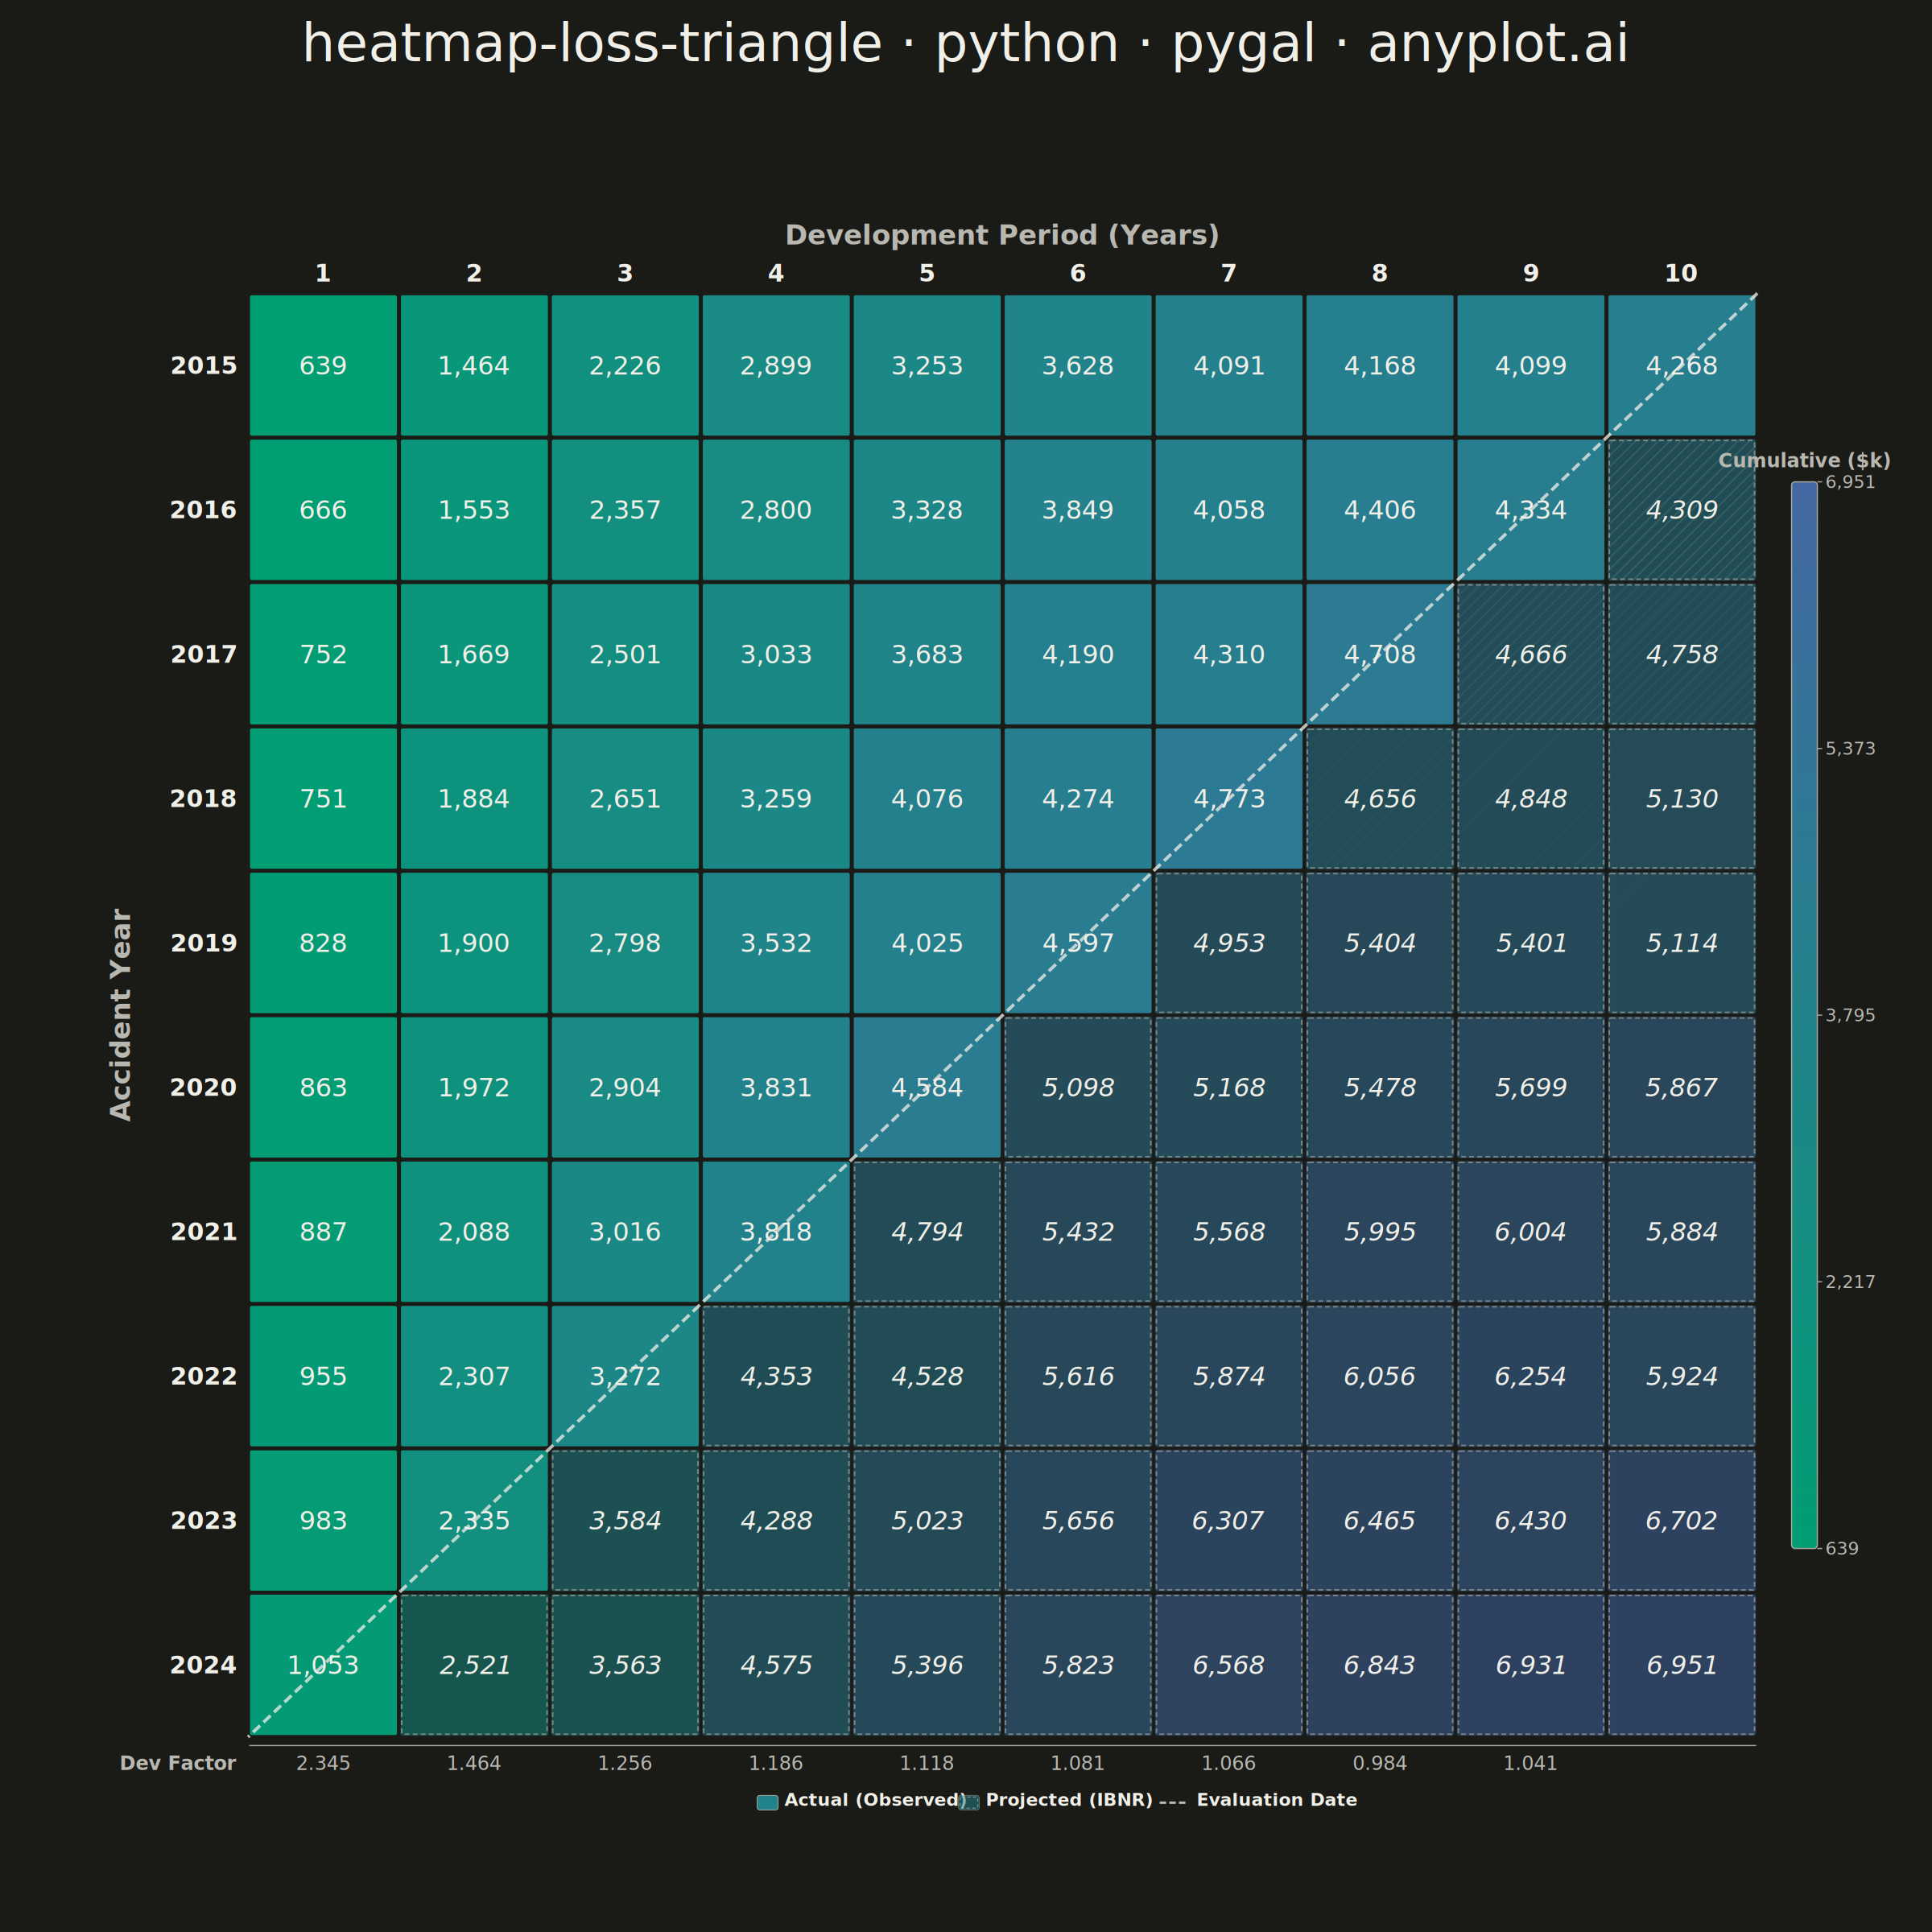
A triangular matrix visualization showing cumulative insurance claim payments developing over time. Rows represent accident/origin years, columns represent development periods (e.g., 1-10 years), with the upper-left triangle displaying actual observed cumulative claims and the lower-right triangle showing projected/estimated values (IBNR). This plot is essential for actuarial reserving, enabling analysts to visualize the chain-ladder method and identify development patterns in loss data.
""" anyplot.ai
heatmap-loss-triangle: Actuarial Loss Development Triangle
Library: pygal 3.1.0 | Python 3.13.13
Quality: 86/100 | Updated: 2026-06-03
"""

import os
import sys

import numpy as np


# Path fix: this file is named 'pygal.py', which shadows the pygal package
_cwd = sys.path[0] if sys.path[0] else "."
if _cwd in sys.path:
    sys.path.remove(_cwd)

from pygal.graph.graph import Graph
from pygal.style import Style


sys.path.insert(0, _cwd)

# Theme tokens — Imprint palette
THEME = os.getenv("ANYPLOT_THEME", "light")
PAGE_BG = "#FAF8F1" if THEME == "light" else "#1A1A17"
ELEVATED_BG = "#FFFDF6" if THEME == "light" else "#242420"
INK = "#1A1A17" if THEME == "light" else "#F0EFE8"
INK_SOFT = "#4A4A44" if THEME == "light" else "#B8B7B0"
INK_MUTED = "#6B6A63" if THEME == "light" else "#A8A79F"
IMPRINT_PALETTE = ("#009E73", "#C475FD", "#4467A3", "#BD8233", "#AE3030", "#2ABCCD", "#954477", "#99B314")


class LossTriangleHeatmap(Graph):
    _series_margin = 0

    def __init__(self, *args, **kwargs):
        self.matrix_data = kwargs.pop("matrix_data", [])
        self.projected_mask = kwargs.pop("projected_mask", [])
        self.row_labels = kwargs.pop("row_labels", [])
        self.col_labels = kwargs.pop("col_labels", [])
        self.dev_factors = kwargs.pop("dev_factors", [])
        self.imprint_seq = kwargs.pop("imprint_seq", [])
        super().__init__(*args, **kwargs)

    def _lerp_color(self, c0, c1, t):
        r = int(round(int(c0[1:3], 16) + (int(c1[1:3], 16) - int(c0[1:3], 16)) * t))
        g = int(round(int(c0[3:5], 16) + (int(c1[3:5], 16) - int(c0[3:5], 16)) * t))
        b = int(round(int(c0[5:7], 16) + (int(c1[5:7], 16) - int(c0[5:7], 16)) * t))
        return f"#{r:02X}{g:02X}{b:02X}"

    def _value_to_color(self, value, min_val, max_val):
        cmap = self.imprint_seq
        if max_val == min_val:
            return cmap[len(cmap) // 2]
        normalized = max(0.0, min(1.0, (value - min_val) / (max_val - min_val)))
        pos = normalized * (len(cmap) - 1)
        i = int(pos)
        return self._lerp_color(cmap[i], cmap[min(i + 1, len(cmap) - 1)], pos - i)

    def _ink_for_bg(self, bg_hex, opacity=1.0):
        r = int(bg_hex[1:3], 16)
        g = int(bg_hex[3:5], 16)
        b = int(bg_hex[5:7], 16)
        if opacity < 1.0:
            pr = int(PAGE_BG[1:3], 16)
            pg = int(PAGE_BG[3:5], 16)
            pb = int(PAGE_BG[5:7], 16)
            r = int(r * opacity + pr * (1 - opacity))
            g = int(g * opacity + pg * (1 - opacity))
            b = int(b * opacity + pb * (1 - opacity))
        luminance = (r * 299 + g * 587 + b * 114) / 1000
        # In dark mode the blended cell is dark: low luminance needs light text
        if THEME == "dark":
            return INK if luminance < 140 else ELEVATED_BG
        return INK if luminance > 140 else ELEVATED_BG

    def _plot(self):
        if not self.matrix_data:
            return

        n_rows = len(self.matrix_data)
        n_cols = len(self.matrix_data[0])
        all_vals = [v for row in self.matrix_data for v in row if v is not None]
        min_val, max_val = min(all_vals), max(all_vals)

        plot_w = self.view.width
        plot_h = self.view.height

        # Margins within the view area for axis labels and colorbar
        lml = 200  # left: accident year labels + axis title
        lmr = 195  # right: colorbar
        lmt = 90  # top: column headers
        lmb = 10  # bottom

        aw = plot_w - lml - lmr
        ah = plot_h - lmt - lmb
        cw = aw / n_cols
        ch = ah / (n_rows + 1.25)  # extra row for dev factors
        gap = 3

        gw = n_cols * (cw + gap) - gap
        gh = n_rows * (ch + gap) - gap

        xo = self.view.x(0) + lml + (aw - gw) / 2
        yo = self.view.y(n_rows) + lmt + (ah - gh - ch * 1.1) / 2

        pn = self.nodes["plot"]

        # SVG defs: hatch pattern for projected cells + colorbar gradient
        defs = self.svg.node(pn, "defs")
        pat = self.svg.node(
            defs,
            "pattern",
            id="hatch-proj",
            patternUnits="userSpaceOnUse",
            width="10",
            height="10",
            patternTransform="rotate(45)",
        )
        hl = self.svg.node(pat, "line", x1="0", y1="0", x2="0", y2="10")
        hl.set("stroke", INK_MUTED)
        hl.set("stroke-width", "2.5")
        hl.set("opacity", "0.40")

        cf = max(22, min(30, int(cw * 0.42)))

        # Column axis header
        ht = self.svg.node(pn, "text", x=xo + gw / 2, y=yo - 62)
        ht.set("text-anchor", "middle")
        ht.set("fill", INK_SOFT)
        ht.set("style", f"font-size:{cf + 4}px;font-weight:600;font-family:sans-serif")
        ht.text = "Development Period (Years)"

        # Column headers (period numbers)
        for j, lbl in enumerate(self.col_labels):
            t = self.svg.node(pn, "text", x=xo + j * (cw + gap) + cw / 2, y=yo - 16)
            t.set("text-anchor", "middle")
            t.set("fill", INK)
            t.set("style", f"font-size:{cf}px;font-weight:700;font-family:sans-serif")
            t.text = str(lbl)

        rf = max(22, min(30, int(ch * 0.50)))

        # Row labels (accident years)
        for i, lbl in enumerate(self.row_labels):
            t = self.svg.node(pn, "text", x=xo - 16, y=yo + i * (ch + gap) + ch / 2 + rf * 0.35)
            t.set("text-anchor", "end")
            t.set("fill", INK)
            t.set("style", f"font-size:{rf}px;font-weight:600;font-family:sans-serif")
            t.text = str(lbl)

        # Y-axis title (rotated)
        rty = yo + gh / 2
        rtx = xo - 148
        rt = self.svg.node(pn, "text", x=rtx, y=rty)
        rt.set("text-anchor", "middle")
        rt.set("fill", INK_SOFT)
        rt.set("style", f"font-size:{cf + 4}px;font-weight:600;font-family:sans-serif")
        rt.set("transform", f"rotate(-90,{rtx},{rty})")
        rt.text = "Accident Year"

        vf = max(20, min(32, int(min(cw, ch) * 0.48)))

        # Draw cells: single Imprint sequential colormap; projected cells use
        # reduced opacity + hatching + dashed border (vs. dual-colormap approach)
        for i in range(n_rows):
            for j in range(n_cols):
                val = self.matrix_data[i][j]
                if val is None:
                    continue
                proj = self.projected_mask[i][j]
                opac = 0.52 if proj else 1.0
                col = self._value_to_color(val, min_val, max_val)
                tcol = self._ink_for_bg(col, opac)
                cx = xo + j * (cw + gap)
                cy = yo + i * (ch + gap)

                cg = self.svg.node(pn, "g", class_="cell")
                rect = self.svg.node(cg, "rect", x=cx, y=cy, width=cw, height=ch, rx=3, ry=3)
                rect.set("fill", col)
                rect.set("opacity", str(opac))
                rect.set("stroke", PAGE_BG)
                rect.set("stroke-width", "2")

                if proj:
                    hr = self.svg.node(cg, "rect", x=cx, y=cy, width=cw, height=ch, rx=3, ry=3)
                    hr.set("fill", "url(#hatch-proj)")
                    hr.set("opacity", "0.65")
                    br = self.svg.node(cg, "rect", x=cx + 2, y=cy + 2, width=cw - 4, height=ch - 4, rx=2, ry=2)
                    br.set("fill", "none")
                    br.set("stroke", INK_SOFT)
                    br.set("stroke-width", "2")
                    br.set("stroke-dasharray", "6,4")
                    br.set("opacity", "0.55")

                yr_lbl = self.row_labels[i] if i < len(self.row_labels) else ""
                dp_lbl = self.col_labels[j] if j < len(self.col_labels) else ""
                self._tooltip_data(
                    cg,
                    self.value_formatter(val),
                    cx + cw / 2,
                    cy + ch / 2,
                    xlabel=f"AY {yr_lbl} / Dev {dp_lbl} ({'Projected' if proj else 'Actual'})",
                )

                tx = self.svg.node(cg, "text", x=cx + cw / 2, y=cy + ch / 2 + vf * 0.35)
                tx.set("text-anchor", "middle")
                tx.set("fill", tcol)
                tx.set(
                    "style",
                    f"font-size:{vf}px;font-weight:{'400' if proj else '500'};"
                    f"font-style:{'italic' if proj else 'normal'};font-family:sans-serif",
                )
                tx.text = self.value_formatter(val)

        # Evaluation date diagonal
        diag = []
        for k in range(n_rows + 1):
            ci = n_rows - k
            if 0 <= ci <= n_cols and 0 <= k <= n_rows:
                diag.append((xo + ci * (cw + gap) - gap / 2, yo + k * (ch + gap) - gap / 2))
        if len(diag) > 1:
            dl = self.svg.line(pn, diag, close=False, class_="eval-date-line")
            dl.set("fill", "none")
            dl.set("stroke", INK)
            dl.set("stroke-width", "4")
            dl.set("stroke-dasharray", "12,6")
            dl.set("opacity", "0.75")

        # Development factors row
        dff = max(18, min(24, int(cw * 0.32)))
        dfy = yo + gh + 34
        if self.dev_factors:
            sl = self.svg.node(pn, "line", x1=xo, y1=yo + gh + 12, x2=xo + gw, y2=yo + gh + 12)
            sl.set("stroke", INK_MUTED)
            sl.set("stroke-width", "1.5")
            t = self.svg.node(pn, "text", x=xo - 16, y=dfy + dff * 0.35)
            t.set("text-anchor", "end")
            t.set("fill", INK_SOFT)
            t.set("style", f"font-size:{dff}px;font-weight:700;font-family:sans-serif")
            t.text = "Dev Factor"
            for j, fac in enumerate(self.dev_factors):
                if fac is None:
                    continue
                t = self.svg.node(pn, "text", x=xo + j * (cw + gap) + cw / 2, y=dfy + dff * 0.35)
                t.set("text-anchor", "middle")
                t.set("fill", INK_SOFT)
                t.set("style", f"font-size:{dff}px;font-weight:500;font-family:sans-serif")
                t.text = f"{fac:.3f}"

        # Colorbar with SVG gradient
        cbw = 32
        cbh = gh * 0.74
        cbx = xo + gw + 44
        cby = yo + (gh - cbh) / 2
        grad = self.svg.node(defs, "linearGradient", id="cb-grad", x1="0", y1="0", x2="0", y2="1")
        for fi in range(21):
            f = fi / 20.0
            c = self._value_to_color(max_val - (max_val - min_val) * f, min_val, max_val)
            stop = self.svg.node(grad, "stop", offset=f"{f * 100}%")
            stop.set("stop-color", c)
        cbr = self.svg.node(pn, "rect", x=cbx, y=cby, width=cbw, height=cbh, rx=4, ry=4)
        cbr.set("fill", "url(#cb-grad)")
        cbr.set("stroke", INK_MUTED)
        cbr.set("stroke-width", "1.5")
        cls = 22
        for fp, fval in [
            (0.0, max_val),
            (0.25, max_val * 0.75 + min_val * 0.25),
            (0.5, (max_val + min_val) / 2),
            (0.75, max_val * 0.25 + min_val * 0.75),
            (1.0, min_val),
        ]:
            ty = cby + cbh * fp
            tk = self.svg.node(pn, "line", x1=cbx + cbw, y1=ty, x2=cbx + cbw + 6, y2=ty)
            tk.set("stroke", INK_MUTED)
            tk.set("stroke-width", "1.5")
            tl = self.svg.node(pn, "text", x=cbx + cbw + 10, y=ty + cls * 0.35)
            tl.set("fill", INK_SOFT)
            tl.set("style", f"font-size:{cls}px;font-family:sans-serif")
            tl.text = self.value_formatter(fval)
        cbt = self.svg.node(pn, "text", x=cbx + cbw / 2, y=cby - 18)
        cbt.set("text-anchor", "middle")
        cbt.set("fill", INK_SOFT)
        cbt.set("style", f"font-size:{cls + 2}px;font-weight:600;font-family:sans-serif")
        cbt.text = "Cumulative ($k)"

        # Legend
        lgf = 22
        lgy = dfy + dff + 16 if self.dev_factors else yo + gh + 34
        lgw_total = 610
        lgx = xo + (gw - lgw_total) / 2
        mid_col = self._value_to_color((min_val + max_val) / 2, min_val, max_val)

        # Actual swatch
        self.svg.node(pn, "rect", x=lgx, y=lgy, width=26, height=18, fill=mid_col, stroke=INK_MUTED, rx=3, ry=3)
        tl_a = self.svg.node(pn, "text", x=lgx + 34, y=lgy + 13)
        tl_a.set("fill", INK)
        tl_a.set("style", f"font-size:{lgf}px;font-weight:600;font-family:sans-serif")
        tl_a.text = "Actual (Observed)"

        # Projected swatch (same color, reduced opacity + hatch overlay + dashed border)
        px2 = lgx + 250
        ps = self.svg.node(pn, "rect", x=px2, y=lgy, width=26, height=18, fill=mid_col, rx=3, ry=3)
        ps.set("opacity", "0.52")
        ps.set("stroke", INK_MUTED)
        ph2 = self.svg.node(pn, "rect", x=px2, y=lgy, width=26, height=18, fill="url(#hatch-proj)", rx=3, ry=3)
        ph2.set("opacity", "0.65")
        pb2 = self.svg.node(pn, "rect", x=px2 + 2, y=lgy + 2, width=22, height=14, fill="none", rx=2, ry=2)
        pb2.set("stroke", INK_SOFT)
        pb2.set("stroke-width", "1.5")
        pb2.set("stroke-dasharray", "4,3")
        pb2.set("opacity", "0.55")
        tl_p = self.svg.node(pn, "text", x=px2 + 34, y=lgy + 13)
        tl_p.set("fill", INK)
        tl_p.set("style", f"font-size:{lgf}px;font-weight:600;font-family:sans-serif")
        tl_p.text = "Projected (IBNR)"

        # Evaluation date line swatch
        ex = px2 + 250
        ey = lgy + 9
        el = self.svg.node(pn, "line", x1=ex, y1=ey, x2=ex + 36, y2=ey)
        el.set("stroke", INK)
        el.set("stroke-width", "3")
        el.set("stroke-dasharray", "8,4")
        el.set("opacity", "0.75")
        tl_e = self.svg.node(pn, "text", x=ex + 46, y=lgy + 13)
        tl_e.set("fill", INK)
        tl_e.set("style", f"font-size:{lgf}px;font-weight:600;font-family:sans-serif")
        tl_e.text = "Evaluation Date"

    def _compute(self):
        n = len(self.matrix_data) if self.matrix_data else 1
        m = len(self.matrix_data[0]) if self.matrix_data and self.matrix_data[0] else 1
        self._box.xmin, self._box.xmax = 0, m
        self._box.ymin, self._box.ymax = 0, n


# Data: Cumulative paid claims triangle (in thousands)
np.random.seed(42)

accident_years = list(range(2015, 2025))
development_periods = list(range(1, 11))
n_years = len(accident_years)
n_periods = len(development_periods)

base_ultimate = np.array([4200, 4500, 4800, 5100, 5400, 5700, 6000, 6300, 6600, 7000], dtype=float)
dev_pattern = np.array([0.15, 0.35, 0.52, 0.66, 0.78, 0.87, 0.93, 0.97, 0.99, 1.00])

triangle = np.zeros((n_years, n_periods))
is_projected = [[False] * n_periods for _ in range(n_years)]

for i in range(n_years):
    for j in range(n_periods):
        base_val = base_ultimate[i] * dev_pattern[j]
        noise = np.random.normal(0, base_val * 0.03)
        triangle[i][j] = round(base_val + noise, 0)
        if i + j >= n_years:
            is_projected[i][j] = True

matrix_data = triangle.tolist()

# Age-to-age development factors (weighted average over actual data only)
dev_factors = []
for j in range(n_periods - 1):
    num, den = 0.0, 0.0
    for i in range(n_years):
        if not is_projected[i][j] and not is_projected[i][j + 1]:
            num += triangle[i][j + 1]
            den += triangle[i][j]
    dev_factors.append(num / den if den > 0 else None)
dev_factors.append(None)  # no factor for last period

# Imprint sequential colormap: brand green (#009E73) → blue (#4467A3), 12 stops
_ns = 12
imprint_seq = []
for _i in range(_ns):
    _t = _i / (_ns - 1)
    _r = int(round(0x00 + (0x44 - 0x00) * _t))
    _g = int(round(0x9E + (0x67 - 0x9E) * _t))
    _b = int(round(0x73 + (0xA3 - 0x73) * _t))
    imprint_seq.append(f"#{_r:02X}{_g:02X}{_b:02X}")

chart_title = "heatmap-loss-triangle · python · pygal · anyplot.ai"
title_n = len(chart_title)
title_fs = round(66 * 67 / title_n) if title_n > 67 else 66

# Pygal style with theme-adaptive Imprint tokens
custom_style = Style(
    background=PAGE_BG,
    plot_background=PAGE_BG,
    foreground=INK,
    foreground_strong=INK,
    foreground_subtle=INK_MUTED,
    colors=IMPRINT_PALETTE,
    title_font_size=title_fs,
    legend_font_size=44,
    label_font_size=56,
    major_label_font_size=44,
    value_font_size=36,
    tooltip_font_size=28,
    font_family="sans-serif",
)

chart = LossTriangleHeatmap(
    width=2400,
    height=2400,
    style=custom_style,
    title=chart_title,
    matrix_data=matrix_data,
    projected_mask=is_projected,
    row_labels=[str(y) for y in accident_years],
    col_labels=[str(p) for p in development_periods],
    dev_factors=dev_factors,
    imprint_seq=imprint_seq,
    value_formatter=lambda x: f"{x:,.0f}",
    show_legend=False,
    margin=80,
    margin_top=160,
    margin_bottom=80,
    margin_left=80,
    margin_right=80,
    show_x_labels=False,
    show_y_labels=False,
)

chart.add("", [0])

# Save
chart.render_to_png(f"plot-{THEME}.png")

with open(f"plot-{THEME}.html", "wb") as f:
    f.write(chart.render())
Runnable source as JSON, for any HTTP client: https://api.anyplot.ai/specs/heatmap-loss-triangle/pygal/code. Any spec id and library id listed in llms-full.txt fit the same URL shape; every URL below is complete and callable.
{
  "spec_id": "heatmap-loss-triangle",
  "language": "python",
  "library": "pygal",
  "page": "https://anyplot.ai/heatmap-loss-triangle/python/pygal",
  "hub": "https://anyplot.ai/heatmap-loss-triangle",
  "code_json": "https://api.anyplot.ai/specs/heatmap-loss-triangle/pygal/code",
  "spec_json": "https://api.anyplot.ai/specs/heatmap-loss-triangle",
  "render_light_png": "https://storage.googleapis.com/anyplot-images/plots/heatmap-loss-triangle/python/pygal/plot-light.png",
  "render_dark_png": "https://storage.googleapis.com/anyplot-images/plots/heatmap-loss-triangle/python/pygal/plot-dark.png",
  "interactive_light_html": "https://storage.googleapis.com/anyplot-images/plots/heatmap-loss-triangle/python/pygal/plot-light.html",
  "interactive_dark_html": "https://storage.googleapis.com/anyplot-images/plots/heatmap-loss-triangle/python/pygal/plot-dark.html",
  "quality_score": 86.0,
  "license": "MIT",
  "guide": "https://anyplot.ai/llms.txt"
}
Part of Actuarial Loss Development Triangle on anyplot.ai.