The same plot in 14 other libraries — JavaScript: Chart.js, D3.js, Highcharts, MUI X Charts; Python: Altair, Bokeh, lets-plot, Matplotlib, Plotly, plotnine, Pygal, Seaborn; R: ggplot2; Julia: Makie.jl. Compare all 15 side by side: Actuarial Loss Development Triangle in Python, R, Julia and JavaScript.
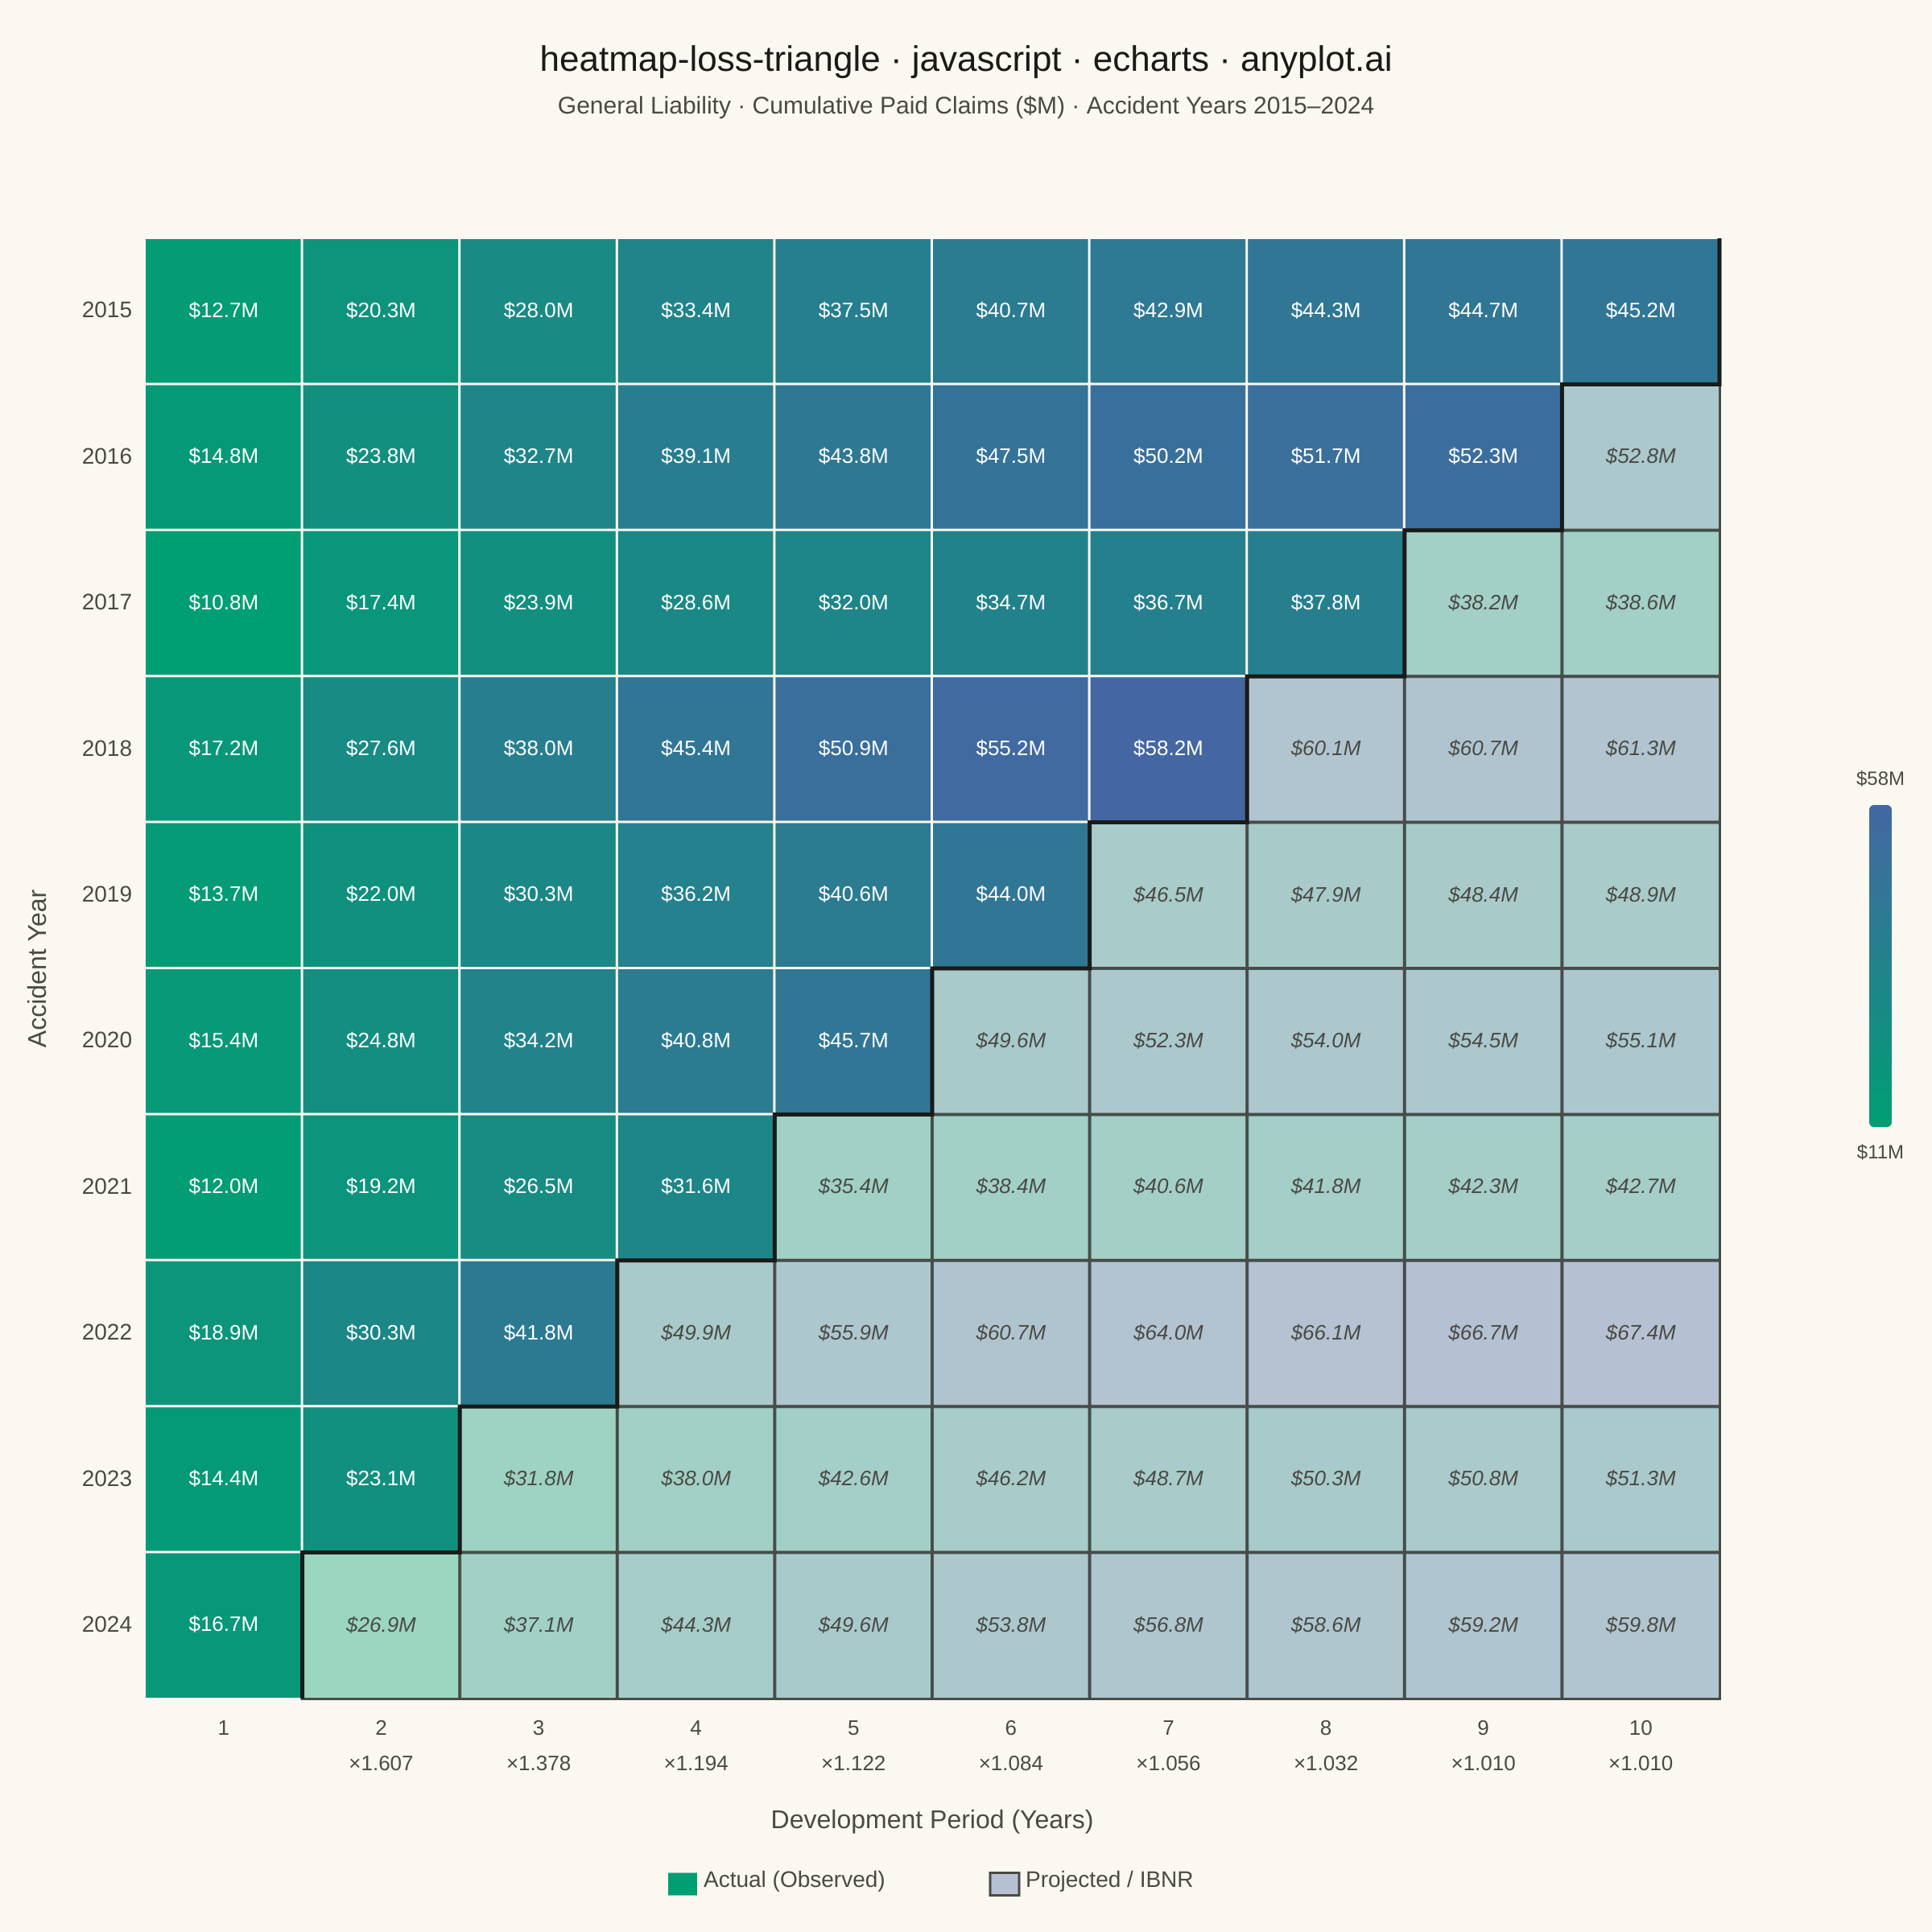
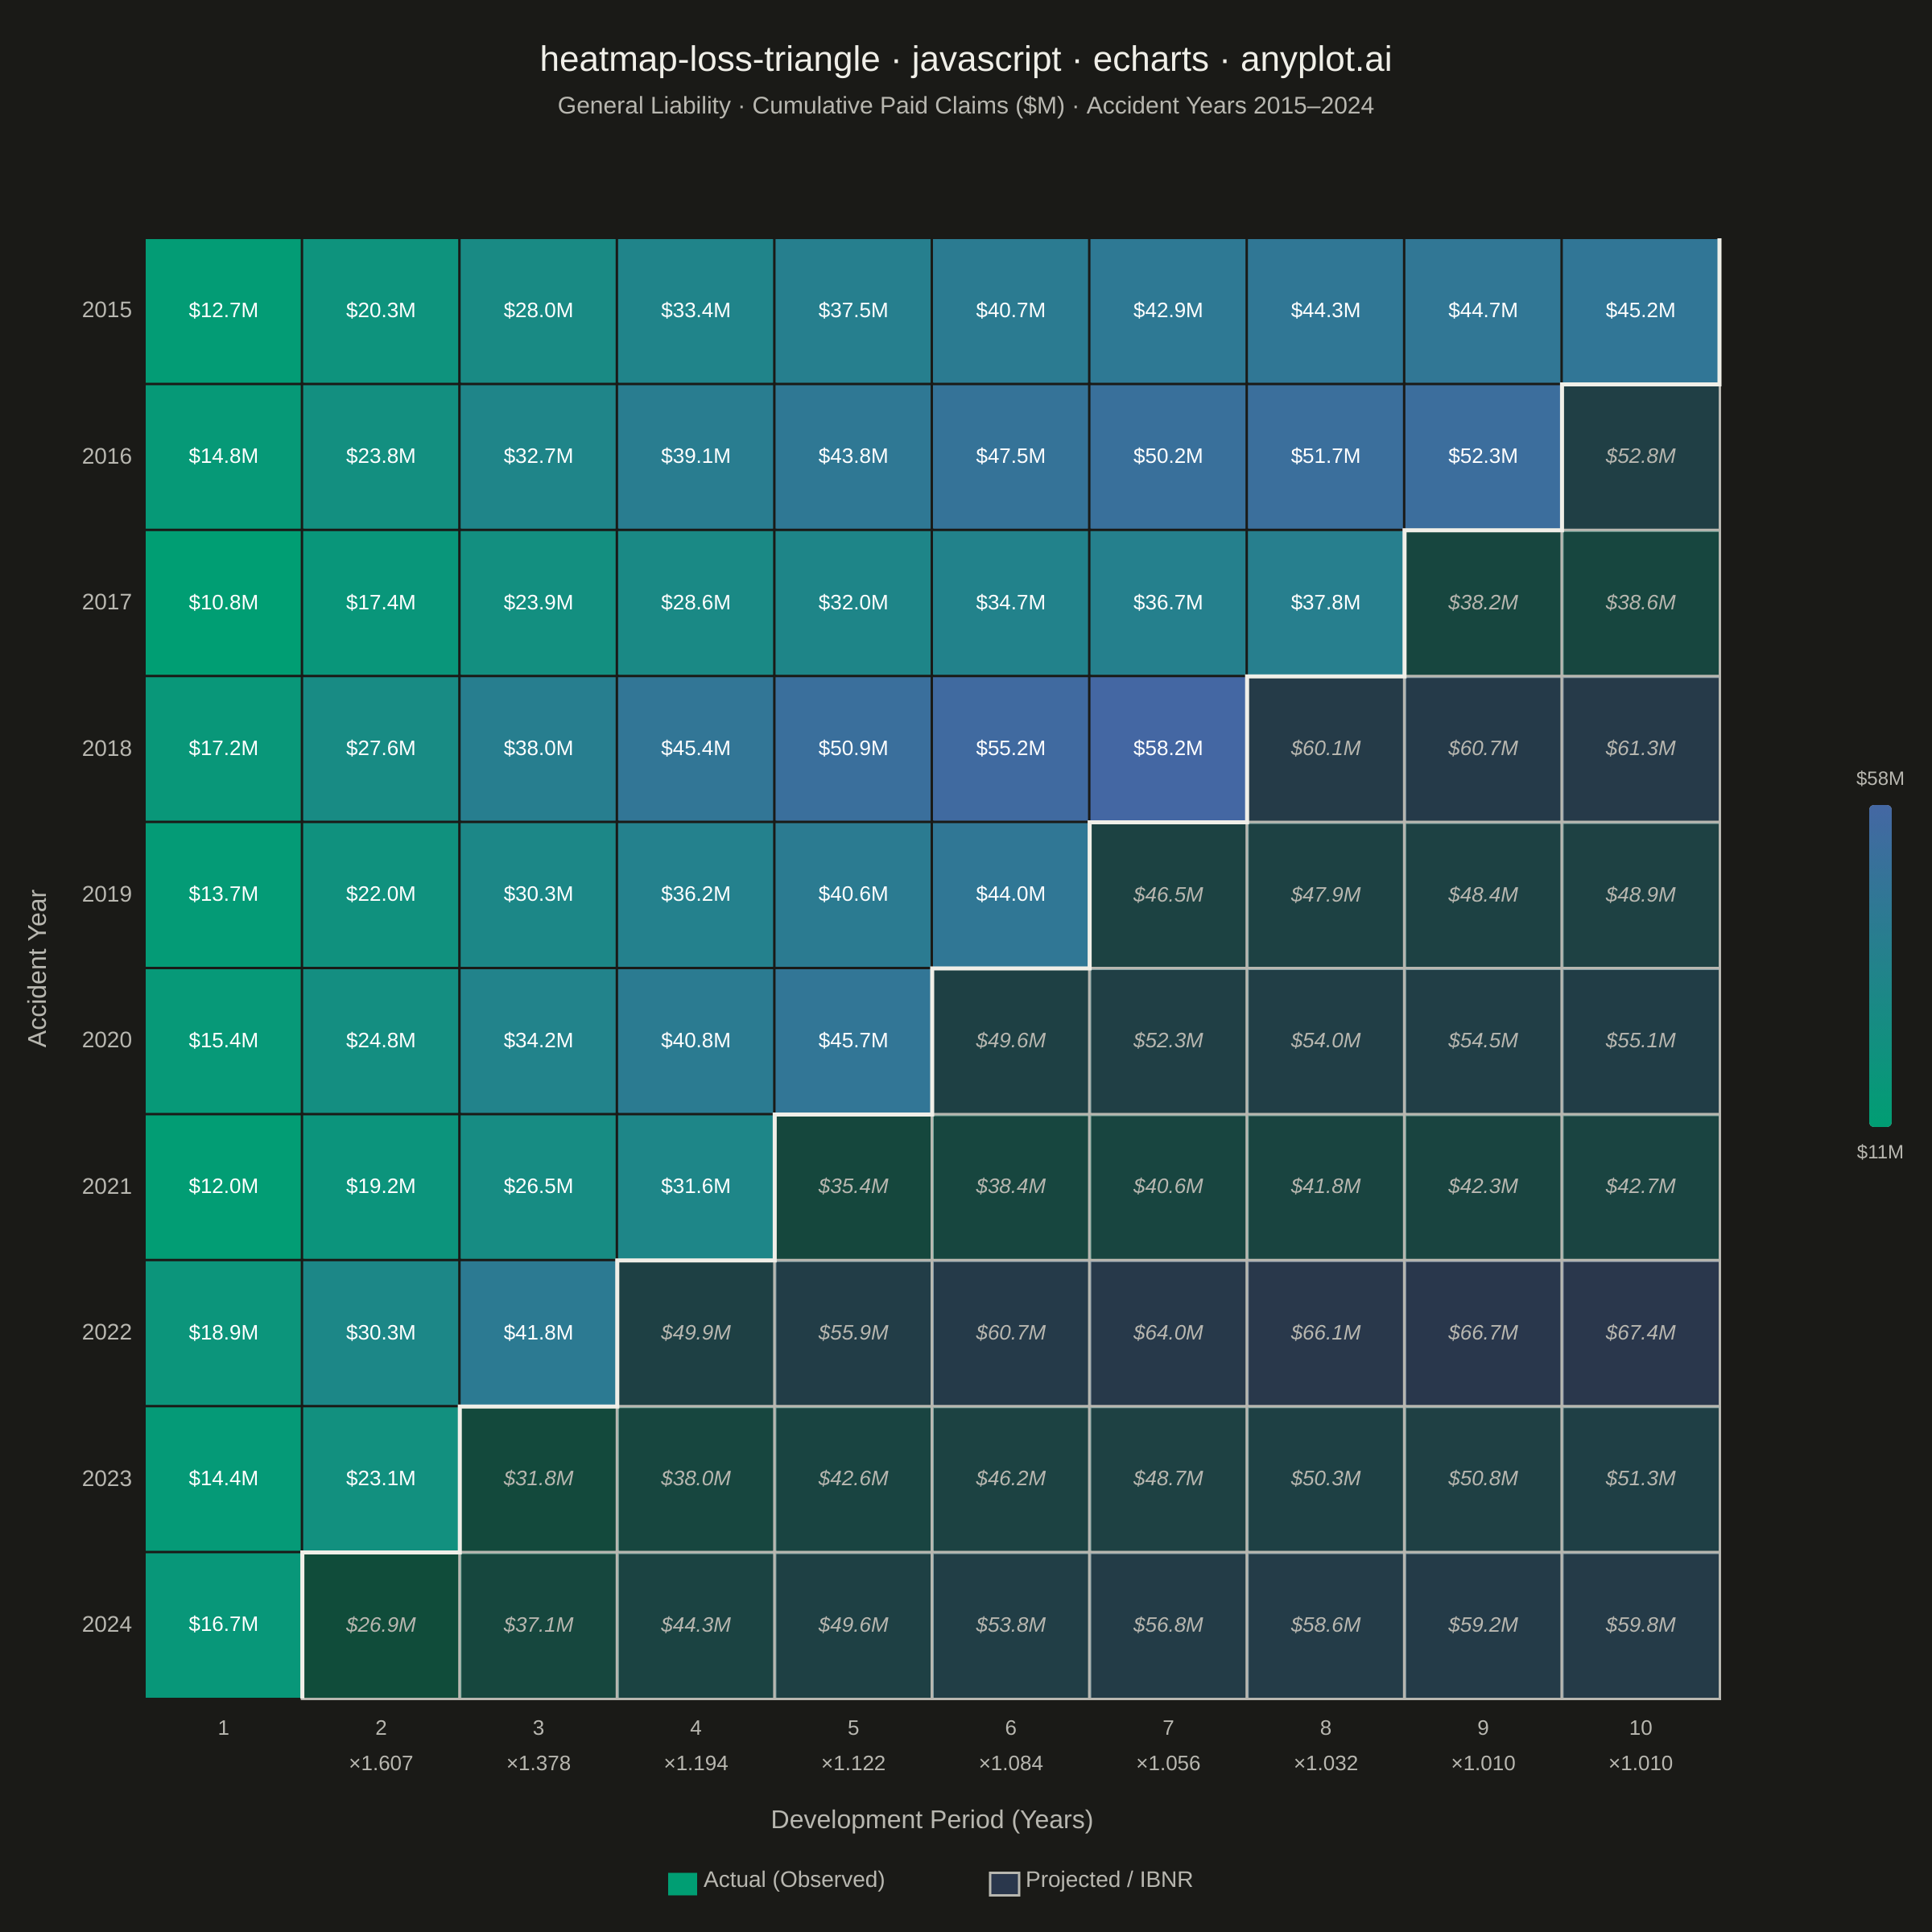
A triangular matrix visualization showing cumulative insurance claim payments developing over time. Rows represent accident/origin years, columns represent development periods (e.g., 1-10 years), with the upper-left triangle displaying actual observed cumulative claims and the lower-right triangle showing projected/estimated values (IBNR). This plot is essential for actuarial reserving, enabling analysts to visualize the chain-ladder method and identify development patterns in loss data.
// anyplot.ai
// heatmap-loss-triangle: Actuarial Loss Development Triangle
// Library: echarts 5.5.1 | JavaScript 22.22.3
// Quality: 89/100 | Created: 2026-06-03
//# anyplot-orientation: square

const t = window.ANYPLOT_TOKENS;

// --- Data -------------------------------------------------------------------
// General liability insurance portfolio
// 10 accident years (2015–2024) × 10 development periods

const accidentYears = ["2015","2016","2017","2018","2019","2020","2021","2022","2023","2024"];
const devPeriods = ["1","2","3","4","5","6","7","8","9","10"];

// Cumulative paid claims as % of ultimate (typical general liability development pattern)
const pctPaid = [0.28, 0.45, 0.62, 0.74, 0.83, 0.90, 0.95, 0.98, 0.99, 1.00];

// Ultimate loss estimates by accident year ($M) — deterministic
const ultimates = [45.2, 52.8, 38.6, 61.3, 48.9, 55.1, 42.7, 67.4, 51.3, 59.8];

// Age-to-age link ratio factors between consecutive development periods
const ataFactors = pctPaid.slice(1).map((v, i) => (v / pctPaid[i]).toFixed(3));

// Triangle boundary: accident year i (0=2015) has actual data for periods j <= (9-i)
const actualData = [];
const projectedData = [];
let actualMin = Infinity, actualMax = 0;
let projectedMin = Infinity, projectedMax = 0;

for (let i = 0; i < 10; i++) {
  for (let j = 0; j < 10; j++) {
    const value = +(ultimates[i] * pctPaid[j]).toFixed(1);
    if (j <= 9 - i) {
      actualData.push([j, i, value]);
      if (value < actualMin) actualMin = value;
      if (value > actualMax) actualMax = value;
    } else {
      projectedData.push([j, i, value]);
      if (value < projectedMin) projectedMin = value;
      if (value > projectedMax) projectedMax = value;
    }
  }
}

// --- Grid geometry for evaluation-date boundary line (CSS pixels, 1200×1200 canvas) ---
const gridLeft = 90, gridRight = 132, gridTop = 148, gridBottom = 145;
const canvasW = 1200;
const gridW = canvasW - gridLeft - gridRight; // 978
const gridH = canvasW - gridTop - gridBottom; // 907
const cellW = gridW / 10;
const cellH = gridH / 10;

// Staircase polyline tracing the diagonal boundary between actual and projected regions
const boundaryPoints = [[gridLeft + 10 * cellW, gridTop]];
for (let i = 0; i < 10; i++) {
  const x = gridLeft + (10 - i) * cellW;
  const yBot = gridTop + (i + 1) * cellH;
  boundaryPoints.push([x, yBot]);
  if (i < 9) {
    boundaryPoints.push([gridLeft + (10 - i - 1) * cellW, yBot]);
  }
}

// Legend centering: two items ~370px wide total
const legendLeft = Math.round((canvasW - 370) / 2);

// --- Init -------------------------------------------------------------------
const chart = echarts.init(document.getElementById("container"));

// --- Option -----------------------------------------------------------------
chart.setOption({
  animation: false,
  backgroundColor: "transparent",

  title: {
    text: "heatmap-loss-triangle · javascript · echarts · anyplot.ai",
    subtext: "General Liability · Cumulative Paid Claims ($M) · Accident Years 2015–2024",
    left: "center",
    top: 22,
    textStyle: { color: t.ink, fontSize: 22, fontWeight: "normal" },
    subtextStyle: { color: t.inkSoft, fontSize: 15 }
  },

  grid: {
    left: gridLeft,
    right: gridRight,
    top: gridTop,
    bottom: gridBottom
  },

  xAxis: {
    type: "category",
    data: devPeriods,
    name: "Development Period (Years)",
    nameLocation: "middle",
    nameGap: 68,
    nameTextStyle: { color: t.inkSoft, fontSize: 16 },
    axisLabel: {
      color: t.inkSoft,
      fontSize: 13,
      interval: 0,
      lineHeight: 22,
      formatter: (value, index) =>
        index > 0 ? `${value}\n×${ataFactors[index - 1]}` : `${value}\n`
    },
    axisLine: { lineStyle: { color: t.inkSoft } },
    axisTick: { show: false },
    splitLine: { show: false }
  },

  yAxis: {
    type: "category",
    data: accidentYears,
    name: "Accident Year",
    nameLocation: "middle",
    nameGap: 58,
    nameTextStyle: { color: t.inkSoft, fontSize: 16 },
    axisLabel: { color: t.inkSoft, fontSize: 14 },
    axisLine: { lineStyle: { color: t.inkSoft } },
    axisTick: { show: false },
    splitLine: { show: false },
    inverse: true
  },

  visualMap: [
    {
      // Actual cells: full Imprint sequential colormap with colorbar
      min: actualMin,
      max: actualMax,
      seriesIndex: [0],
      show: true,
      orient: "vertical",
      right: 12,
      top: "middle",
      itemHeight: 200,
      itemWidth: 14,
      inRange: { color: t.seq || ["#009E73", "#4467A3"] },
      text: [
        "$" + Math.round(actualMax) + "M",
        "$" + Math.round(actualMin) + "M"
      ],
      textStyle: { color: t.inkSoft, fontSize: 12 },
      calculable: false
    },
    {
      // Projected cells: muted (38% opacity) variant of imprint_seq — encodes magnitude
      min: projectedMin,
      max: projectedMax,
      seriesIndex: [1],
      show: false,
      inRange: { color: ["rgba(0,158,115,0.38)", "rgba(68,103,163,0.38)"] }
    }
  ],

  series: [
    {
      name: "Actual",
      type: "heatmap",
      data: actualData,
      label: {
        show: true,
        fontSize: 13,
        color: "#FFFFFF",
        formatter: (p) => "$" + p.value[2].toFixed(1) + "M"
      },
      itemStyle: {
        borderColor: t.pageBg,
        borderWidth: 1.5
      },
      emphasis: { disabled: true }
    },
    {
      name: "Projected (IBNR)",
      type: "heatmap",
      data: projectedData,
      label: {
        show: true,
        fontSize: 13,
        color: t.inkSoft,
        fontStyle: "italic",
        formatter: (p) => "$" + p.value[2].toFixed(1) + "M"
      },
      itemStyle: {
        // color controlled by second visualMap; border marks actual/projected boundary
        borderColor: t.inkSoft,
        borderWidth: 1.5
      },
      emphasis: { disabled: true }
    }
  ],

  graphic: [
    // Evaluation-date diagonal boundary — bold staircase stroke as structural landmark
    {
      type: "polyline",
      shape: { points: boundaryPoints },
      style: { stroke: t.ink, lineWidth: 2.5, fill: "none" },
      z: 10
    },
    // Bottom legend centered on canvas
    {
      type: "group",
      left: legendLeft,
      bottom: 22,
      children: [
        {
          type: "rect",
          shape: { x: 0, y: 2, width: 18, height: 14 },
          style: { fill: t.seq ? t.seq[0] : "#009E73" }
        },
        {
          type: "text",
          x: 22,
          y: 0,
          style: {
            text: "Actual (Observed)",
            fill: t.inkSoft,
            fontSize: 14,
            fontFamily: "sans-serif"
          }
        },
        {
          type: "rect",
          shape: { x: 200, y: 2, width: 18, height: 14 },
          style: {
            fill: "rgba(68,103,163,0.38)",
            stroke: t.inkSoft,
            lineWidth: 1.5
          }
        },
        {
          type: "text",
          x: 222,
          y: 0,
          style: {
            text: "Projected / IBNR",
            fill: t.inkSoft,
            fontSize: 14,
            fontFamily: "sans-serif"
          }
        }
      ]
    }
  ]
});
Runnable source as JSON, for any HTTP client: https://api.anyplot.ai/specs/heatmap-loss-triangle/echarts/code. Any spec id and library id listed in llms-full.txt fit the same URL shape; every URL below is complete and callable.
{
  "spec_id": "heatmap-loss-triangle",
  "language": "javascript",
  "library": "echarts",
  "page": "https://anyplot.ai/heatmap-loss-triangle/javascript/echarts",
  "hub": "https://anyplot.ai/heatmap-loss-triangle",
  "code_json": "https://api.anyplot.ai/specs/heatmap-loss-triangle/echarts/code",
  "spec_json": "https://api.anyplot.ai/specs/heatmap-loss-triangle",
  "render_light_png": "https://storage.googleapis.com/anyplot-images/plots/heatmap-loss-triangle/javascript/echarts/plot-light.png",
  "render_dark_png": "https://storage.googleapis.com/anyplot-images/plots/heatmap-loss-triangle/javascript/echarts/plot-dark.png",
  "interactive_light_html": "https://storage.googleapis.com/anyplot-images/plots/heatmap-loss-triangle/javascript/echarts/plot-light.html",
  "interactive_dark_html": "https://storage.googleapis.com/anyplot-images/plots/heatmap-loss-triangle/javascript/echarts/plot-dark.html",
  "quality_score": 89.0,
  "license": "MIT",
  "guide": "https://anyplot.ai/llms.txt"
}
Part of Actuarial Loss Development Triangle on anyplot.ai.