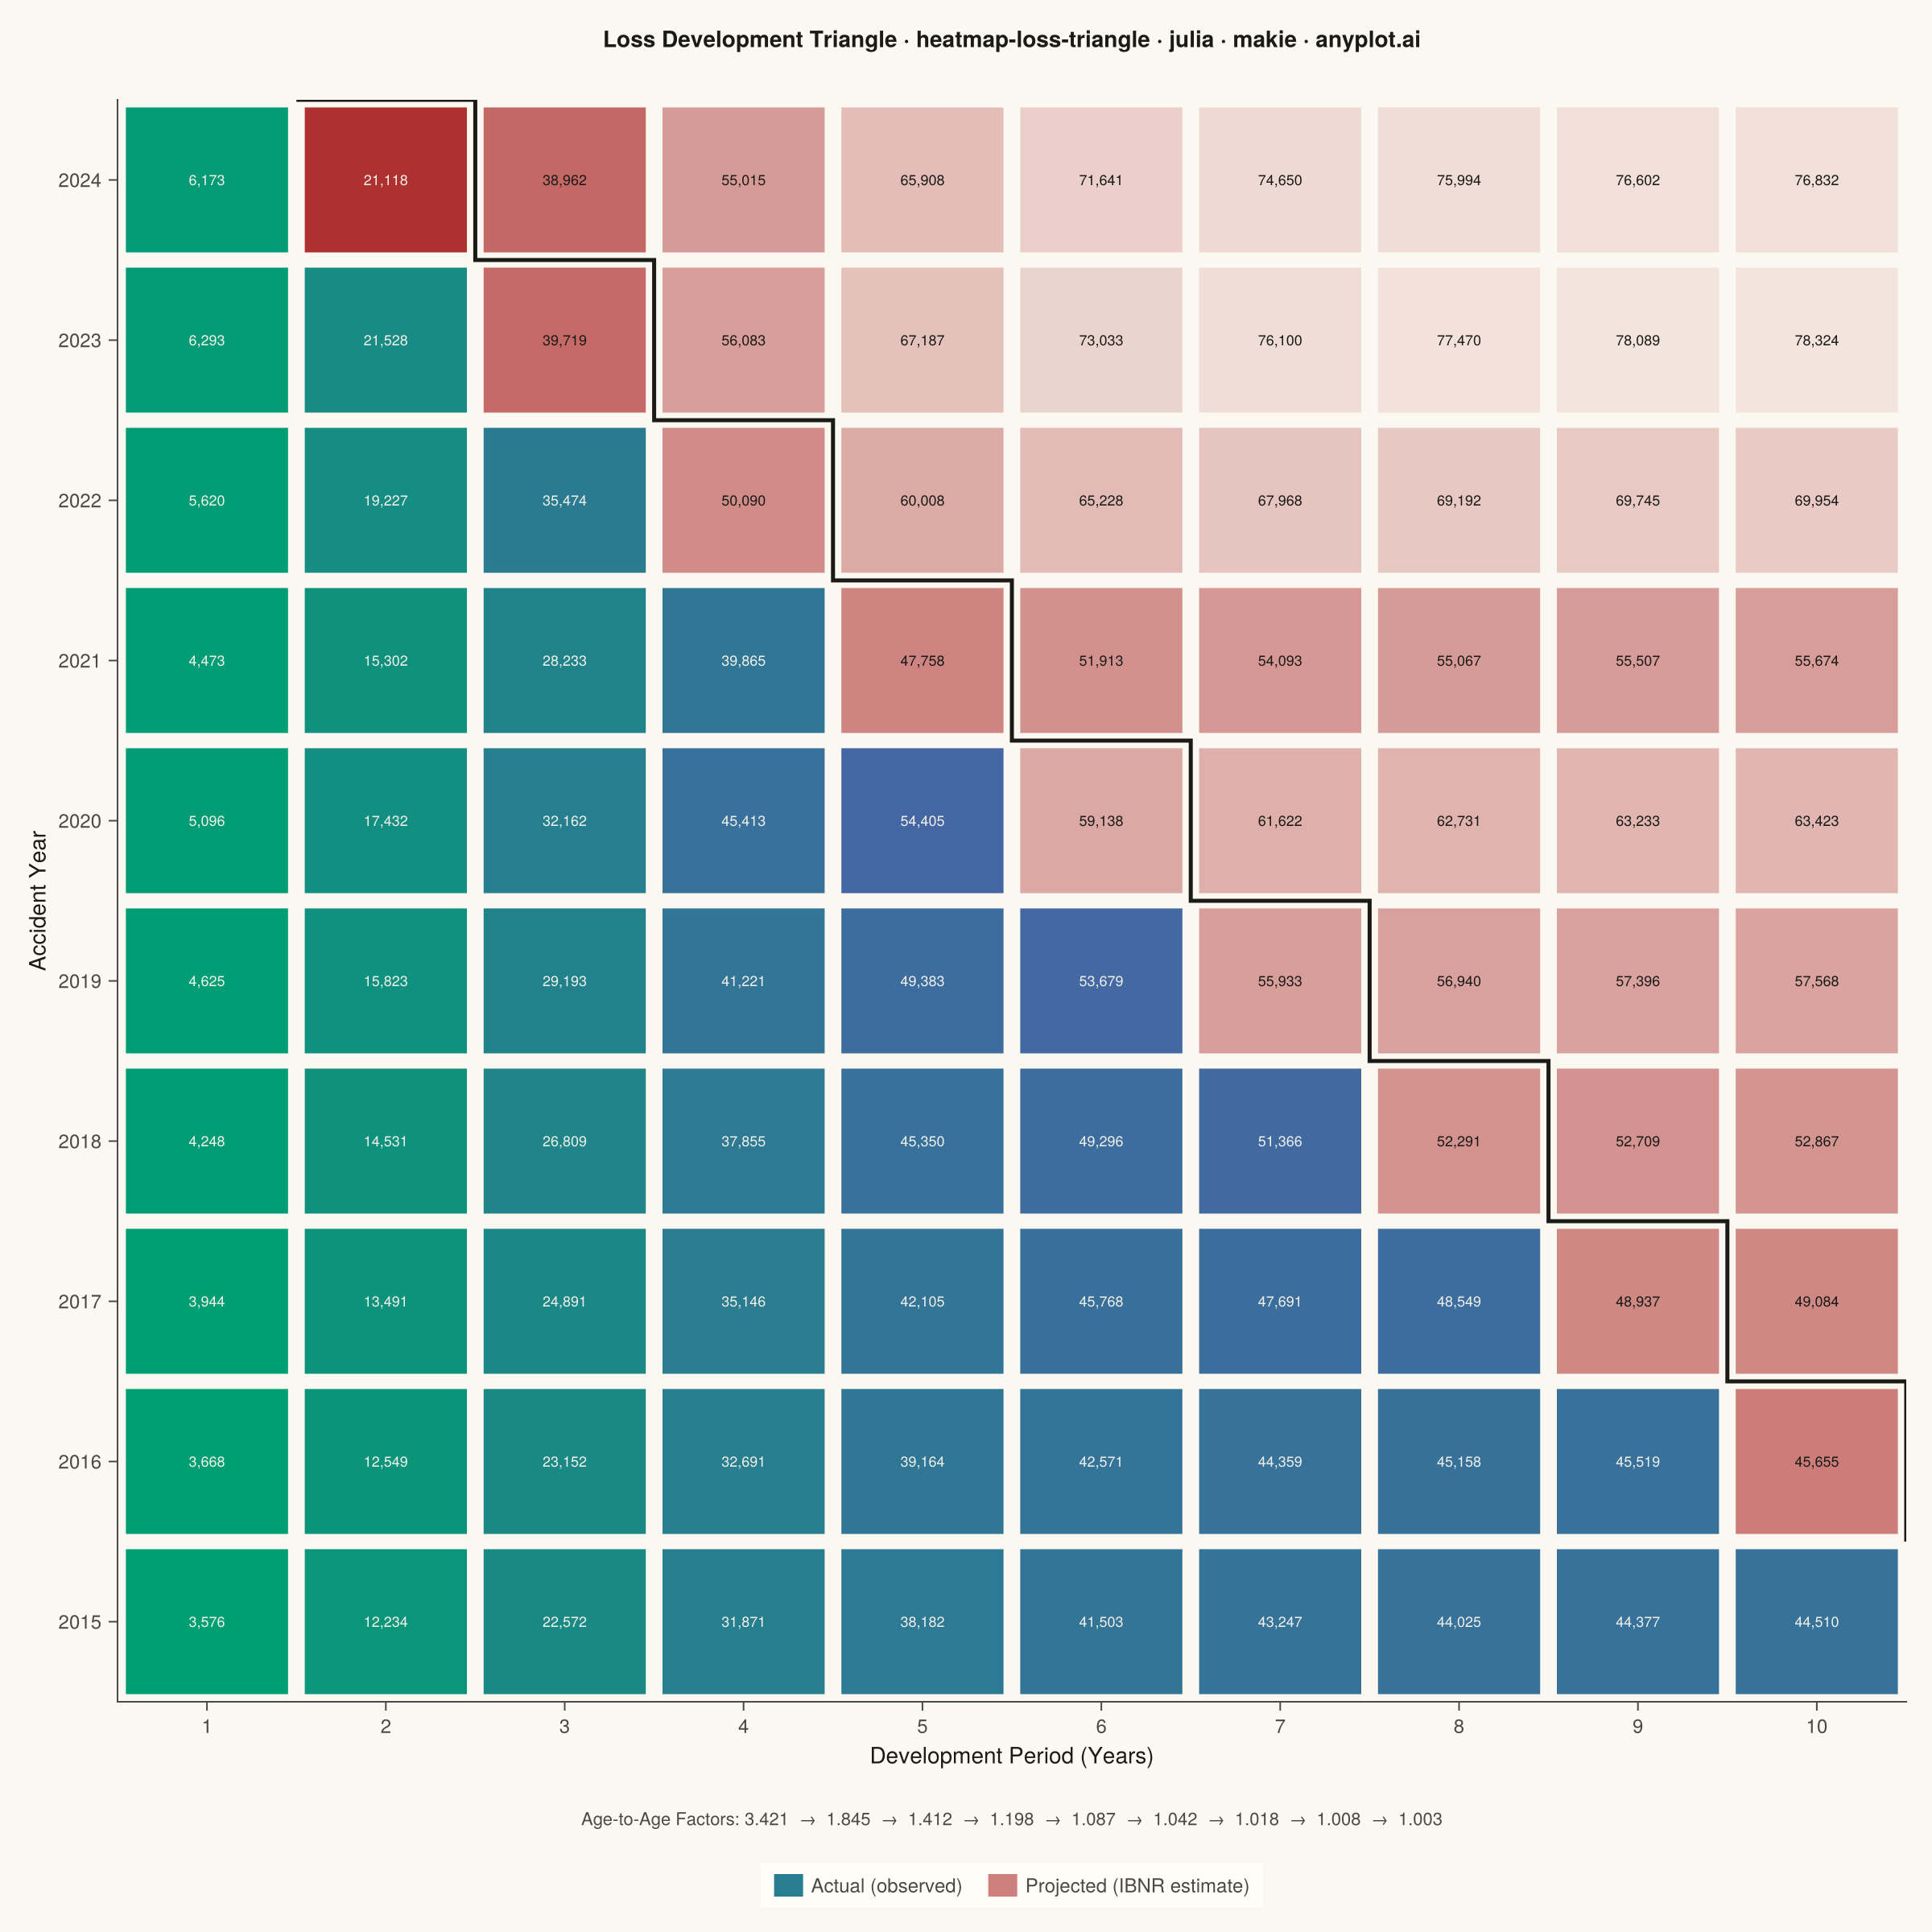
The same plot in 14 other libraries — Python: Altair, Bokeh, lets-plot, Matplotlib, Plotly, plotnine, Pygal, Seaborn; R: ggplot2; JavaScript: Chart.js, D3.js, Apache ECharts, Highcharts, MUI X Charts. Compare all 15 side by side: Actuarial Loss Development Triangle in Python, R, Julia and JavaScript.
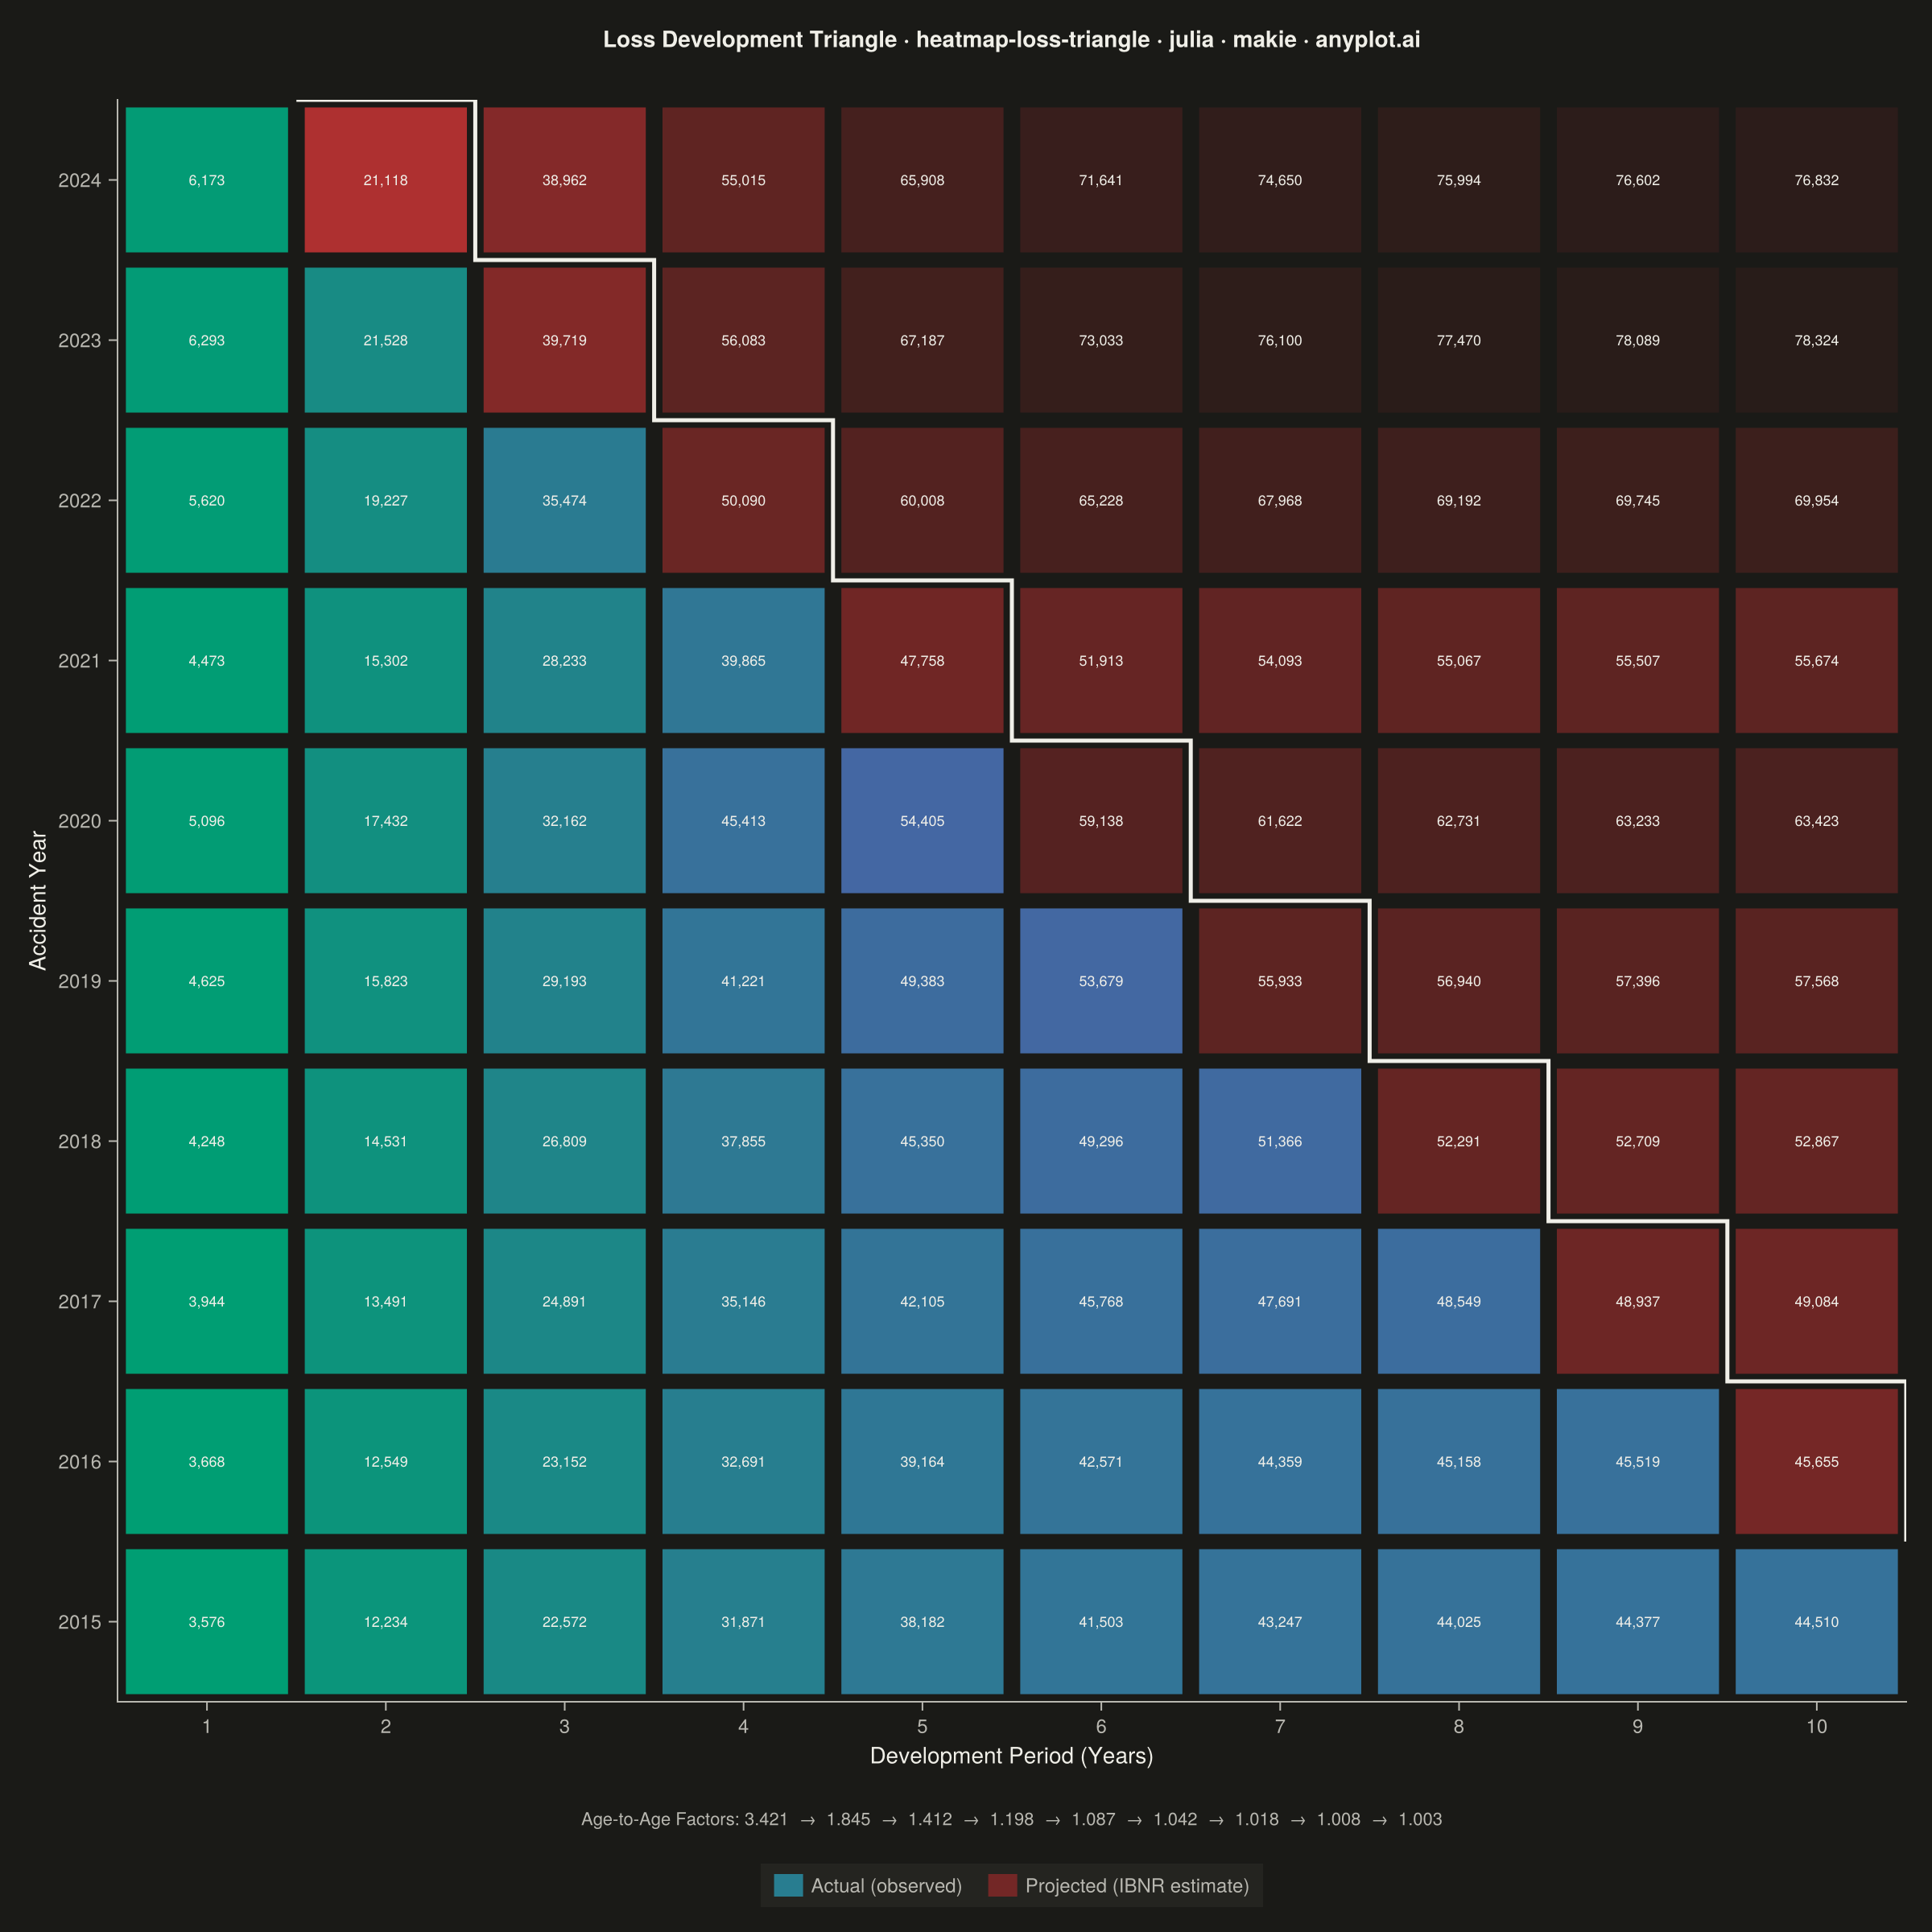
A triangular matrix visualization showing cumulative insurance claim payments developing over time. Rows represent accident/origin years, columns represent development periods (e.g., 1-10 years), with the upper-left triangle displaying actual observed cumulative claims and the lower-right triangle showing projected/estimated values (IBNR). This plot is essential for actuarial reserving, enabling analysts to visualize the chain-ladder method and identify development patterns in loss data.
# anyplot.ai
# heatmap-loss-triangle: Actuarial Loss Development Triangle
# Library: makie 0.22.10 | Julia 1.11.9
# Quality: 90/100 | Created: 2026-06-03

using CairoMakie
using Colors
using Random

Random.seed!(42)

# Theme tokens
const THEME       = get(ENV, "ANYPLOT_THEME", "light")
const PAGE_BG     = THEME == "light" ? colorant"#FAF8F1" : colorant"#1A1A17"
const ELEVATED_BG = THEME == "light" ? colorant"#FFFDF6" : colorant"#242420"
const INK         = THEME == "light" ? colorant"#1A1A17" : colorant"#F0EFE8"
const INK_SOFT    = THEME == "light" ? colorant"#4A4A44" : colorant"#B8B7B0"

# Approved Imprint colormaps
const ANYPLOT_SEQ = cgrad([colorant"#009E73", colorant"#4467A3"])
const ANYPLOT_DIV = cgrad([colorant"#AE3030", PAGE_BG, colorant"#4467A3"])

# Data: Actuarial loss development triangle
# 10 accident years (2015-2024) x 10 development periods
const N_YEARS    = 10
const N_PERIODS  = 10
const START_YEAR = 2015

# Ultimate losses per accident year (in $M)
const ULTIMATE = [42.5, 48.2, 51.8, 55.3, 60.1, 63.7, 58.9, 67.4, 72.1, 78.5]

# Age-to-age link ratios (period 1→2, 2→3, ..., 9→10)
const DEV_FACTORS = [3.421, 1.845, 1.412, 1.198, 1.087, 1.042, 1.018, 1.008, 1.003]

# Precompute percent-paid at each development period
pct_at = fill(1.0, N_PERIODS)
for k in (N_PERIODS - 1):-1:1
    pct_at[k] = pct_at[k + 1] / DEV_FACTORS[k]
end

# Build the triangle: cumulative amounts at each (year, period) cell
# Year-specific noise only: link ratios then exactly equal DEV_FACTORS (all > 1)
cum_amounts  = fill(NaN, N_YEARS, N_PERIODS)
is_projected = fill(false, N_YEARS, N_PERIODS)
yr_noise     = [1.0 + randn() * 0.06 for _ in 1:N_YEARS]

for yr in 1:N_YEARS
    max_dev = N_YEARS - yr + 1
    for dev in 1:N_PERIODS
        cum_amounts[yr, dev]  = ULTIMATE[yr] * pct_at[dev] * yr_noise[yr]
        is_projected[yr, dev] = dev > max_dev
    end
end

# Age-to-age factors as weighted average link ratios (sum col k+1 / sum col k)
dev_factor_labels = String[]
for col in 1:(N_PERIODS - 1)
    num = 0.0
    den = 0.0
    for yr in 1:N_YEARS
        if !is_projected[yr, col] && !is_projected[yr, col + 1]
            num += cum_amounts[yr, col + 1]
            den += cum_amounts[yr, col]
        end
    end
    f = den > 0 ? num / den : NaN
    push!(dev_factor_labels, isnan(f) ? "—" : string(round(f; digits=3)))
end

# Normalize for colormapping
actual_vals = [cum_amounts[yr, dev]
               for yr in 1:N_YEARS for dev in 1:N_PERIODS
               if !is_projected[yr, dev] && !isnan(cum_amounts[yr, dev])]
actual_max = maximum(actual_vals)
actual_min = minimum(actual_vals)

proj_vals = [cum_amounts[yr, dev]
             for yr in 1:N_YEARS for dev in 1:N_PERIODS
             if is_projected[yr, dev] && !isnan(cum_amounts[yr, dev])]
proj_max = isempty(proj_vals) ? 1.0 : maximum(proj_vals)
proj_min = isempty(proj_vals) ? 0.0 : minimum(proj_vals)

# Plot
fig = Figure(
    size            = (1200, 1200),
    fontsize        = 13,
    backgroundcolor = PAGE_BG,
)

# Title
Label(fig[0, 1],
    "Loss Development Triangle · heatmap-loss-triangle · julia · makie · anyplot.ai";
    fontsize  = 14,
    color     = INK,
    font      = :bold,
    padding   = (0, 0, 12, 0),
    tellwidth = false,
)

ax = Axis(
    fig[1, 1];
    backgroundcolor   = PAGE_BG,
    titlecolor        = INK,
    xlabelcolor       = INK,
    ylabelcolor       = INK,
    xticklabelcolor   = INK_SOFT,
    yticklabelcolor   = INK_SOFT,
    xtickcolor        = INK_SOFT,
    ytickcolor        = INK_SOFT,
    leftspinecolor    = INK_SOFT,
    bottomspinecolor  = INK_SOFT,
    topspinevisible   = false,
    rightspinevisible = false,
    xgridvisible      = false,
    ygridvisible      = false,
    xlabel            = "Development Period (Years)",
    ylabel            = "Accident Year",
    xlabelsize        = 14,
    ylabelsize        = 14,
    xticklabelsize    = 12,
    yticklabelsize    = 12,
    xticks            = (1:N_PERIODS, string.(1:N_PERIODS)),
    yticks            = (1:N_YEARS, string.(START_YEAR:(START_YEAR + N_YEARS - 1))),
    yreversed         = true,
)

# Draw colored rectangles for each cell
cell_width  = 0.92
cell_height = 0.92

for yr in 1:N_YEARS
    for dev in 1:N_PERIODS
        v = cum_amounts[yr, dev]
        projected = is_projected[yr, dev]

        isnan(v) && continue

        # Determine fill color using approved Imprint colormaps
        if projected
            t = proj_max > proj_min ? (v - proj_min) / (proj_max - proj_min) : 0.5
            fill_color = ANYPLOT_DIV[t * 0.45]  # red half only — avoids near-BG midpoint
        else
            t = actual_max > actual_min ? (v - actual_min) / (actual_max - actual_min) : 0.5
            fill_color = ANYPLOT_SEQ[t]
        end

        poly!(ax,
            Point2f[(dev - cell_width / 2, yr - cell_height / 2),
                    (dev + cell_width / 2, yr - cell_height / 2),
                    (dev + cell_width / 2, yr + cell_height / 2),
                    (dev - cell_width / 2, yr + cell_height / 2)];
            color       = fill_color,
            strokecolor = PAGE_BG,
            strokewidth = 1.5,
        )

        # Cell annotation: value in $K with luminance-adaptive text color
        m = round(Int, v * 1000)
        label_str = m >= 1000 ? string(div(m, 1000), ",", lpad(string(mod(m, 1000)), 3, "0")) : string(m)
        lum = 0.299 * red(fill_color) + 0.587 * green(fill_color) + 0.114 * blue(fill_color)
        txt_color = lum > 0.45 ? colorant"#1A1A17" : colorant"#F0EFE8"

        text!(ax, dev, yr;
            text     = label_str,
            fontsize = 9,
            color    = txt_color,
            align    = (:center, :center),
        )
    end
end

# Diagonal separator line (observed vs projected boundary)
diag_x = Float64[]
diag_y = Float64[]
for yr in 1:(N_YEARS + 1)
    max_dev_for_yr = N_YEARS - yr + 2
    push!(diag_x, max_dev_for_yr + 0.5)
    push!(diag_y, yr - 0.5)
    if yr <= N_YEARS
        push!(diag_x, max_dev_for_yr + 0.5)
        push!(diag_y, yr + 0.5)
    end
end
lines!(ax, diag_x, diag_y; color = INK, linewidth = 2.5)

# Development factors row below the main grid
Label(fig[2, 1],
    "Age-to-Age Factors: " * join(dev_factor_labels, "  →  ");
    fontsize  = 11,
    color     = INK_SOFT,
    tellwidth = false,
    padding   = (0, 0, 4, 8),
)

# Legend: actual vs projected swatches
Legend(fig[3, 1],
    [PolyElement(color = ANYPLOT_SEQ[0.6], strokecolor = :transparent),
     PolyElement(color = ANYPLOT_DIV[0.2], strokecolor = :transparent)],
    ["Actual (observed)", "Projected (IBNR estimate)"];
    orientation     = :horizontal,
    framecolor      = ELEVATED_BG,
    framevisible    = true,
    backgroundcolor = ELEVATED_BG,
    labelcolor      = INK_SOFT,
    labelsize       = 12,
    patchsize       = (18, 14),
    tellwidth       = false,
    padding         = (8, 8, 6, 6),
)

# Set axis limits
xlims!(ax, 0.5, N_PERIODS + 0.5)
ylims!(ax, 0.5, N_YEARS + 0.5)

# Layout
rowsize!(fig.layout, 0, Auto(0.08))
rowsize!(fig.layout, 1, Auto(1.0))
rowsize!(fig.layout, 2, Auto(0.07))
rowsize!(fig.layout, 3, Auto(0.07))

save("plot-$(THEME).png", fig; px_per_unit = 2)
Runnable source as JSON, for any HTTP client: https://api.anyplot.ai/specs/heatmap-loss-triangle/makie/code. Any spec id and library id listed in llms-full.txt fit the same URL shape; every URL below is complete and callable.
{
  "spec_id": "heatmap-loss-triangle",
  "language": "julia",
  "library": "makie",
  "page": "https://anyplot.ai/heatmap-loss-triangle/julia/makie",
  "hub": "https://anyplot.ai/heatmap-loss-triangle",
  "code_json": "https://api.anyplot.ai/specs/heatmap-loss-triangle/makie/code",
  "spec_json": "https://api.anyplot.ai/specs/heatmap-loss-triangle",
  "render_light_png": "https://storage.googleapis.com/anyplot-images/plots/heatmap-loss-triangle/julia/makie/plot-light.png",
  "render_dark_png": "https://storage.googleapis.com/anyplot-images/plots/heatmap-loss-triangle/julia/makie/plot-dark.png",
  "quality_score": 90.0,
  "license": "MIT",
  "guide": "https://anyplot.ai/llms.txt"
}
Part of Actuarial Loss Development Triangle on anyplot.ai.