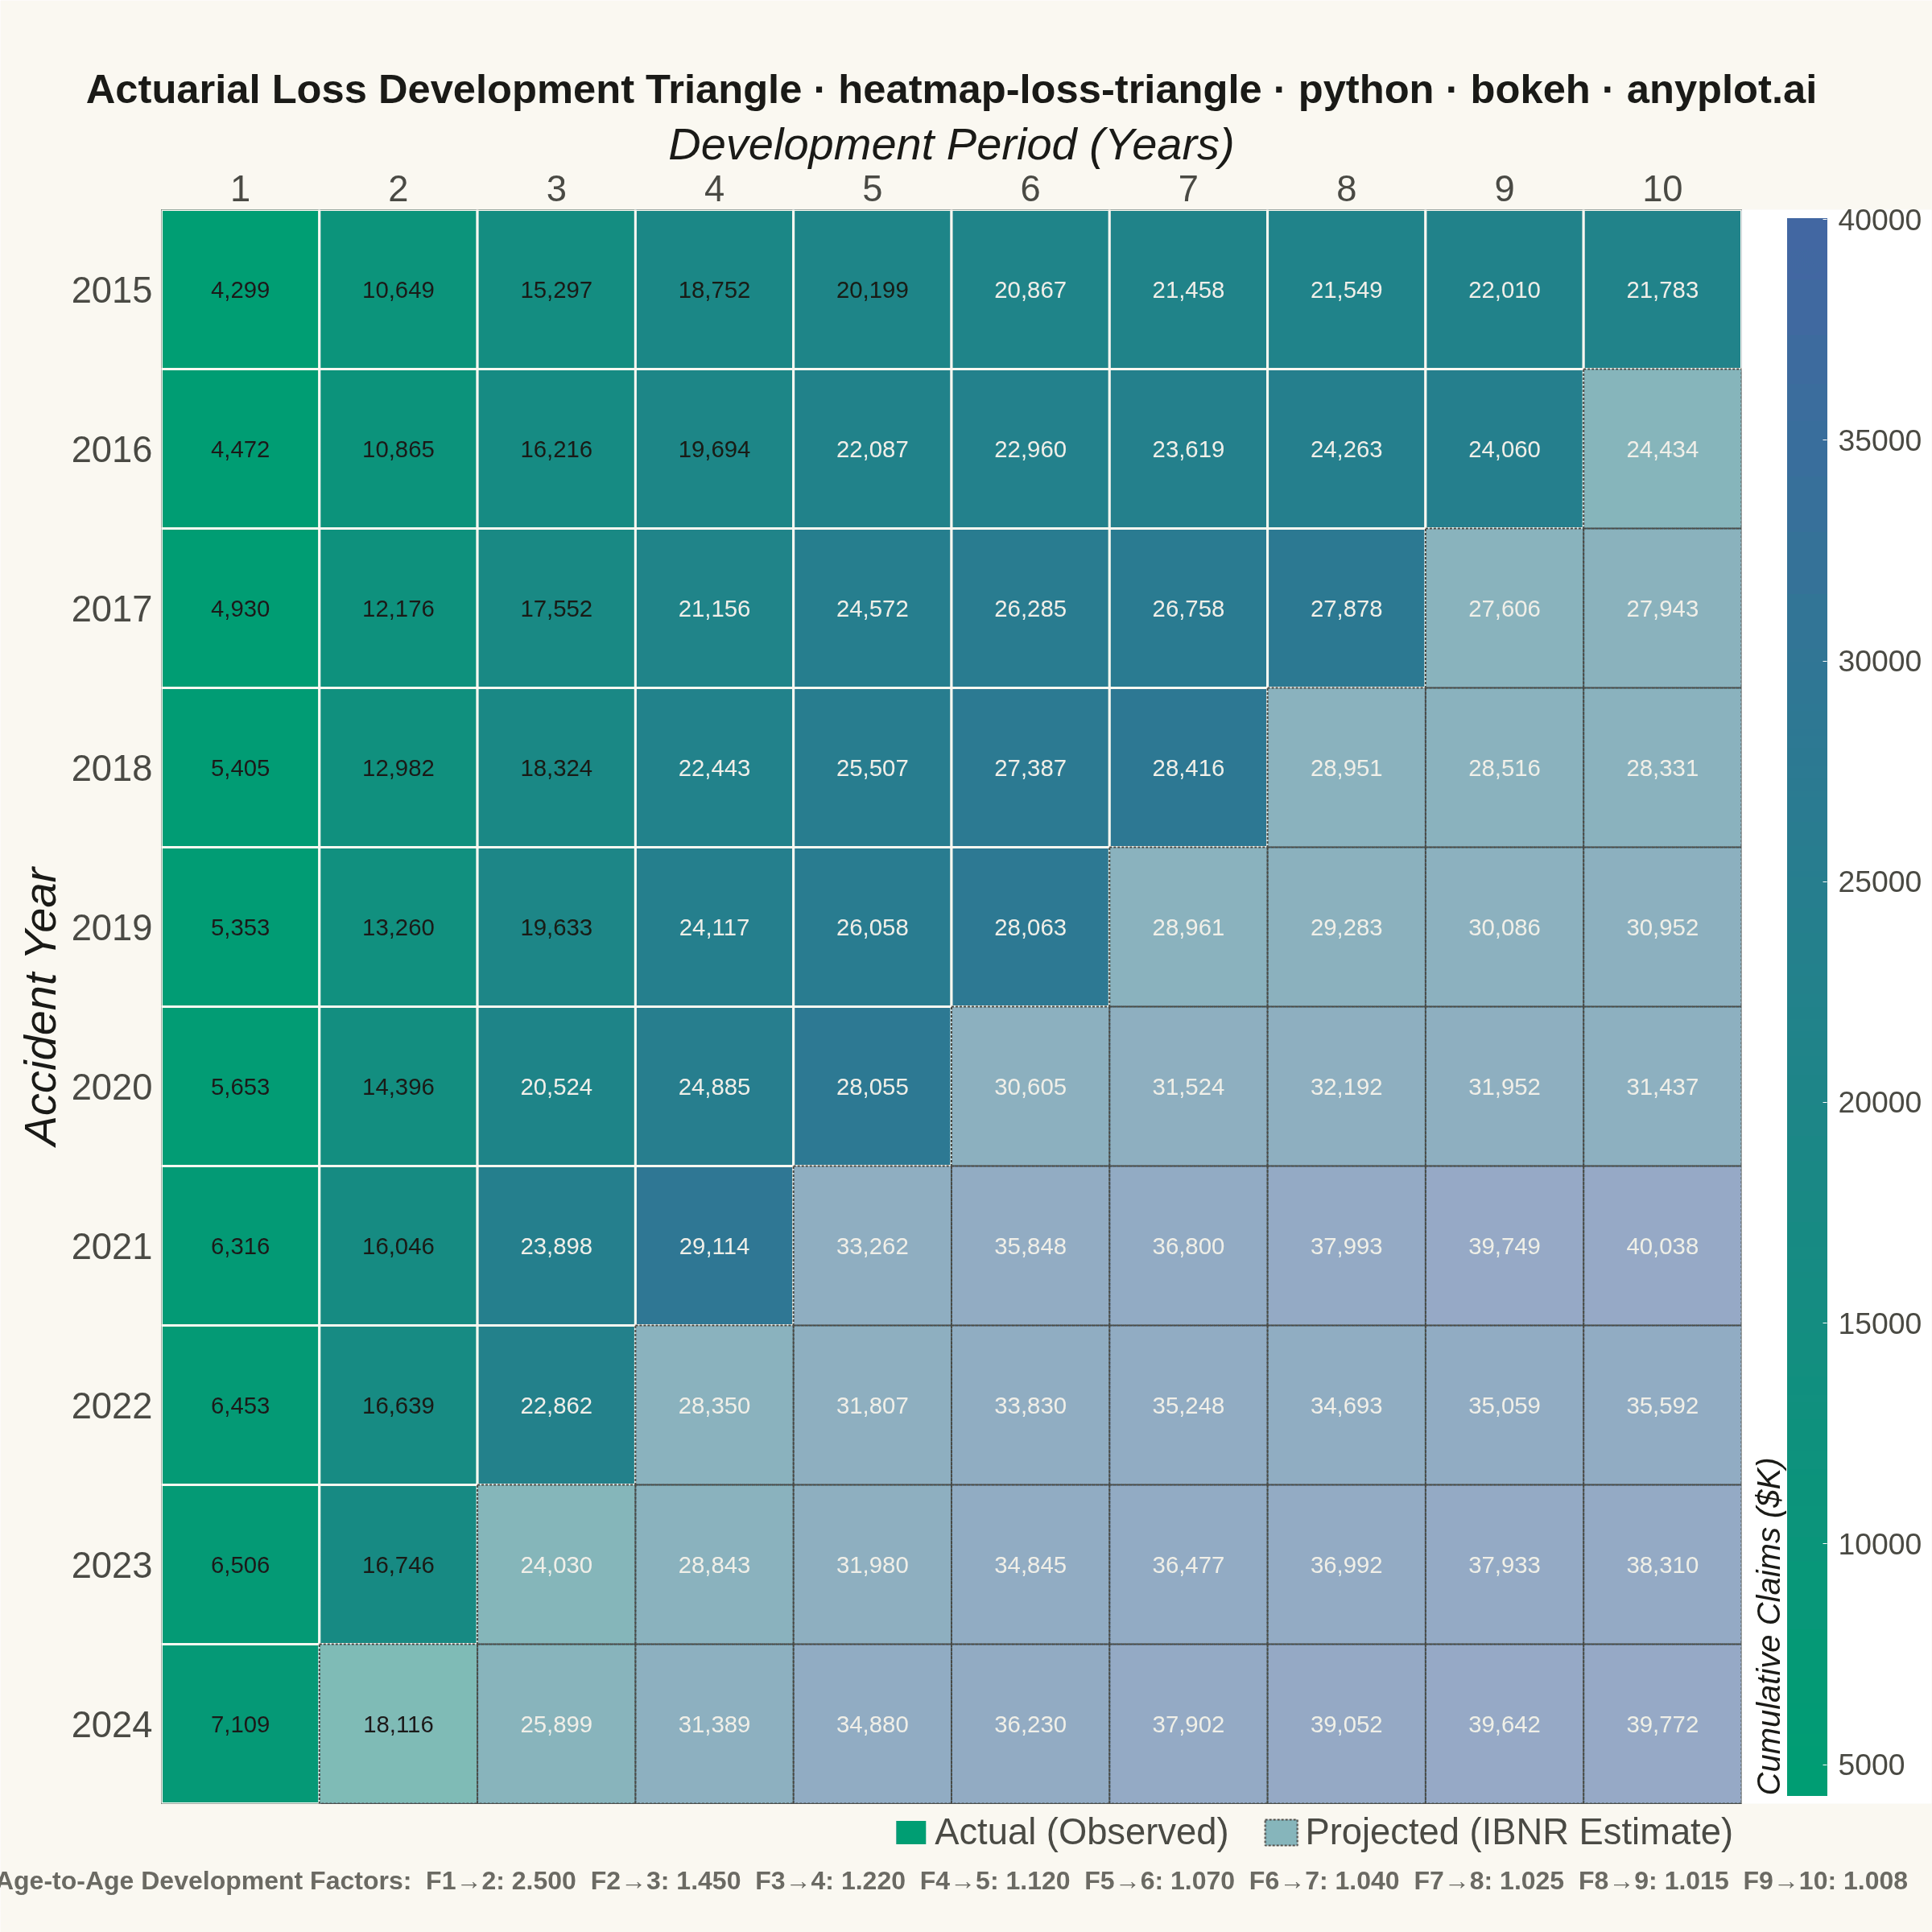
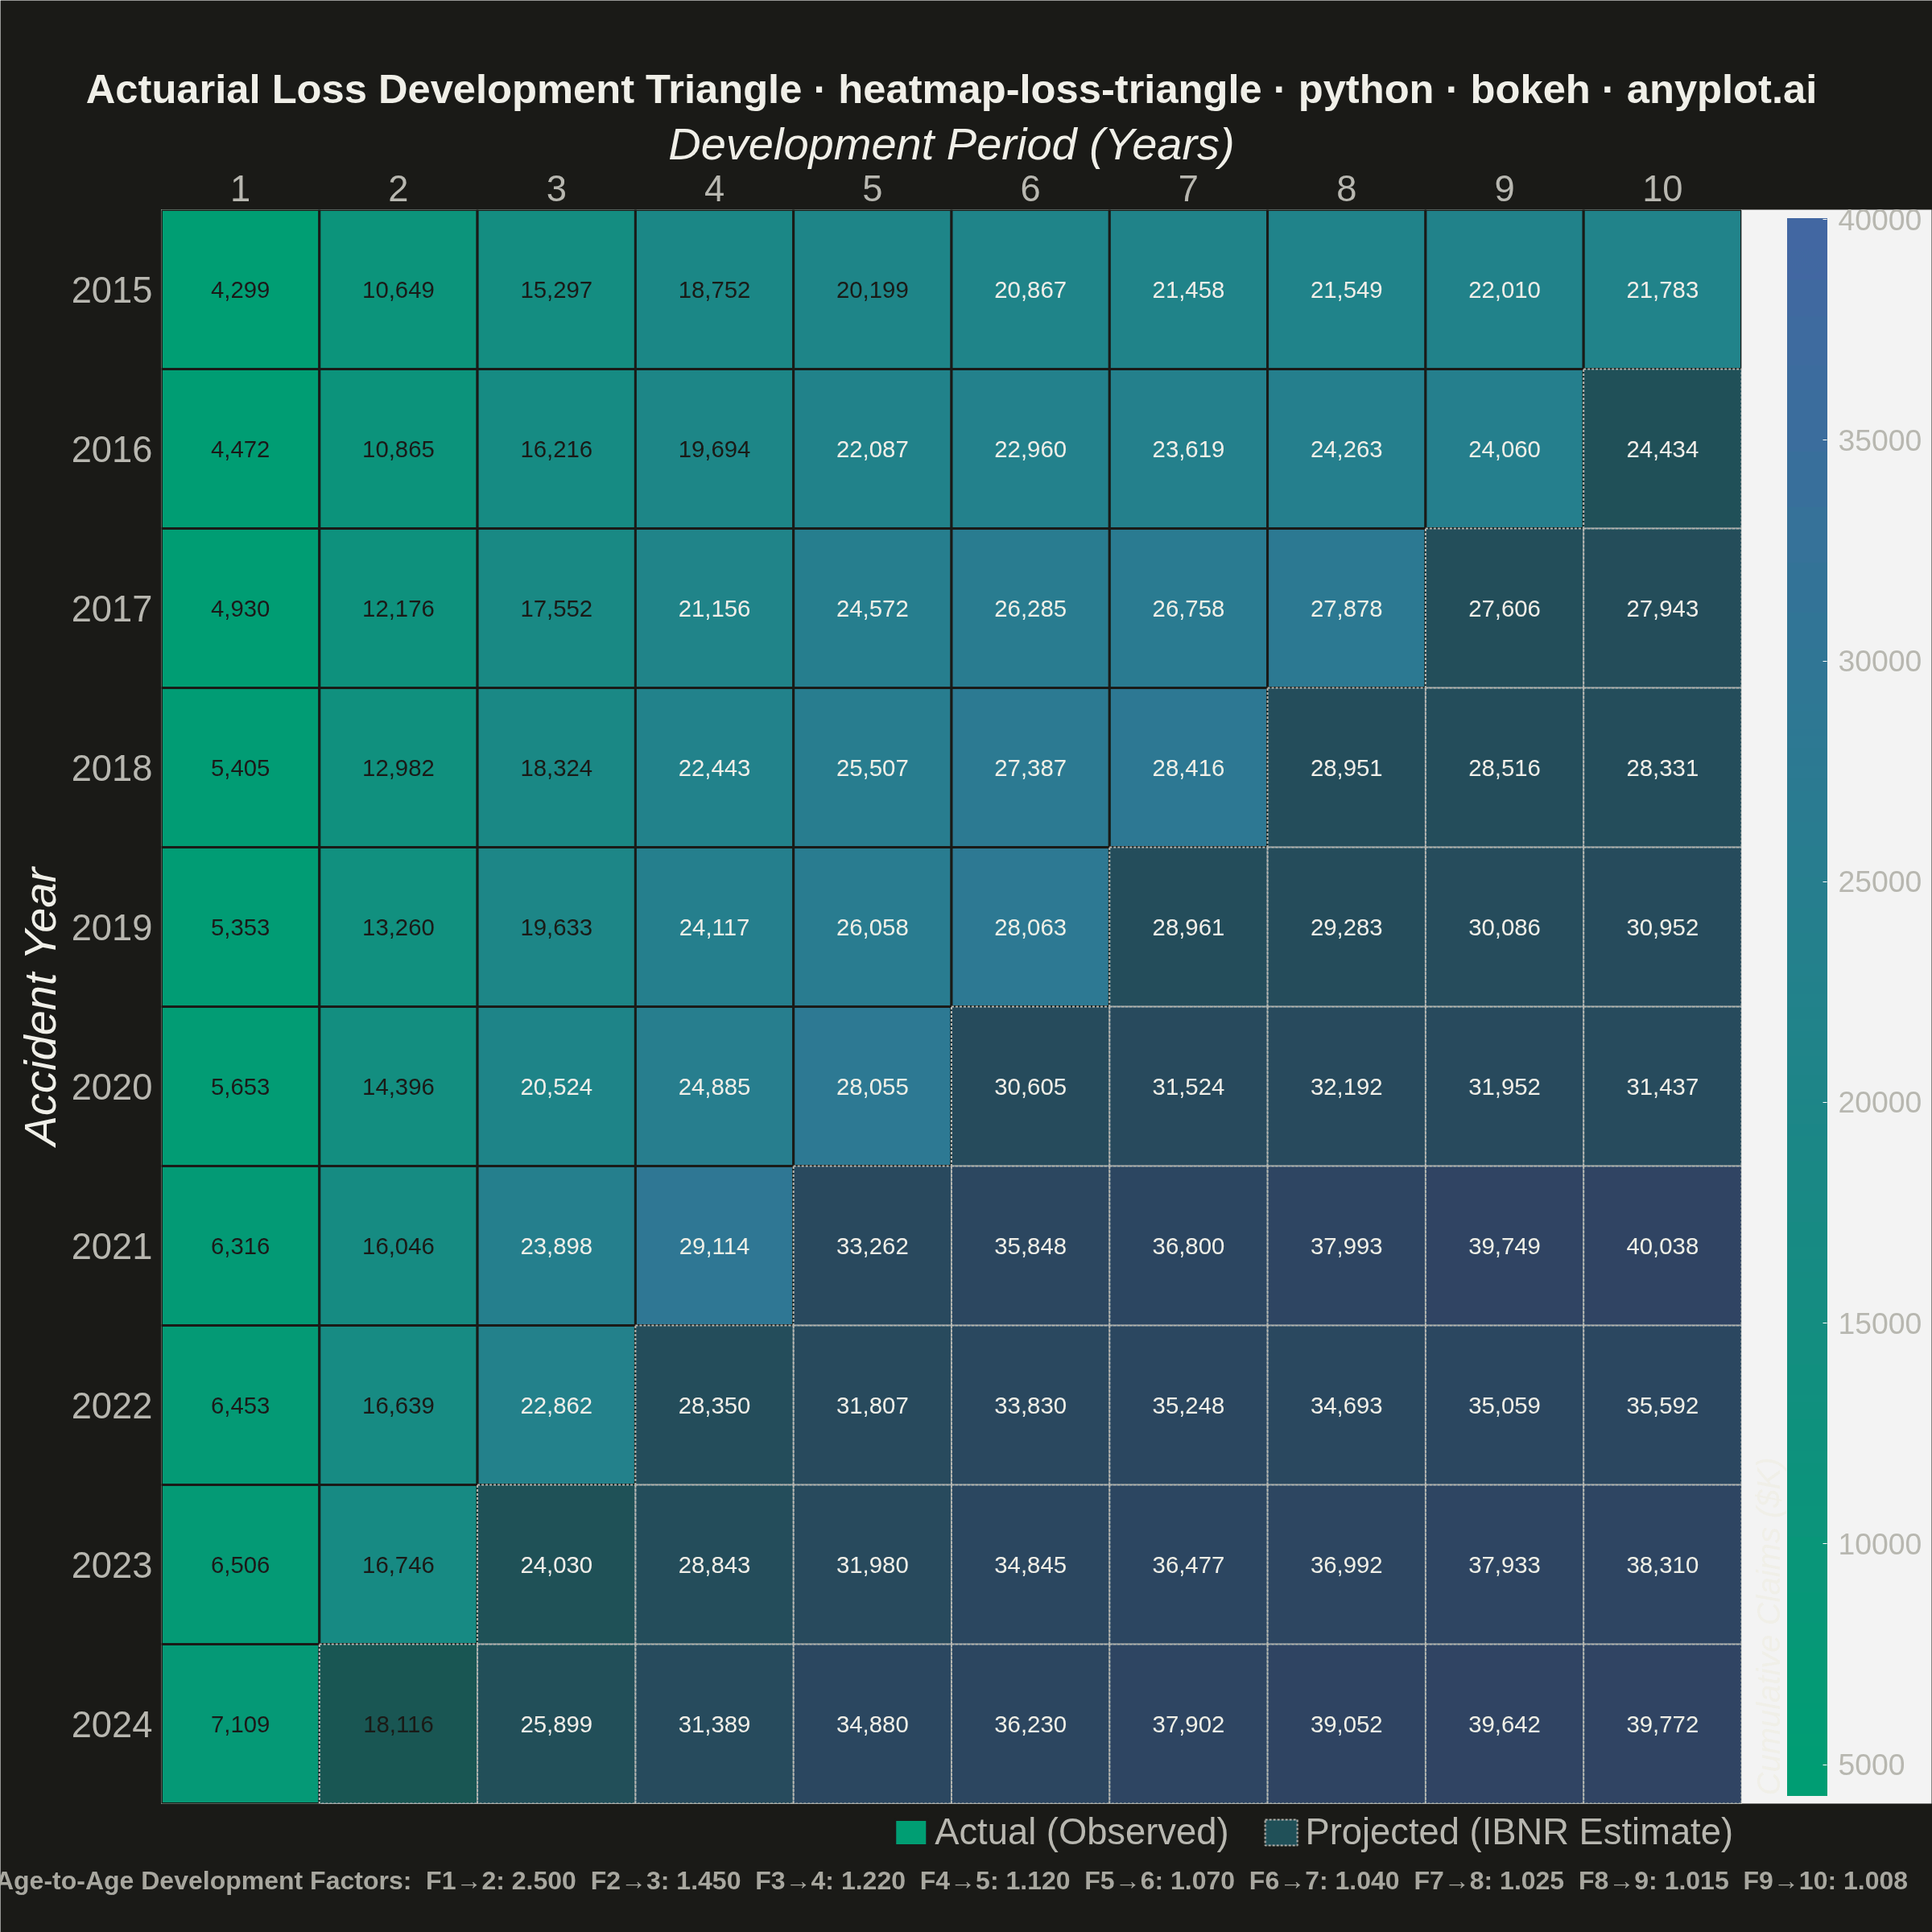
A triangular matrix visualization showing cumulative insurance claim payments developing over time. Rows represent accident/origin years, columns represent development periods (e.g., 1-10 years), with the upper-left triangle displaying actual observed cumulative claims and the lower-right triangle showing projected/estimated values (IBNR). This plot is essential for actuarial reserving, enabling analysts to visualize the chain-ladder method and identify development patterns in loss data.
""" anyplot.ai
heatmap-loss-triangle: Actuarial Loss Development Triangle
Library: bokeh 3.9.0 | Python 3.13.13
Quality: 93/100 | Updated: 2026-06-03
"""

# Remove this script's directory from sys.path so 'import bokeh' finds the installed package,
# not this file (bokeh.py shadows the bokeh package when run from its own directory).
import os as _os
import sys as _sys


_here = _os.path.dirname(_os.path.abspath(__file__))
_sys.path = [p for p in _sys.path if _os.path.abspath(p) != _here]

import os
import time
from pathlib import Path

import numpy as np
from bokeh.io import output_file, save
from bokeh.models import (
    BasicTicker,
    ColorBar,
    ColumnDataSource,
    HoverTool,
    Legend,
    LegendItem,
    LinearColorMapper,
    Title,
)
from bokeh.plotting import figure
from bokeh.transform import transform
from selenium import webdriver
from selenium.webdriver.chrome.options import Options


# Theme tokens
THEME = os.getenv("ANYPLOT_THEME", "light")
PAGE_BG = "#FAF8F1" if THEME == "light" else "#1A1A17"
ELEVATED_BG = "#FFFDF6" if THEME == "light" else "#242420"
INK = "#1A1A17" if THEME == "light" else "#F0EFE8"
INK_SOFT = "#4A4A44" if THEME == "light" else "#B8B7B0"
INK_MUTED = "#6B6A63" if THEME == "light" else "#A8A79F"

# Imprint sequential colormap: brand green (#009E73) → blue (#4467A3)
_seq_r = np.linspace(0, 68, 256).astype(int)
_seq_g = np.linspace(158, 103, 256).astype(int)
_seq_b = np.linspace(115, 163, 256).astype(int)
IMPRINT_SEQ = [f"#{r:02X}{g:02X}{b:02X}" for r, g, b in zip(_seq_r, _seq_g, _seq_b, strict=True)]

# Data: cumulative paid claims triangle (10 accident years × 10 development periods)
np.random.seed(42)

accident_years = list(range(2015, 2025))
dev_periods = list(range(1, 11))

initial_claims = np.array([4200, 4500, 4800, 5100, 5400, 5700, 6000, 6300, 6600, 7000], dtype=float)
initial_claims += np.random.normal(0, 200, 10)
dev_factors = np.array([2.50, 1.45, 1.22, 1.12, 1.07, 1.04, 1.025, 1.015, 1.008])

full_triangle = np.zeros((10, 10))
for i in range(10):
    full_triangle[i, 0] = initial_claims[i]
    for j in range(1, 10):
        full_triangle[i, j] = full_triangle[i, j - 1] * dev_factors[j - 1] * np.random.normal(1.0, 0.02)

# Actual: upper-left triangle where row + col < 10; remainder is projected (IBNR)
is_actual = np.array([[i + j < 10 for j in range(10)] for i in range(10)])

min_val = full_triangle.min()
max_val = full_triangle.max()

actual_x, actual_y, actual_val = [], [], []
proj_x, proj_y, proj_val = [], [], []
all_x, all_y, all_text, all_tc, all_status, all_val_list = [], [], [], [], [], []

for i in range(10):
    for j in range(10):
        x = str(dev_periods[j])
        y = str(accident_years[i])
        val = full_triangle[i, j]
        norm = (val - min_val) / (max_val - min_val)
        # Text must contrast against cell fill (Imprint seq: green→blue), not the page bg
        tc = "#F0EFE8" if norm > 0.45 else "#1A1A17"
        all_x.append(x)
        all_y.append(y)
        all_text.append(f"{val:,.0f}")
        all_tc.append(tc)
        all_status.append("Actual" if is_actual[i, j] else "Projected (IBNR)")
        all_val_list.append(val)
        if is_actual[i, j]:
            actual_x.append(x)
            actual_y.append(y)
            actual_val.append(val)
        else:
            proj_x.append(x)
            proj_y.append(y)
            proj_val.append(val)

source_actual = ColumnDataSource(data={"x": actual_x, "y": actual_y, "value": actual_val})
source_proj = ColumnDataSource(data={"x": proj_x, "y": proj_y, "value": proj_val})
source_text = ColumnDataSource(
    data={"x": all_x, "y": all_y, "text": all_text, "text_color": all_tc, "status": all_status, "value": all_val_list}
)

mapper = LinearColorMapper(palette=IMPRINT_SEQ, low=min_val, high=max_val)

# Title length-adjusted font size (floor 34pt per bokeh library rules)
title_str = "Actuarial Loss Development Triangle · heatmap-loss-triangle · python · bokeh · anyplot.ai"
_n = len(title_str)
title_pt = max(34, round(50 * 67 / _n)) if _n > 67 else 50

dev_labels = [str(d) for d in dev_periods]
year_labels = [str(y) for y in accident_years]

# Plot — square canvas (2400×2400) for symmetric grid; x-axis at top per actuarial convention
p = figure(
    width=2400,
    height=2400,
    x_range=dev_labels,
    y_range=list(reversed(year_labels)),
    title=title_str,
    x_axis_location="above",
    toolbar_location=None,
    min_border_bottom=160,
    min_border_left=200,
    min_border_top=260,
    min_border_right=130,
)

# Actual cells: solid fill, page-bg border for clean separation
r_actual = p.rect(
    x="x",
    y="y",
    width=1,
    height=1,
    source=source_actual,
    fill_color=transform("value", mapper),
    fill_alpha=1.0,
    line_color=PAGE_BG,
    line_width=3,
)

# Projected cells: reduced opacity + dashed border to flag IBNR estimates
r_proj = p.rect(
    x="x",
    y="y",
    width=1,
    height=1,
    source=source_proj,
    fill_color=transform("value", mapper),
    fill_alpha=0.55,
    line_color=INK_SOFT,
    line_width=2,
    line_dash="dashed",
)

# Cell annotations — 22pt for readability across 100 cells at full resolution
p.text(
    x="x",
    y="y",
    text="text",
    source=source_text,
    text_align="center",
    text_baseline="middle",
    text_font_size="22pt",
    text_color="text_color",
)

hover = HoverTool(
    renderers=[r_actual, r_proj],
    tooltips=[("Accident Year", "@y"), ("Dev Period", "@x"), ("Status", "@status"), ("Cumulative", "$@value{0,0}")],
)
p.add_tools(hover)

# Theme-adaptive chrome
p.title.text_font_size = f"{title_pt}pt"
p.title.text_color = INK
p.title.align = "center"
p.background_fill_color = PAGE_BG
p.border_fill_color = PAGE_BG
p.outline_line_color = INK_SOFT

p.xaxis.axis_label = "Development Period (Years)"
p.yaxis.axis_label = "Accident Year"
p.xaxis.axis_label_text_font_size = "42pt"
p.yaxis.axis_label_text_font_size = "42pt"
p.xaxis.axis_label_text_color = INK
p.yaxis.axis_label_text_color = INK
p.xaxis.major_label_text_font_size = "34pt"
p.yaxis.major_label_text_font_size = "34pt"
p.xaxis.major_label_text_color = INK_SOFT
p.yaxis.major_label_text_color = INK_SOFT
p.axis.axis_line_color = None
p.axis.major_tick_line_color = None
p.grid.grid_line_color = None

# Legend (below figure, horizontal)
legend = Legend(
    items=[
        LegendItem(label="Actual (Observed)", renderers=[r_actual]),
        LegendItem(label="Projected (IBNR Estimate)", renderers=[r_proj]),
    ],
    orientation="horizontal",
    label_text_font_size="34pt",
    label_text_color=INK_SOFT,
    glyph_width=50,
    glyph_height=40,
    border_line_color=None,
    background_fill_color=ELEVATED_BG,
    background_fill_alpha=0.0,
    spacing=40,
)
p.add_layout(legend, "below")

# Development factors subtitle
_factor_str = "  ".join([f"F{j + 1}→{j + 2}: {dev_factors[j]:.3f}" for j in range(9)])
p.add_layout(
    Title(
        text=f"Age-to-Age Development Factors:  {_factor_str}",
        text_font_size="24pt",
        text_color=INK_MUTED,
        align="center",
    ),
    "below",
)

# Color bar (Imprint seq scale)
color_bar = ColorBar(
    color_mapper=mapper,
    ticker=BasicTicker(desired_num_ticks=8),
    label_standoff=14,
    major_label_text_font_size="28pt",
    major_label_text_color=INK_SOFT,
    title="Cumulative Claims ($K)",
    title_text_font_size="30pt",
    title_text_color=INK,
    width=50,
    location=(0, 0),
)
p.add_layout(color_bar, "right")

# Save interactive HTML — use absolute path so the file lands in the script's directory
_impl_dir = Path(_os.path.dirname(_os.path.abspath(__file__)))
_html_path = _impl_dir / f"plot-{THEME}.html"
_png_path = _impl_dir / f"plot-{THEME}.png"

output_file(str(_html_path))
save(p)

# Screenshot with headless Chrome — force exact viewport via CDP to avoid
# set_window_size() overhead (outer vs inner window discrepancy in headless)
W, H = 2400, 2400
opts = Options()
for arg in (
    "--headless=new",
    "--no-sandbox",
    "--disable-dev-shm-usage",
    "--disable-gpu",
    f"--window-size={W},{H}",
    "--hide-scrollbars",
):
    opts.add_argument(arg)
driver = webdriver.Chrome(options=opts)
driver.execute_cdp_cmd(
    "Emulation.setDeviceMetricsOverride", {"width": W, "height": H, "deviceScaleFactor": 1, "mobile": False}
)
driver.get(f"file://{_html_path.resolve()}")
time.sleep(3)
driver.save_screenshot(str(_png_path))
driver.quit()
Runnable source as JSON, for any HTTP client: https://api.anyplot.ai/specs/heatmap-loss-triangle/bokeh/code. Any spec id and library id listed in llms-full.txt fit the same URL shape; every URL below is complete and callable.
{
  "spec_id": "heatmap-loss-triangle",
  "language": "python",
  "library": "bokeh",
  "page": "https://anyplot.ai/heatmap-loss-triangle/python/bokeh",
  "hub": "https://anyplot.ai/heatmap-loss-triangle",
  "code_json": "https://api.anyplot.ai/specs/heatmap-loss-triangle/bokeh/code",
  "spec_json": "https://api.anyplot.ai/specs/heatmap-loss-triangle",
  "render_light_png": "https://storage.googleapis.com/anyplot-images/plots/heatmap-loss-triangle/python/bokeh/plot-light.png",
  "render_dark_png": "https://storage.googleapis.com/anyplot-images/plots/heatmap-loss-triangle/python/bokeh/plot-dark.png",
  "interactive_light_html": "https://storage.googleapis.com/anyplot-images/plots/heatmap-loss-triangle/python/bokeh/plot-light.html",
  "interactive_dark_html": "https://storage.googleapis.com/anyplot-images/plots/heatmap-loss-triangle/python/bokeh/plot-dark.html",
  "quality_score": 93.0,
  "license": "MIT",
  "guide": "https://anyplot.ai/llms.txt"
}
Part of Actuarial Loss Development Triangle on anyplot.ai.