The same plot in 14 other libraries — JavaScript: D3.js, Apache ECharts, Highcharts, MUI X Charts; Python: Altair, Bokeh, lets-plot, Matplotlib, Plotly, plotnine, Pygal, Seaborn; R: ggplot2; Julia: Makie.jl. Compare all 15 side by side: Mandelbrot Set Fractal Visualization in Python, R, Julia and JavaScript.
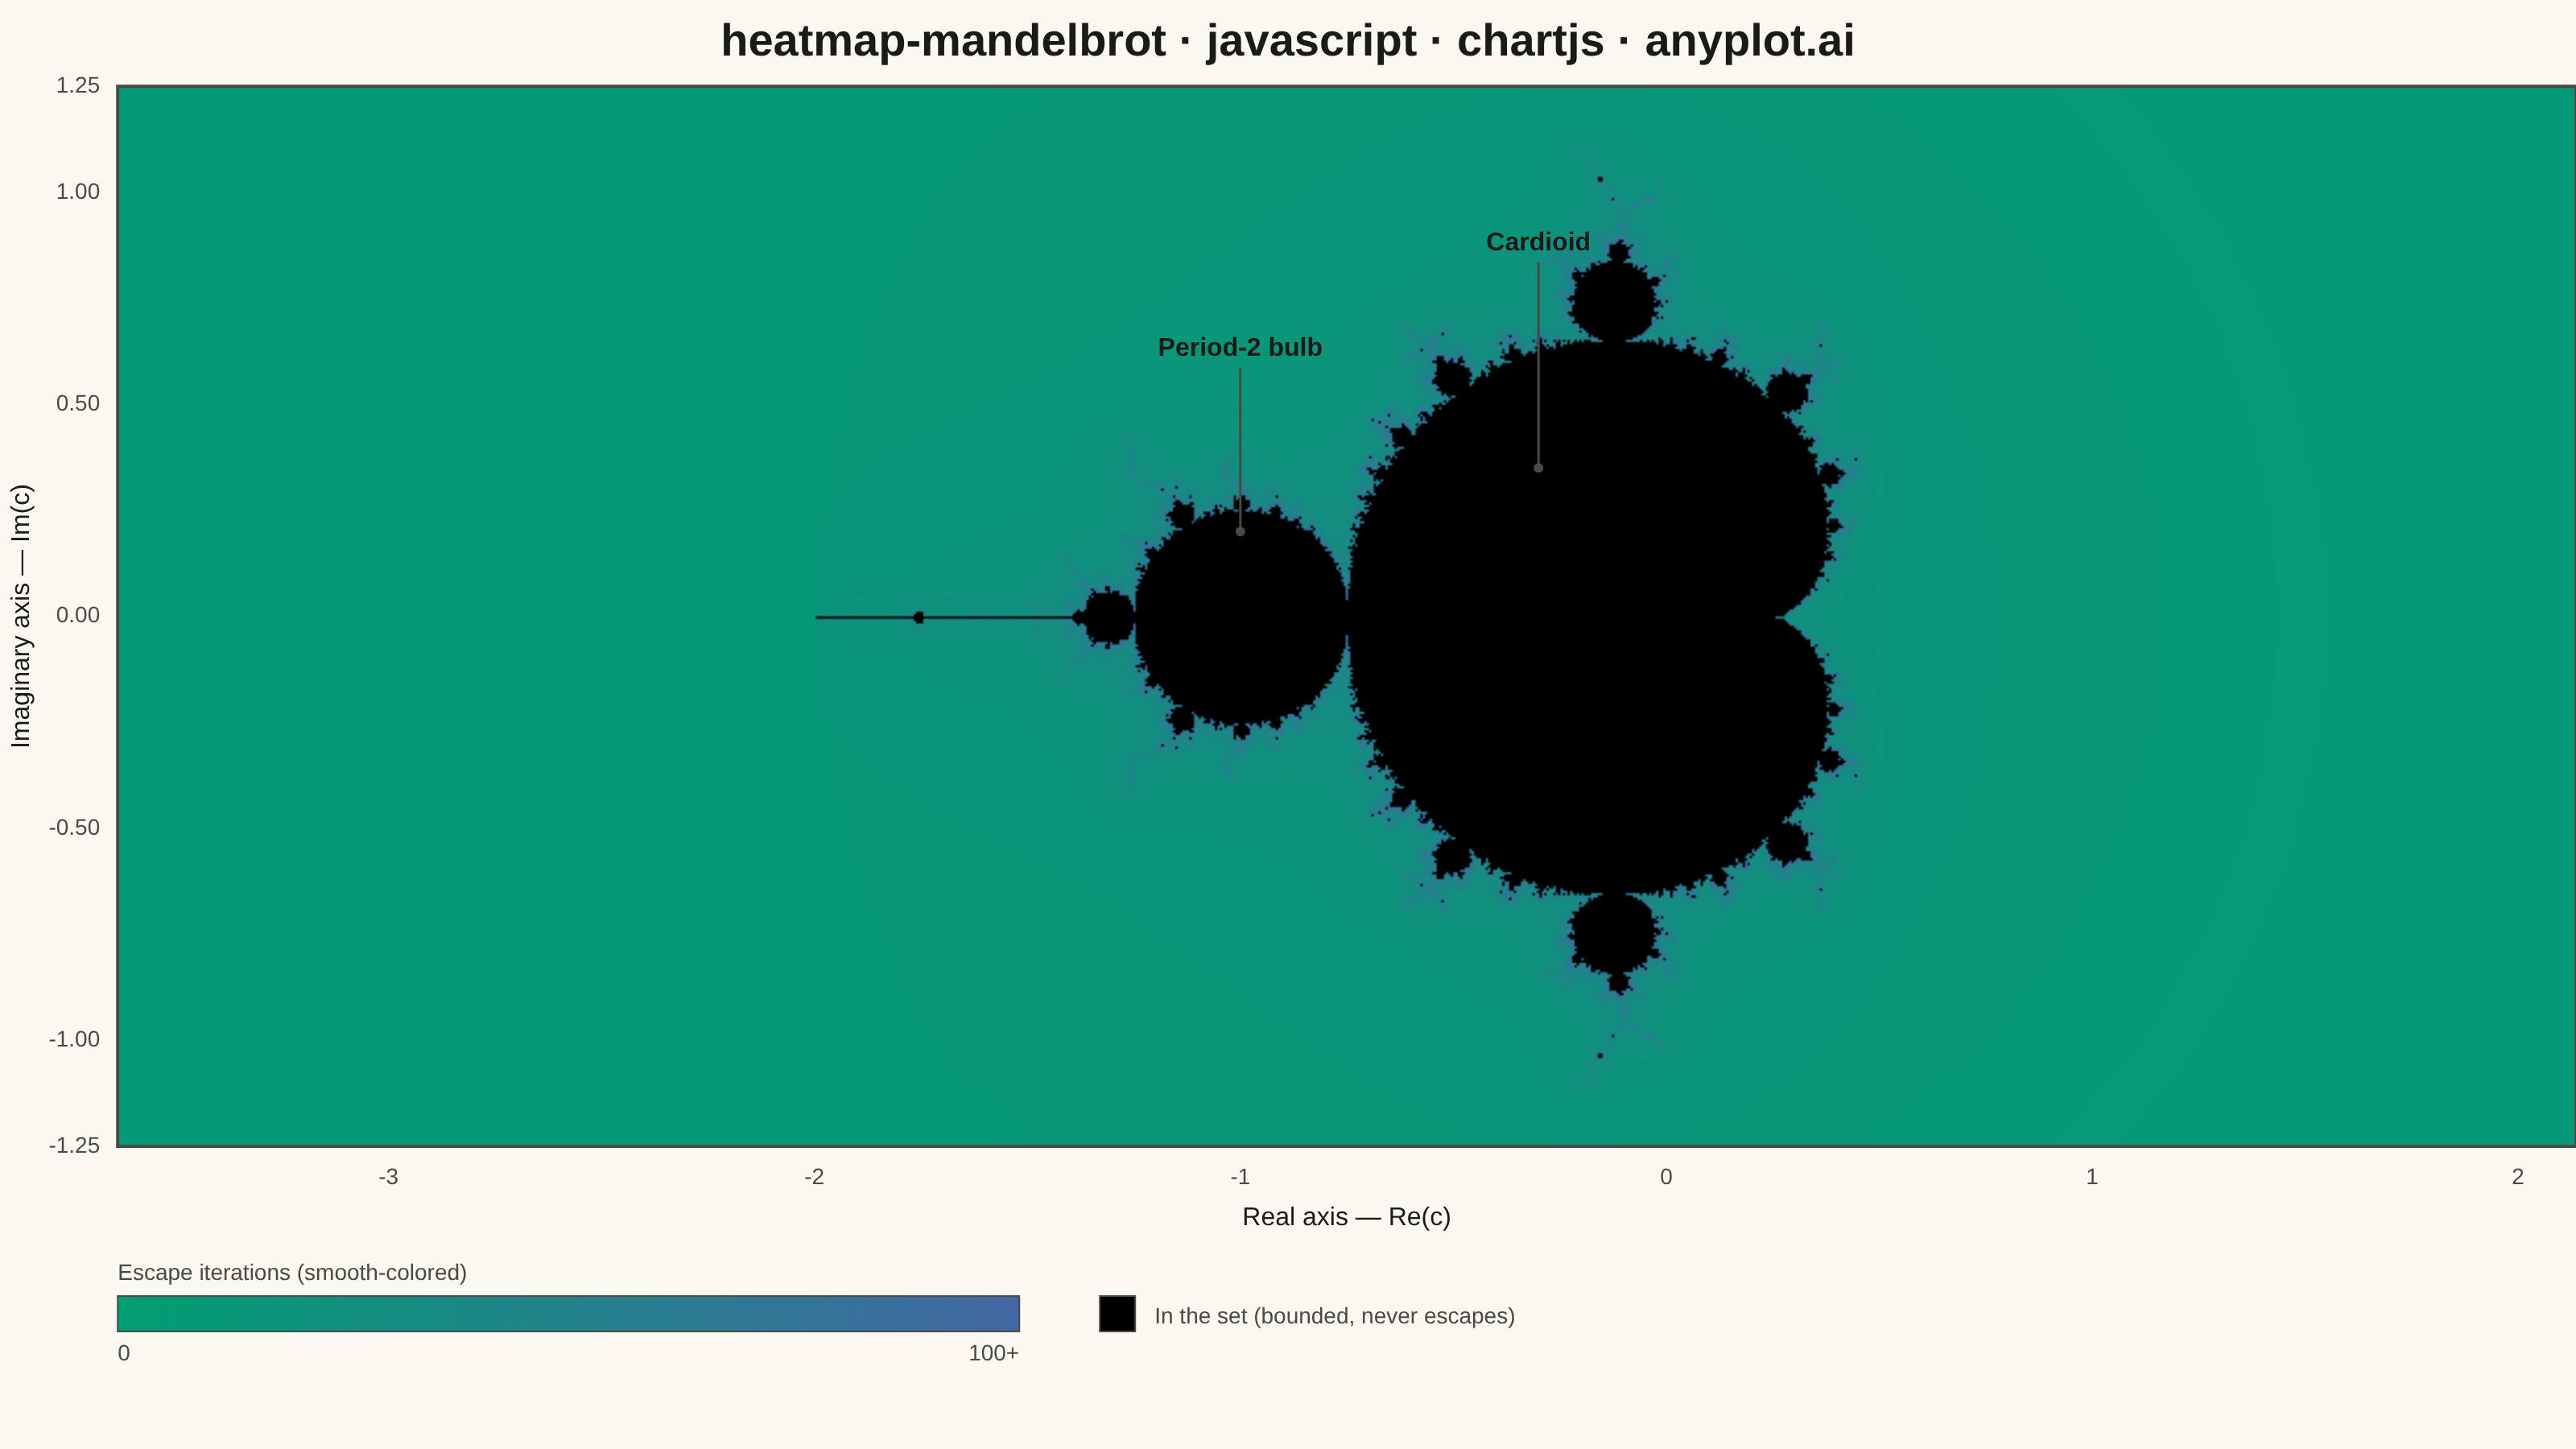
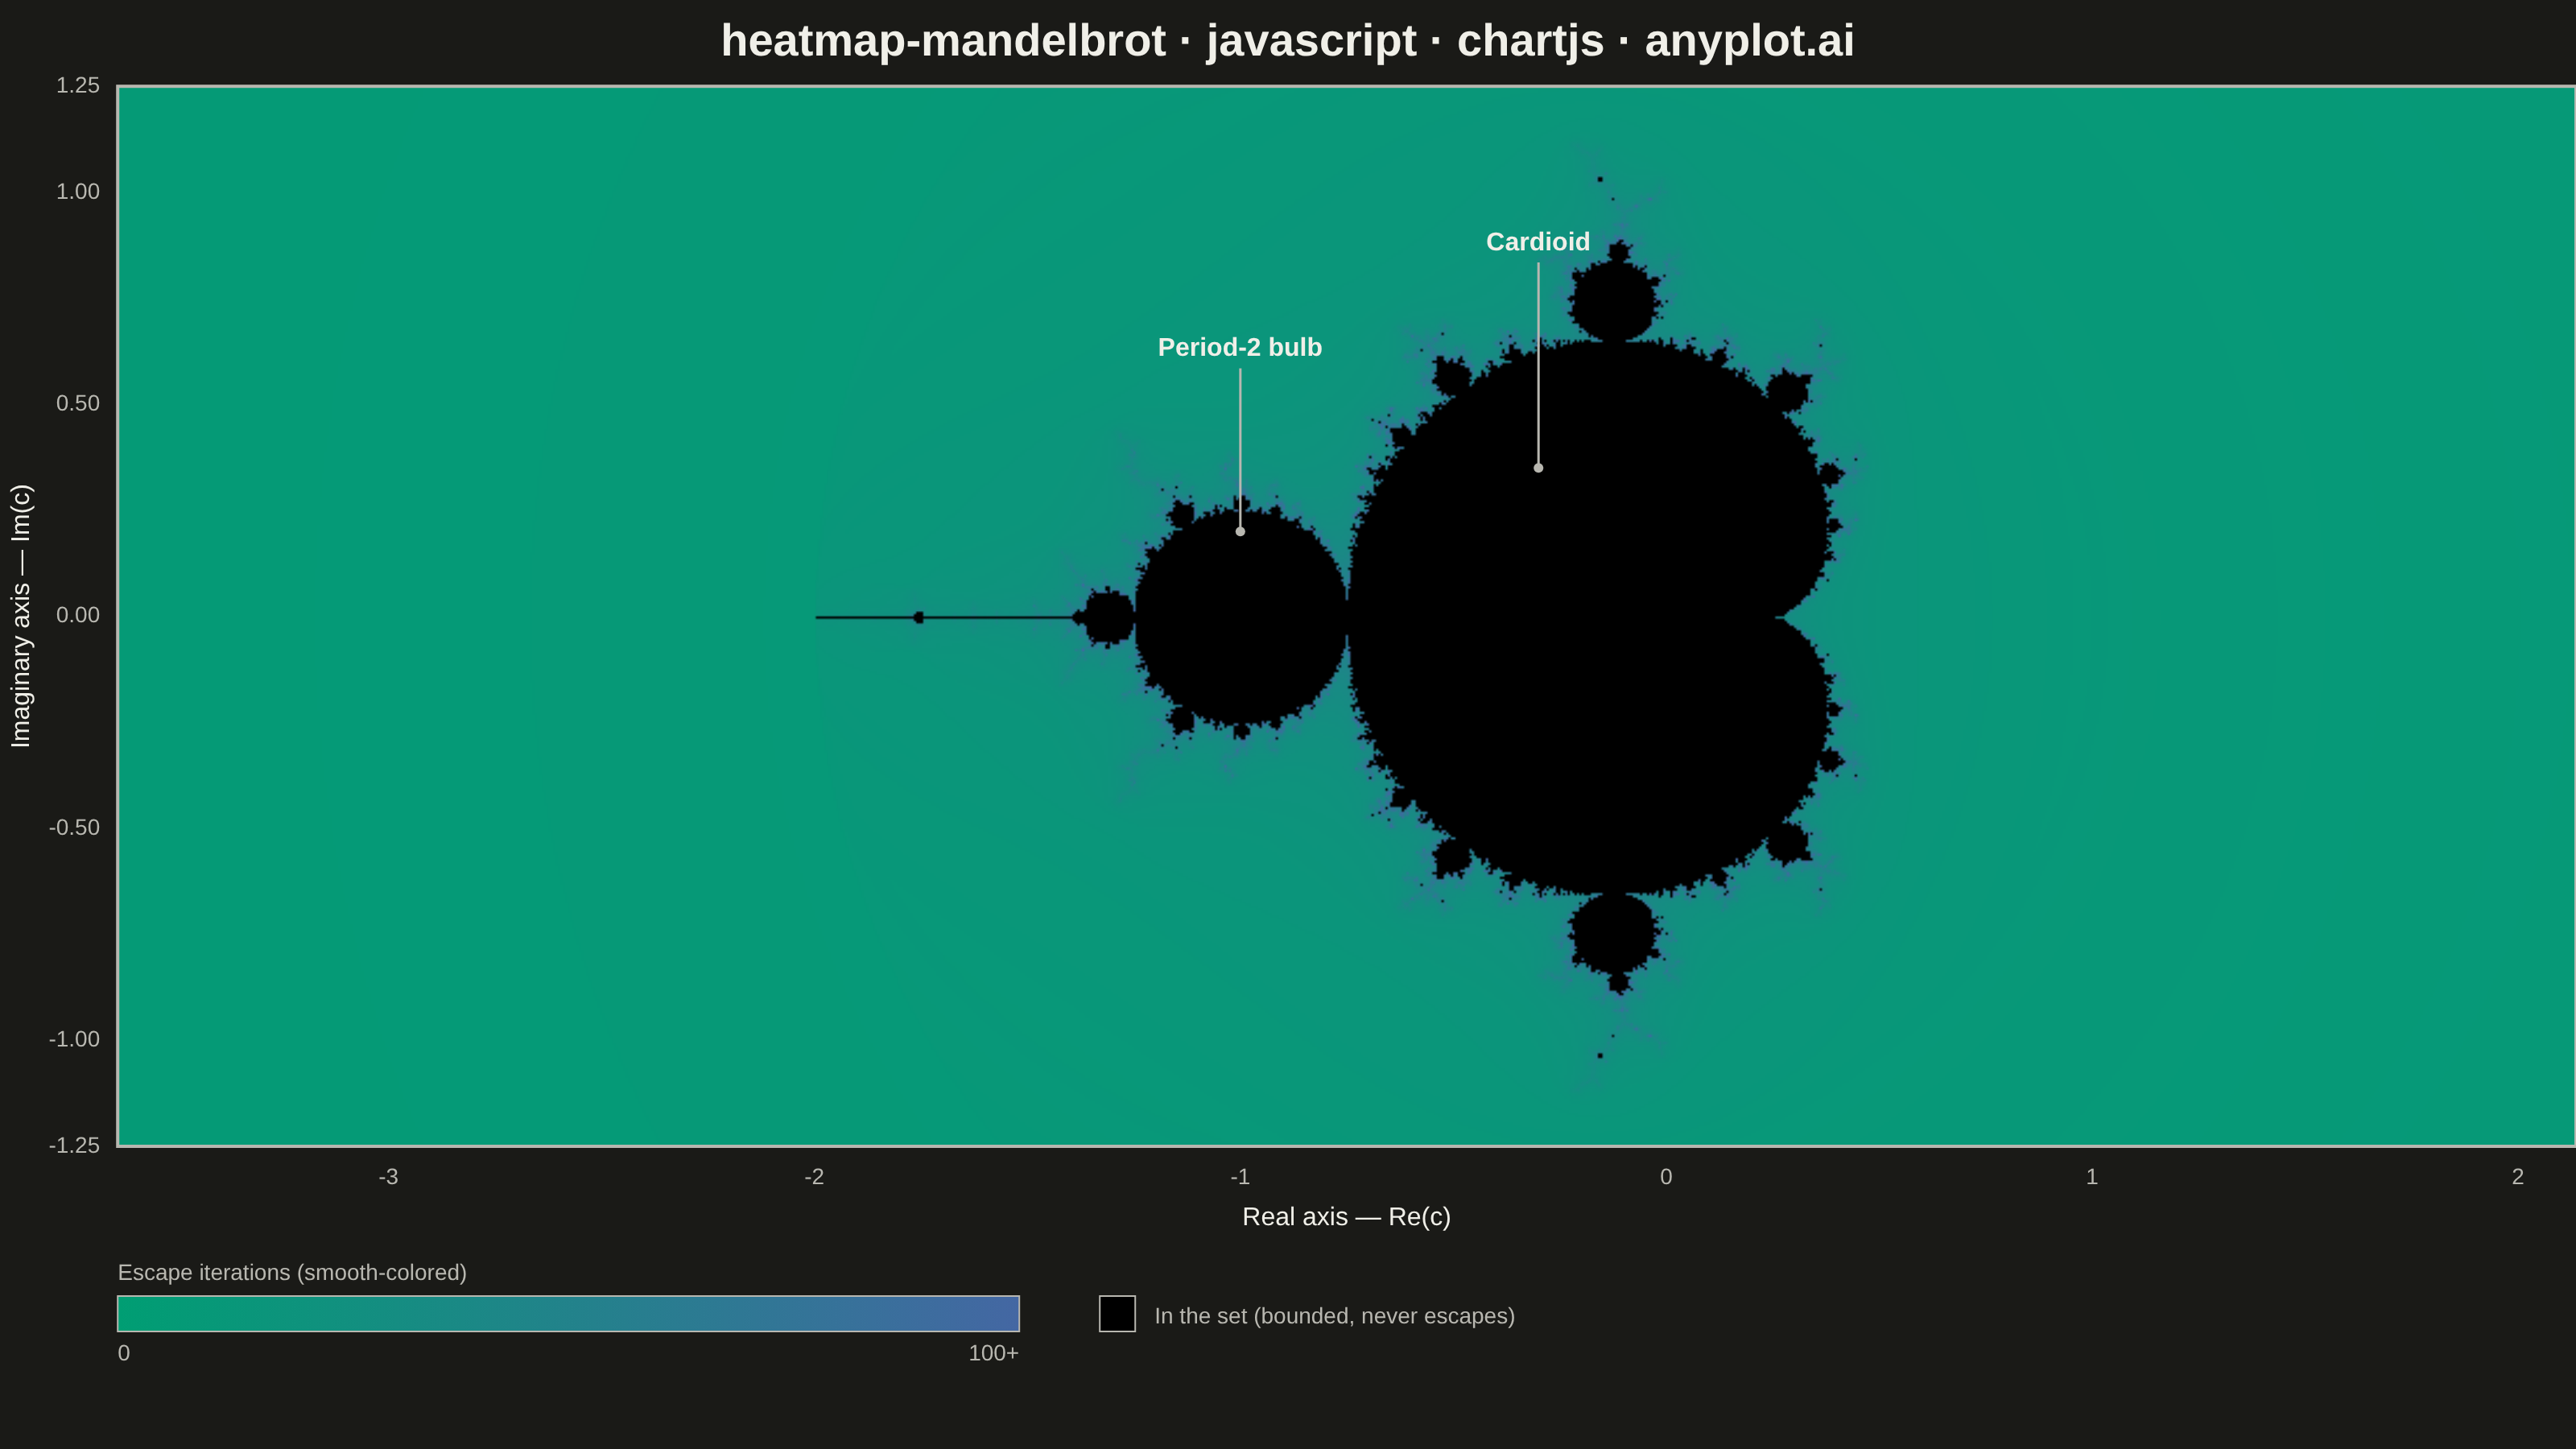
A visualization of the Mandelbrot set, the most iconic fractal in mathematics. Each pixel represents a complex number c on the complex plane, colored by how quickly the iteration z(n+1) = z(n)^2 + c diverges. The boundary between convergent and divergent regions reveals infinitely complex, self-similar structure including the characteristic cardioid and period-2 bulb.
// anyplot.ai
// heatmap-mandelbrot: Mandelbrot Set Fractal Visualization
// Library: chartjs 4.4.7 | JavaScript 22.23.2
// Quality: 90/100 | Created: 2026-08-25
//# anyplot-orientation: landscape

// Chart.js has no native heatmap/matrix chart type (chartjs-chart-matrix is an
// unpinned community plugin, out of scope). Instead this draws the fractal as a
// raster image positioned via Chart.js's own (native, not a plugin package)
// `plugins` draw-hook API onto a real linear x/y coordinate system, so the axes
// still report true complex-plane coordinates.

const t = window.ANYPLOT_TOKENS;

// --- Mandelbrot parameters ---------------------------------------------------
const X_MIN = -2.5;
const X_MAX = 1.0;
const Y_MIN = -1.25;
const Y_MAX = 1.25;
const MAX_ITER = 100;
const PIXEL_BUDGET = 480000; // grid resolution budget, spent proportional to aspect

function hexToRgb(hex) {
  const v = parseInt(hex.slice(1), 16);
  return { r: (v >> 16) & 255, g: (v >> 8) & 255, b: v & 255 };
}

// Precompute a 256-step lookup table between the two imprint_seq stops so the
// hot per-pixel loop below never parses hex strings.
function buildPalette(seqColors) {
  const c0 = hexToRgb(seqColors[0]);
  const c1 = hexToRgb(seqColors[1]);
  const steps = 256;
  const pal = new Uint8ClampedArray(steps * 3);
  for (let i = 0; i < steps; i++) {
    const f = i / (steps - 1);
    pal[i * 3] = c0.r + (c1.r - c0.r) * f;
    pal[i * 3 + 1] = c0.g + (c1.g - c0.g) * f;
    pal[i * 3 + 2] = c0.b + (c1.b - c0.b) * f;
  }
  return pal;
}

const PALETTE = buildPalette(t.seq);

// Draws a short leader line from a labeled point down to a target point inside
// a fractal structure, plus a small dot marking the target — a lightweight
// callout so the teaching-tool framing names the cardioid and period-2 bulb.
function drawCallout(ctx, scaleX, scaleY, labelCx, labelCy, targetCx, targetCy, text) {
  const labelPx = { x: scaleX.getPixelForValue(labelCx), y: scaleY.getPixelForValue(labelCy) };
  const targetPx = { x: scaleX.getPixelForValue(targetCx), y: scaleY.getPixelForValue(targetCy) };

  ctx.save();
  ctx.strokeStyle = t.inkSoft;
  ctx.lineWidth = 1.5;
  ctx.beginPath();
  ctx.moveTo(labelPx.x, labelPx.y + 4);
  ctx.lineTo(targetPx.x, targetPx.y);
  ctx.stroke();

  ctx.fillStyle = t.inkSoft;
  ctx.beginPath();
  ctx.arc(targetPx.x, targetPx.y, 3, 0, Math.PI * 2);
  ctx.fill();

  ctx.font = "bold 16px -apple-system, BlinkMacSystemFont, sans-serif";
  ctx.fillStyle = t.ink;
  ctx.textAlign = "center";
  ctx.textBaseline = "bottom";
  ctx.fillText(text, labelPx.x, labelPx.y);
  ctx.restore();
}

// Renders the Mandelbrot set into an offscreen canvas using smooth (continuous)
// escape-time coloring — no discrete iteration bands. Points that never escape
// (bounded, inside the set) render solid black, per the spec.
function renderMandelbrot(xMin, xMax, yMin, yMax, w, h) {
  const canvas = document.createElement("canvas");
  canvas.width = w;
  canvas.height = h;
  const ctx = canvas.getContext("2d");
  const img = ctx.createImageData(w, h);
  const data = img.data;
  const xRange = xMax - xMin;
  const yRange = yMax - yMin;
  const log2 = Math.log(2);

  for (let py = 0; py < h; py++) {
    const ci = yMax - (py / h) * yRange;
    for (let px = 0; px < w; px++) {
      const cr = xMin + (px / w) * xRange;
      let zr = 0;
      let zi = 0;
      let zr2 = 0;
      let zi2 = 0;
      let n = 0;
      while (zr2 + zi2 <= 4 && n < MAX_ITER) {
        zi = 2 * zr * zi + ci;
        zr = zr2 - zi2 + cr;
        zr2 = zr * zr;
        zi2 = zi * zi;
        n++;
      }
      const idx = (py * w + px) * 4;
      if (n >= MAX_ITER) {
        data[idx] = 0;
        data[idx + 1] = 0;
        data[idx + 2] = 0;
      } else {
        // Continuous escape count avoids the banding a raw integer n gives.
        const zn = Math.sqrt(zr2 + zi2);
        const nu = Math.log(Math.log(zn) / log2) / log2;
        const smoothN = n + 1 - nu;
        let ft = smoothN / MAX_ITER;
        if (ft < 0) ft = 0;
        if (ft > 1) ft = 1;
        ft = Math.pow(ft, 0.6); // gamma-lift the low end so the green→blue gradient stays visible far from the boundary
        const pi = Math.round(ft * 255);
        data[idx] = PALETTE[pi * 3];
        data[idx + 1] = PALETTE[pi * 3 + 1];
        data[idx + 2] = PALETTE[pi * 3 + 2];
      }
      data[idx + 3] = 255;
    }
  }
  ctx.putImageData(img, 0, 0);
  return canvas;
}

// --- Mount -------------------------------------------------------------------
const canvas = document.createElement("canvas");
document.getElementById("container").appendChild(canvas);

let mandelbrotCanvas = null;

const mandelbrotPlugin = {
  id: "mandelbrotPlugin",
  afterDraw(chart) {
    const { ctx, chartArea } = chart;
    const areaW = chartArea.right - chartArea.left;
    const areaH = chartArea.bottom - chartArea.top;

    ctx.save();
    if (mandelbrotCanvas) {
      ctx.imageSmoothingEnabled = true;
      ctx.drawImage(mandelbrotCanvas, chartArea.left, chartArea.top, areaW, areaH);
    }
    // Enclosed frame — a heatmap grid reads better with all four spines.
    ctx.strokeStyle = t.inkSoft;
    ctx.lineWidth = 2;
    ctx.strokeRect(chartArea.left, chartArea.top, areaW, areaH);

    // --- Callouts naming the mathematically significant structures --------
    // Both anchor points are known to lie inside the respective structure:
    // (-0.3, 0.35) satisfies the main cardioid's boundary test, and
    // (-1, 0.2) lies inside the period-2 bulb (center -1, radius 0.25).
    drawCallout(ctx, chart.scales.x, chart.scales.y, -0.3, 0.85, -0.3, 0.35, "Cardioid");
    drawCallout(ctx, chart.scales.x, chart.scales.y, -1, 0.6, -1, 0.2, "Period-2 bulb");

    // --- Colorbar legend (escape-time scale + "in set" swatch) -------------
    const barX = chartArea.left;
    const barW = Math.min(560, areaW * 0.5);
    const barY = chart.height - 95;
    const barH = 22;

    ctx.font = "14px -apple-system, BlinkMacSystemFont, sans-serif";
    ctx.fillStyle = t.inkSoft;
    ctx.textAlign = "left";
    ctx.textBaseline = "alphabetic";
    ctx.fillText("Escape iterations (smooth-colored)", barX, barY - 10);

    const gradient = ctx.createLinearGradient(barX, 0, barX + barW, 0);
    gradient.addColorStop(0, t.seq[0]);
    gradient.addColorStop(1, t.seq[1]);
    ctx.fillStyle = gradient;
    ctx.fillRect(barX, barY, barW, barH);
    ctx.strokeStyle = t.inkSoft;
    ctx.lineWidth = 1;
    ctx.strokeRect(barX, barY, barW, barH);

    ctx.fillStyle = t.inkSoft;
    ctx.textAlign = "left";
    ctx.fillText("0", barX, barY + barH + 18);
    ctx.textAlign = "right";
    ctx.fillText(`${MAX_ITER}+`, barX + barW, barY + barH + 18);

    const swatchX = barX + barW + 50;
    ctx.fillStyle = "#000000";
    ctx.fillRect(swatchX, barY, barH, barH);
    ctx.strokeStyle = t.inkSoft;
    ctx.strokeRect(swatchX, barY, barH, barH);
    ctx.fillStyle = t.inkSoft;
    ctx.textAlign = "left";
    ctx.fillText("In the set (bounded, never escapes)", swatchX + barH + 12, barY + barH - 5);

    ctx.restore();
  },
};

// --- Chart ---------------------------------------------------------------
// A scatter chart with no data supplies a real-valued linear x/y coordinate
// system (the complex plane) for the mandelbrotPlugin to draw the raster into.
const chart = new Chart(canvas, {
  type: "scatter",
  data: { datasets: [{ data: [] }] },
  options: {
    responsive: true,
    maintainAspectRatio: false,
    animation: false,
    layout: { padding: { bottom: 130 } },
    plugins: {
      title: {
        display: true,
        text: "heatmap-mandelbrot · javascript · chartjs · anyplot.ai",
        color: t.ink,
        font: { size: 28 },
      },
      legend: { display: false },
    },
    scales: {
      x: {
        min: X_MIN,
        max: X_MAX,
        grid: { display: false },
        border: { display: false },
        // stepSize + includeBounds:false snap ticks to clean integers instead
        // of the raw aspect-widened endpoints (e.g. -3.59, 2.09).
        ticks: { color: t.inkSoft, font: { size: 14 }, stepSize: 1, includeBounds: false, callback: (v) => v.toFixed(0) },
        title: { display: true, text: "Real axis — Re(c)", color: t.ink, font: { size: 16 } },
      },
      y: {
        min: Y_MIN,
        max: Y_MAX,
        grid: { display: false },
        border: { display: false },
        ticks: { color: t.inkSoft, font: { size: 14 }, callback: (v) => v.toFixed(2) },
        title: { display: true, text: "Imaginary axis — Im(c)", color: t.ink, font: { size: 16 } },
      },
    },
  },
  plugins: [mandelbrotPlugin],
});

// Widen the real-axis range (never the imaginary one, which must keep the full
// cardioid + period-2 bulb visible) so real/imaginary units occupy equal pixel
// distance, preserving the complex plane's true proportions regardless of the
// chart area's own aspect ratio.
const area = chart.chartArea;
const areaAspect = (area.right - area.left) / (area.bottom - area.top);
const yRange = Y_MAX - Y_MIN;
const desiredXRange = yRange * areaAspect;
const xCenter = (X_MIN + X_MAX) / 2;
const xMin2 = xCenter - desiredXRange / 2;
const xMax2 = xCenter + desiredXRange / 2;

chart.options.scales.x.min = xMin2;
chart.options.scales.x.max = xMax2;

const gridH = Math.round(Math.sqrt(PIXEL_BUDGET / areaAspect));
const gridW = Math.round(gridH * areaAspect);
mandelbrotCanvas = renderMandelbrot(xMin2, xMax2, Y_MIN, Y_MAX, gridW, gridH);

chart.update("none");

window.__anyplotReady = true;
Runnable source as JSON, for any HTTP client: https://api.anyplot.ai/specs/heatmap-mandelbrot/chartjs/code. Any spec id and library id listed in llms-full.txt fit the same URL shape; every URL below is complete and callable.
{
  "spec_id": "heatmap-mandelbrot",
  "language": "javascript",
  "library": "chartjs",
  "page": "https://anyplot.ai/heatmap-mandelbrot/javascript/chartjs",
  "hub": "https://anyplot.ai/heatmap-mandelbrot",
  "code_json": "https://api.anyplot.ai/specs/heatmap-mandelbrot/chartjs/code",
  "spec_json": "https://api.anyplot.ai/specs/heatmap-mandelbrot",
  "render_light_png": "https://storage.googleapis.com/anyplot-images/plots/heatmap-mandelbrot/javascript/chartjs/plot-light.png",
  "render_dark_png": "https://storage.googleapis.com/anyplot-images/plots/heatmap-mandelbrot/javascript/chartjs/plot-dark.png",
  "interactive_light_html": "https://storage.googleapis.com/anyplot-images/plots/heatmap-mandelbrot/javascript/chartjs/plot-light.html",
  "interactive_dark_html": "https://storage.googleapis.com/anyplot-images/plots/heatmap-mandelbrot/javascript/chartjs/plot-dark.html",
  "quality_score": 90.0,
  "license": "MIT",
  "guide": "https://anyplot.ai/llms.txt"
}
Part of Mandelbrot Set Fractal Visualization on anyplot.ai.