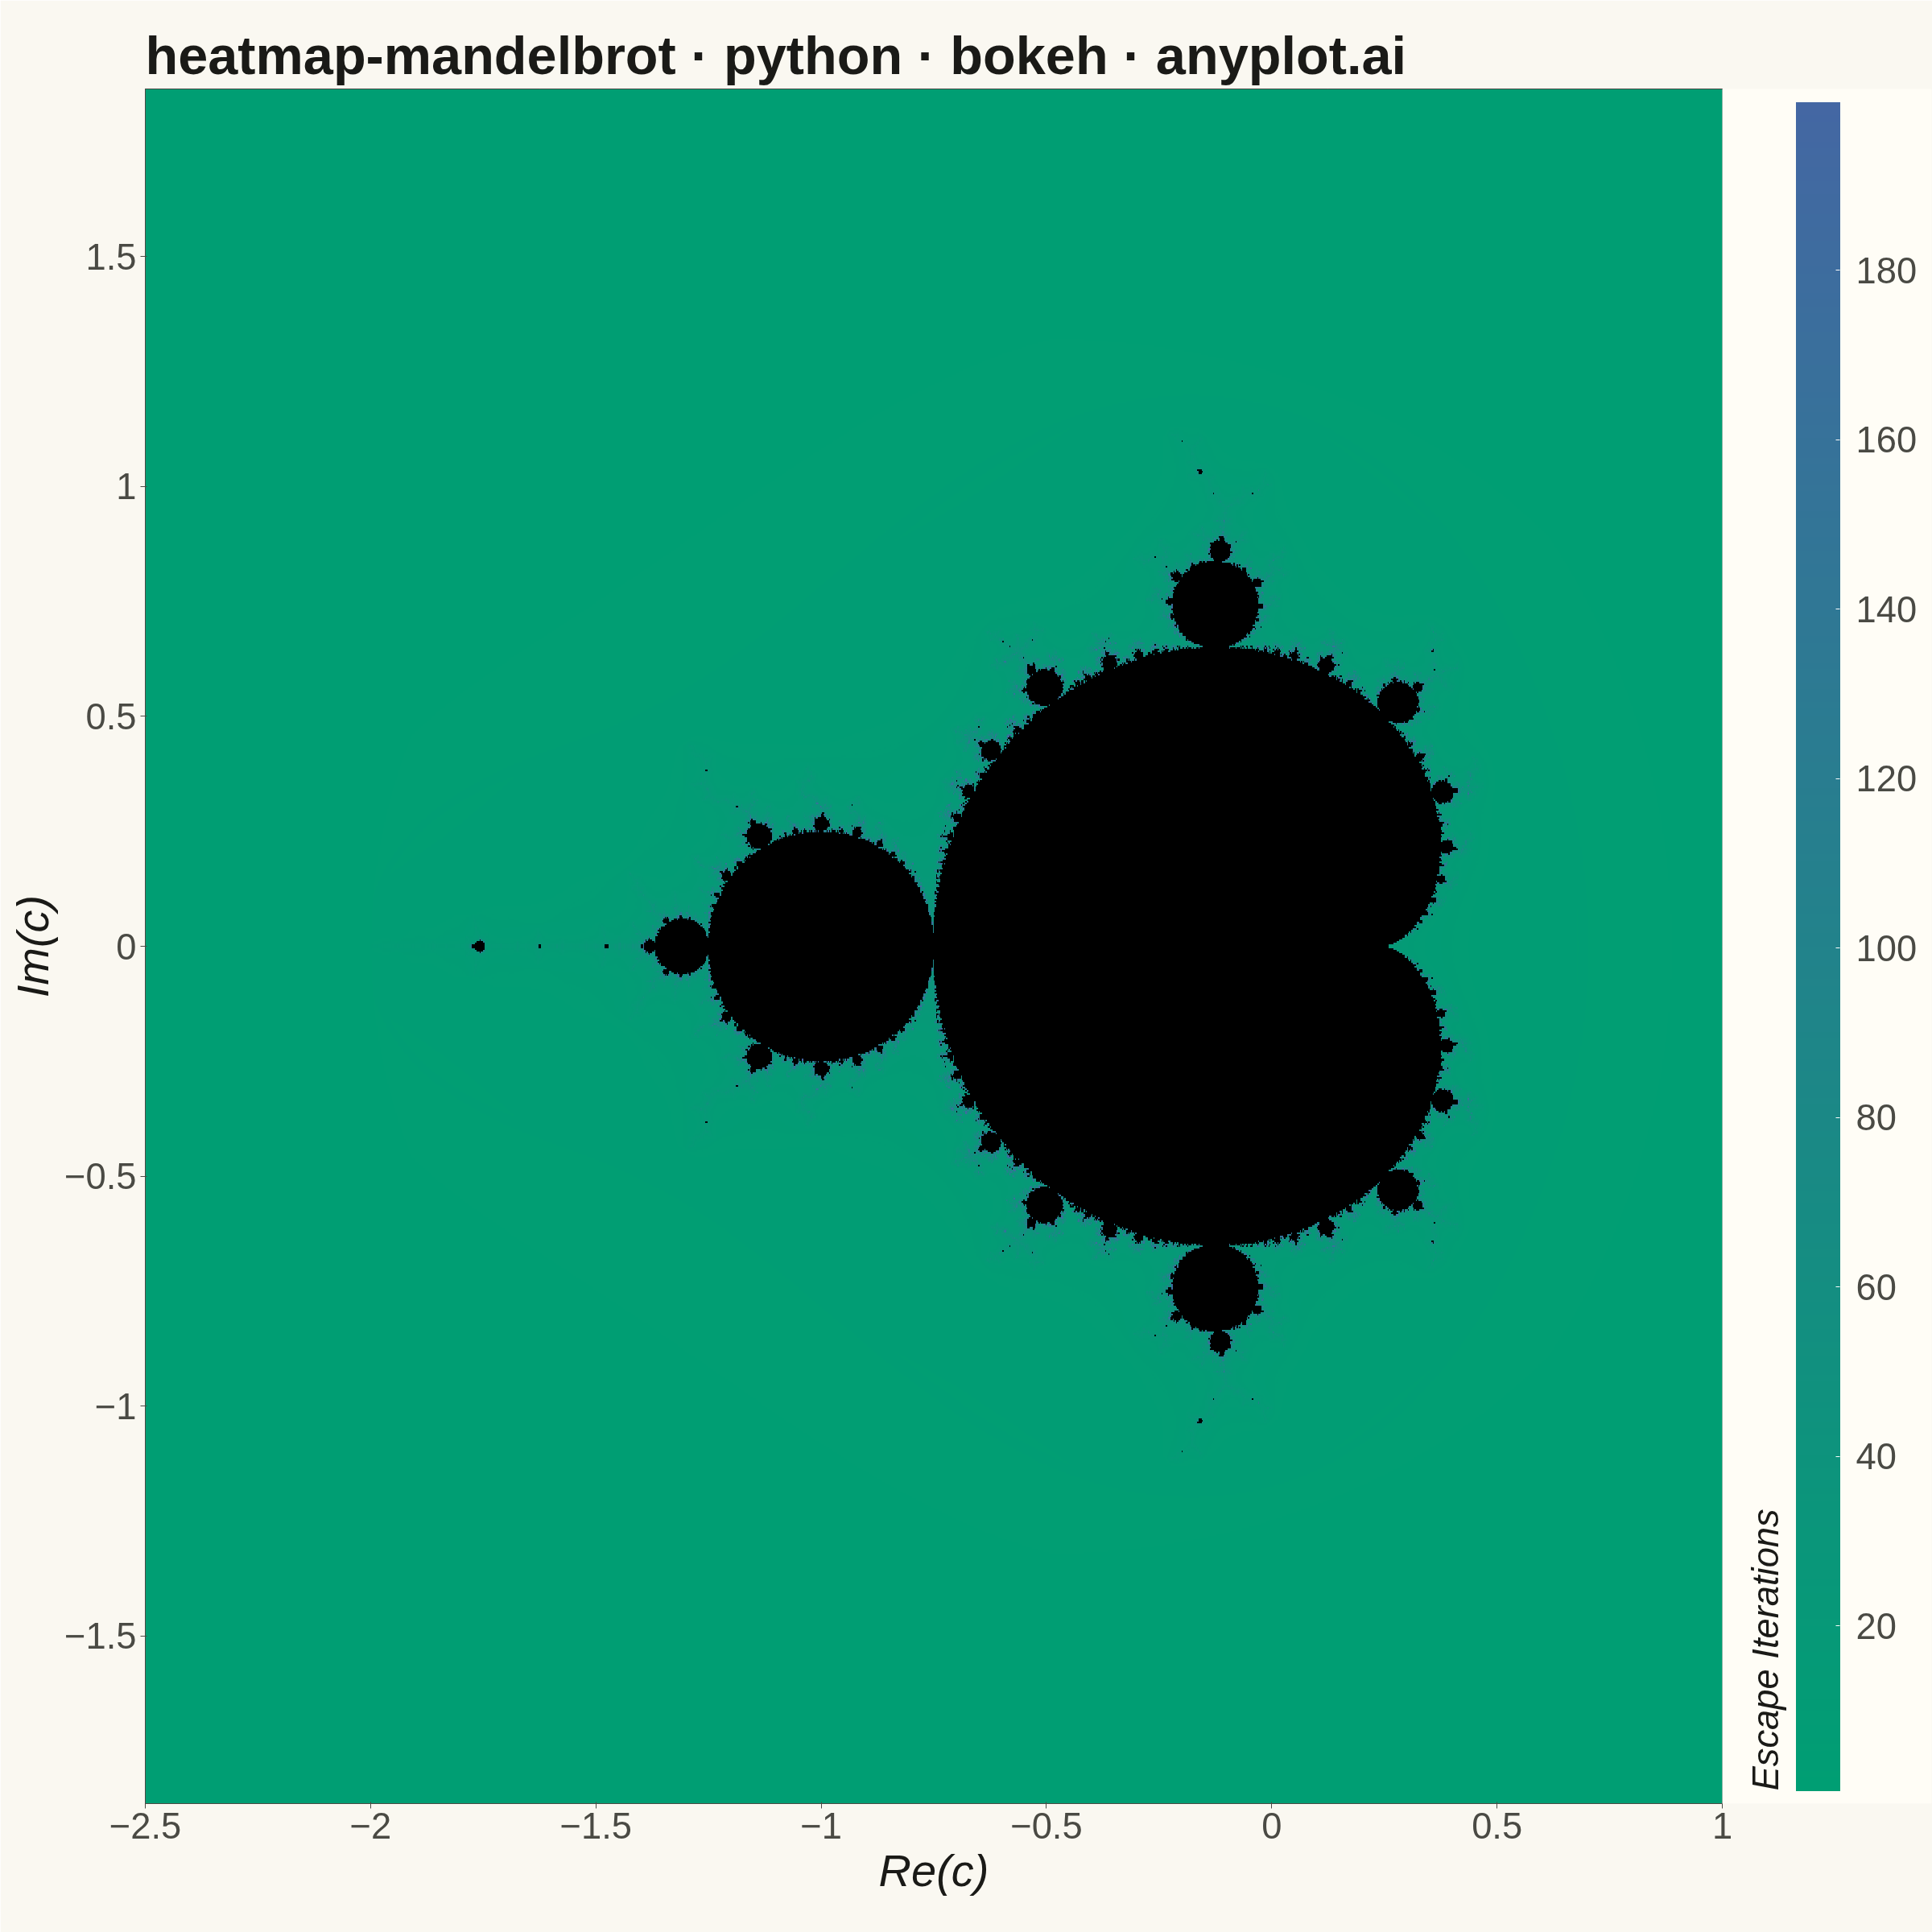
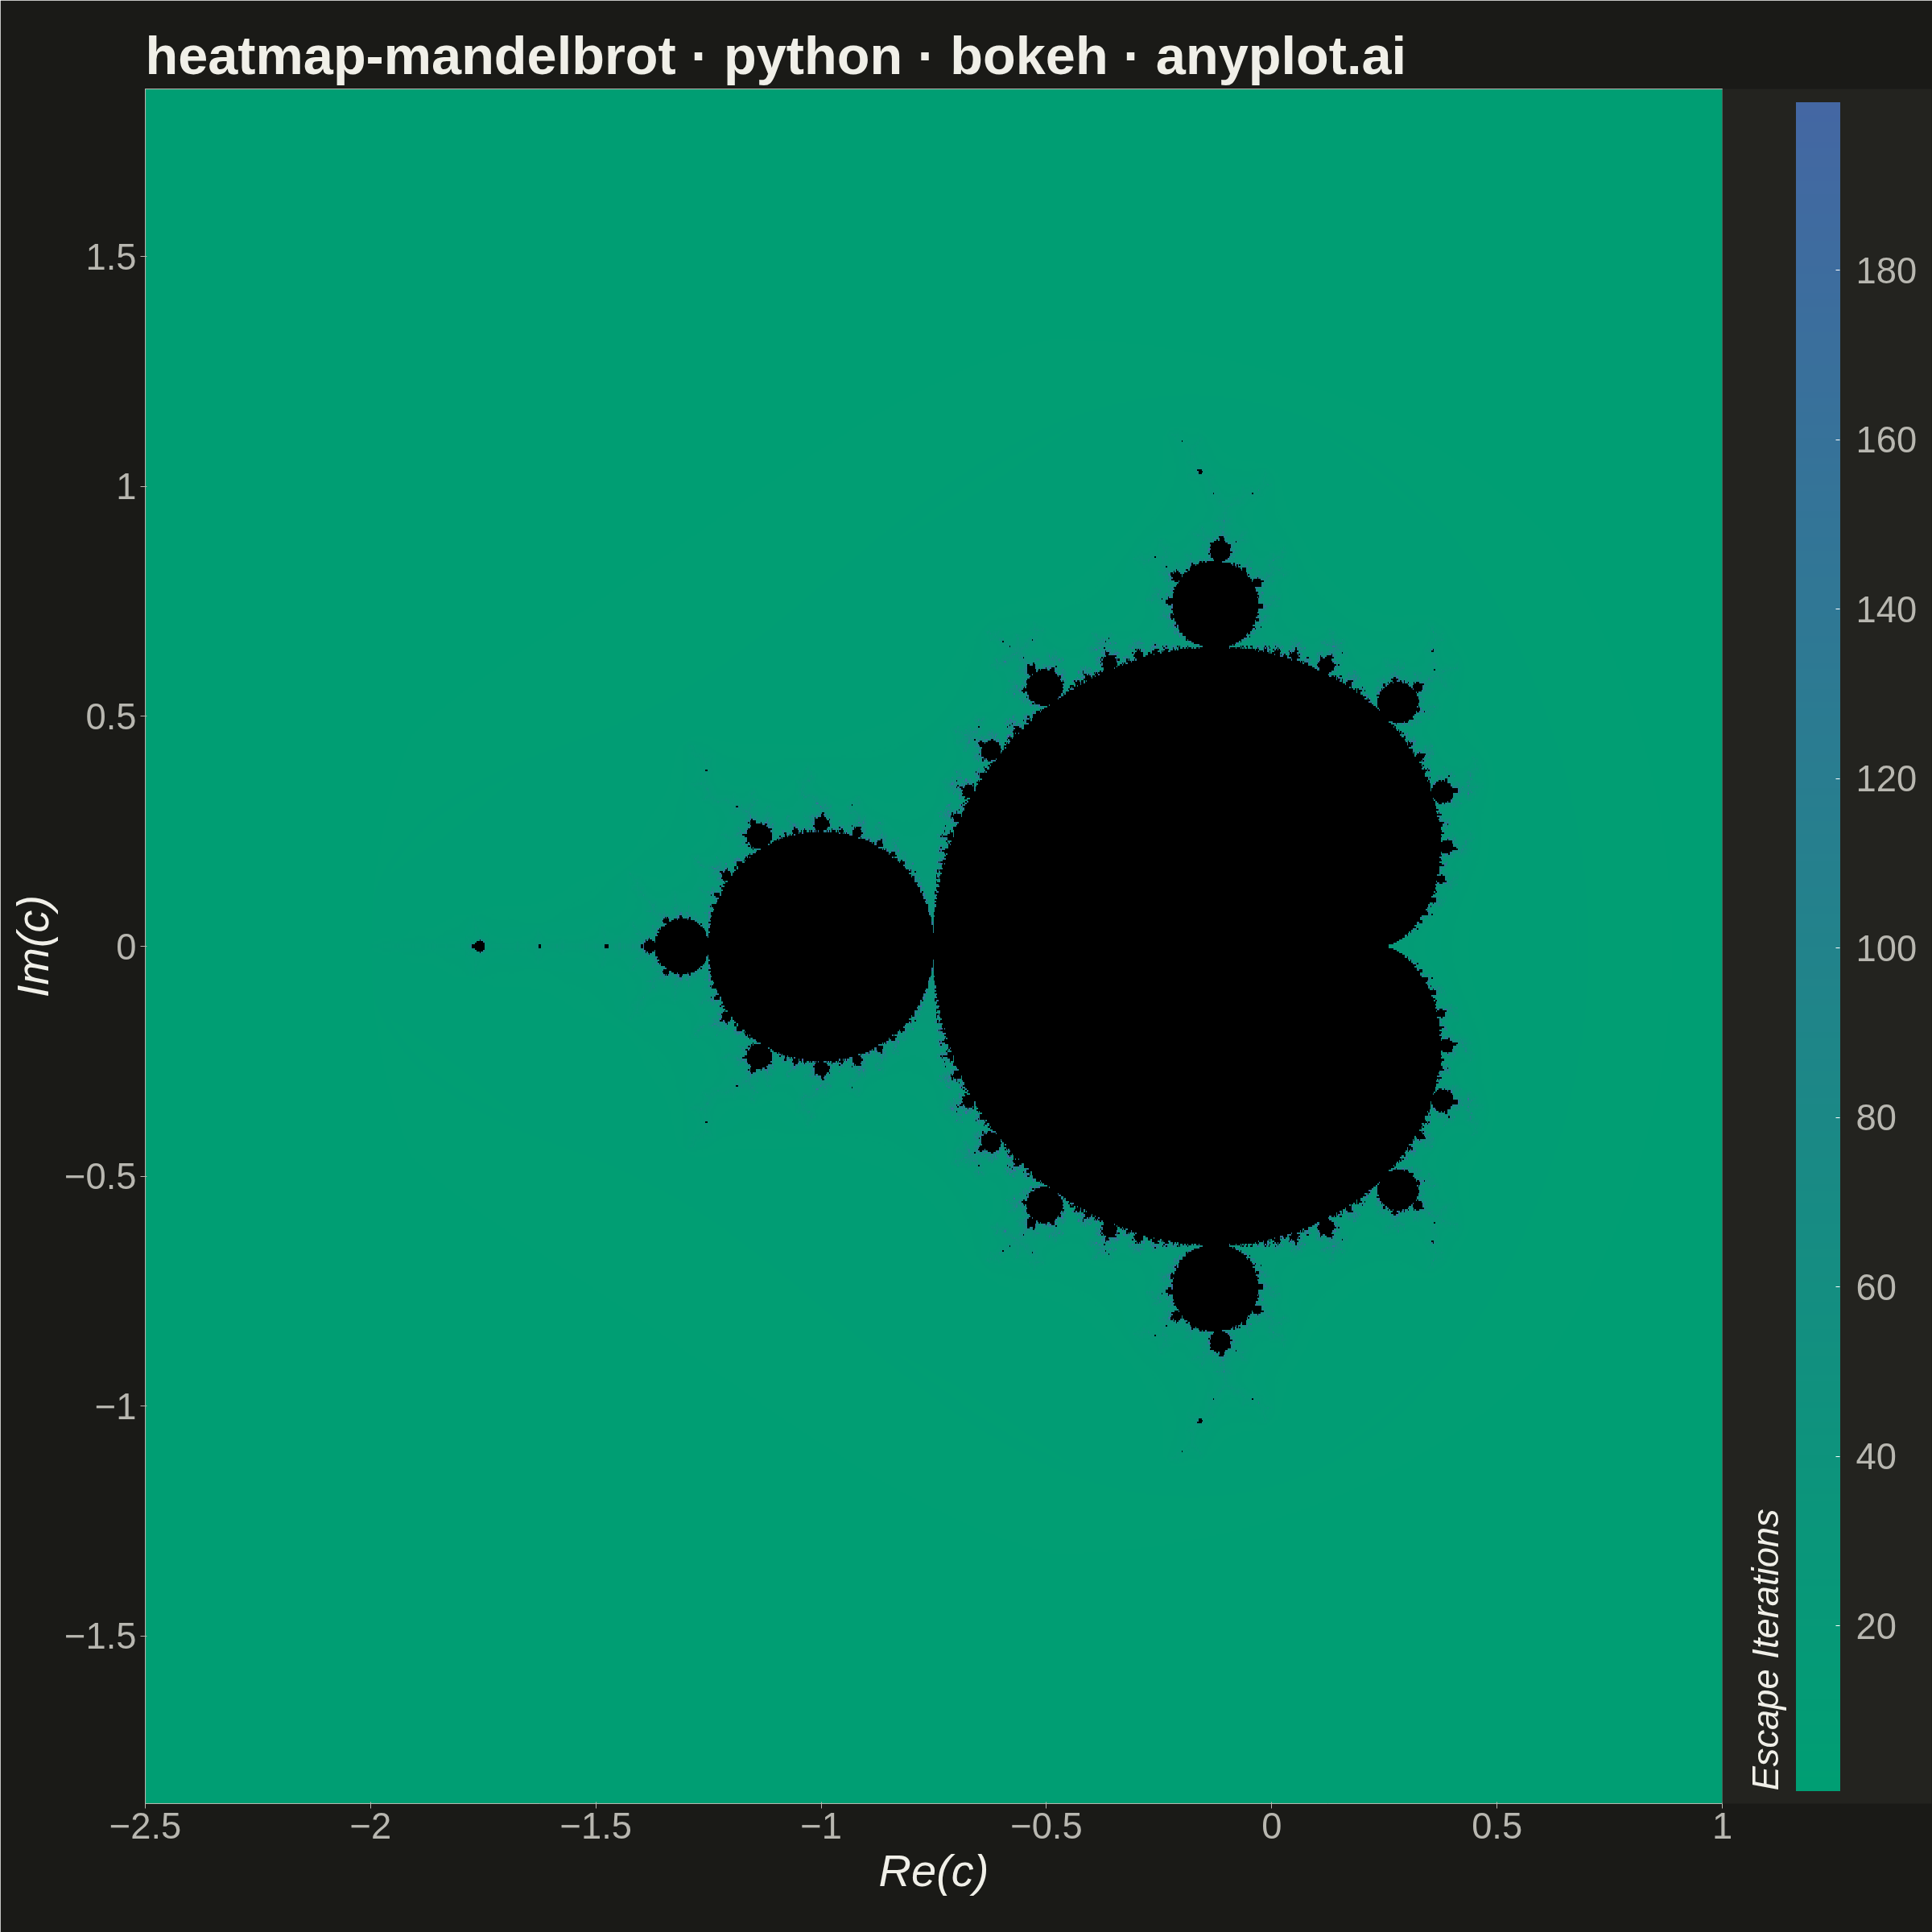
A visualization of the Mandelbrot set, the most iconic fractal in mathematics. Each pixel represents a complex number c on the complex plane, colored by how quickly the iteration z(n+1) = z(n)^2 + c diverges. The boundary between convergent and divergent regions reveals infinitely complex, self-similar structure including the characteristic cardioid and period-2 bulb.
""" anyplot.ai
heatmap-mandelbrot: Mandelbrot Set Fractal Visualization
Library: bokeh 3.9.0 | Python 3.13.13
Quality: 86/100 | Updated: 2026-05-30
"""

import io
import os
import sys


# Prevent self-import: this file is named bokeh.py, so Python's path search would
# find it before the installed bokeh package. Remove the script's own directory
# from sys.path so imports resolve to the installed package.
_own_dir = os.path.dirname(os.path.abspath(__file__))
sys.path = [p for p in sys.path if os.path.abspath(p) != _own_dir]

import time
from pathlib import Path

import numpy as np
from bokeh.io import output_file, save
from bokeh.models import BasicTicker, ColorBar, LinearColorMapper, NumeralTickFormatter
from bokeh.plotting import figure
from PIL import Image
from selenium import webdriver
from selenium.webdriver.chrome.options import Options


# Theme tokens
THEME = os.getenv("ANYPLOT_THEME", "light")
PAGE_BG = "#FAF8F1" if THEME == "light" else "#1A1A17"
ELEVATED_BG = "#FFFDF6" if THEME == "light" else "#242420"
INK = "#1A1A17" if THEME == "light" else "#F0EFE8"
INK_SOFT = "#4A4A44" if THEME == "light" else "#B8B7B0"

# Imprint sequential colormap — brand green (#009E73) → blue (#4467A3), 256 stops
_t = np.linspace(0, 1, 256)
_c0 = np.array([0x00, 0x9E, 0x73])
_c1 = np.array([0x44, 0x67, 0xA3])
_ramp = np.clip(np.round(_c0 + np.outer(_t, _c1 - _c0)).astype(int), 0, 255)
ANYPLOT_SEQ256 = [f"#{r:02X}{g:02X}{b:02X}" for r, g, b in _ramp]

# Data — compute Mandelbrot set on the complex plane
# y-range padded to maintain 1:1 pixel ratio on the 2400x2400 canvas
# (inner area ≈ 2000px wide × 2130px tall after min_borders;
#  x spans 3.5 units → 571.4 px/unit; y needs 2130/571.4 ≈ 3.73 units)
x_min, x_max = -2.5, 1.0
y_min, y_max = -1.865, 1.865
grid_w, grid_h = 1400, 1050
max_iter = 200

real = np.linspace(x_min, x_max, grid_w)
imag = np.linspace(y_min, y_max, grid_h)
real_grid, imag_grid = np.meshgrid(real, imag)
c = real_grid + 1j * imag_grid

z = np.zeros_like(c, dtype=complex)
iteration_count = np.zeros(c.shape, dtype=float)
escaped = np.zeros(c.shape, dtype=bool)

for i in range(max_iter):
    mask = ~escaped
    z[mask] = z[mask] ** 2 + c[mask]
    newly_escaped = mask & (np.abs(z) > 2.0)
    # Smooth coloring: normalized iteration count eliminates discrete banding
    iteration_count[newly_escaped] = i + 1 - np.log2(np.log2(np.abs(z[newly_escaped])))
    escaped |= newly_escaped

# Interior points (non-escaping) → NaN → rendered as near-black via nan_color
iteration_count[~escaped] = np.nan

valid = ~np.isnan(iteration_count)
# Clip low to 5th percentile so the full palette spreads across the visible
# gradient range instead of being compressed near the fast-escape floor.
low_val = float(np.percentile(iteration_count[valid], 5)) if np.any(valid) else 0.0
high_val = float(np.nanmax(iteration_count[valid])) if np.any(valid) else float(max_iter)

# Title — 48 chars, within 67-char baseline, no fontsize scaling needed
title = "heatmap-mandelbrot · python · bokeh · anyplot.ai"

# Plot — 2400x2400 square canvas (heatmap category per style guide)
W, H = 2400, 2400
p = figure(
    width=W,
    height=H,
    x_range=(x_min, x_max),
    y_range=(y_min, y_max),
    title=title,
    x_axis_label="Re(c)",
    y_axis_label="Im(c)",
    toolbar_location=None,
    tools="",
    min_border_bottom=160,
    min_border_left=180,
    min_border_top=110,
    min_border_right=220,
)

# LinearColorMapper with 5th-percentile low clips the flat fast-escape floor,
# spreading the gradient evenly across the visible range; interior (NaN) → black
mapper = LinearColorMapper(palette=ANYPLOT_SEQ256, low=low_val, high=high_val, nan_color="#000000")

p.image(image=[iteration_count], x=x_min, y=y_min, dw=x_max - x_min, dh=y_max - y_min, color_mapper=mapper)

# Color bar
color_bar = ColorBar(
    color_mapper=mapper,
    ticker=BasicTicker(desired_num_ticks=8),
    formatter=NumeralTickFormatter(format="0"),
    label_standoff=20,
    width=55,
    title="Escape Iterations",
    title_text_font_size="34pt",
    title_text_color=INK,
    major_label_text_font_size="34pt",
    major_label_text_color=INK_SOFT,
    title_standoff=24,
    border_line_color=None,
    padding=16,
    background_fill_color=ELEVATED_BG,
)
p.add_layout(color_bar, "right")

# Style — canonical bokeh font sizes for 2400x2400 canvas
p.title.text_font_size = "50pt"
p.title.text_color = INK
p.xaxis.axis_label_text_font_size = "42pt"
p.yaxis.axis_label_text_font_size = "42pt"
p.xaxis.major_label_text_font_size = "34pt"
p.yaxis.major_label_text_font_size = "34pt"
p.xaxis.axis_label_text_color = INK
p.yaxis.axis_label_text_color = INK
p.xaxis.major_label_text_color = INK_SOFT
p.yaxis.major_label_text_color = INK_SOFT
p.xaxis.axis_line_color = INK_SOFT
p.yaxis.axis_line_color = INK_SOFT
p.xaxis.major_tick_line_color = INK_SOFT
p.yaxis.major_tick_line_color = INK_SOFT
p.xaxis.minor_tick_line_color = None
p.yaxis.minor_tick_line_color = None
p.xgrid.grid_line_color = None
p.ygrid.grid_line_color = None
p.outline_line_color = INK_SOFT
p.background_fill_color = PAGE_BG
p.border_fill_color = PAGE_BG

# Save HTML artifact (interactive catalog output)
output_file(f"plot-{THEME}.html")
save(p)

# Screenshot via headless Chrome — Chrome's viewport is ~139px shorter than
# --window-size, so use H + 200 buffer then crop to exact canvas dimensions.
opts = Options()
for arg in (
    "--headless=new",
    "--no-sandbox",
    "--disable-dev-shm-usage",
    "--disable-gpu",
    f"--window-size={W},{H + 200}",
    "--hide-scrollbars",
    "--force-device-scale-factor=1",
):
    opts.add_argument(arg)
driver = webdriver.Chrome(options=opts)
driver.set_window_size(W, H + 200)
driver.get(f"file://{Path(f'plot-{THEME}.html').resolve()}")
time.sleep(3)
raw = driver.get_screenshot_as_png()
driver.quit()
Image.open(io.BytesIO(raw)).crop((0, 0, W, H)).save(f"plot-{THEME}.png")
Runnable source as JSON, for any HTTP client: https://api.anyplot.ai/specs/heatmap-mandelbrot/bokeh/code. Any spec id and library id listed in llms-full.txt fit the same URL shape; every URL below is complete and callable.
{
  "spec_id": "heatmap-mandelbrot",
  "language": "python",
  "library": "bokeh",
  "page": "https://anyplot.ai/heatmap-mandelbrot/python/bokeh",
  "hub": "https://anyplot.ai/heatmap-mandelbrot",
  "code_json": "https://api.anyplot.ai/specs/heatmap-mandelbrot/bokeh/code",
  "spec_json": "https://api.anyplot.ai/specs/heatmap-mandelbrot",
  "render_light_png": "https://storage.googleapis.com/anyplot-images/plots/heatmap-mandelbrot/python/bokeh/plot-light.png",
  "render_dark_png": "https://storage.googleapis.com/anyplot-images/plots/heatmap-mandelbrot/python/bokeh/plot-dark.png",
  "interactive_light_html": "https://storage.googleapis.com/anyplot-images/plots/heatmap-mandelbrot/python/bokeh/plot-light.html",
  "interactive_dark_html": "https://storage.googleapis.com/anyplot-images/plots/heatmap-mandelbrot/python/bokeh/plot-dark.html",
  "quality_score": 86.0,
  "license": "MIT",
  "guide": "https://anyplot.ai/llms.txt"
}
Part of Mandelbrot Set Fractal Visualization on anyplot.ai.