The same plot in 14 other libraries — Python: Altair, Bokeh, lets-plot, Matplotlib, Plotly, plotnine, Pygal, Seaborn; Julia: Makie.jl; JavaScript: Chart.js, D3.js, Apache ECharts, Highcharts, MUI X Charts. Compare all 15 side by side: Mandelbrot Set Fractal Visualization in Python, R, Julia and JavaScript.
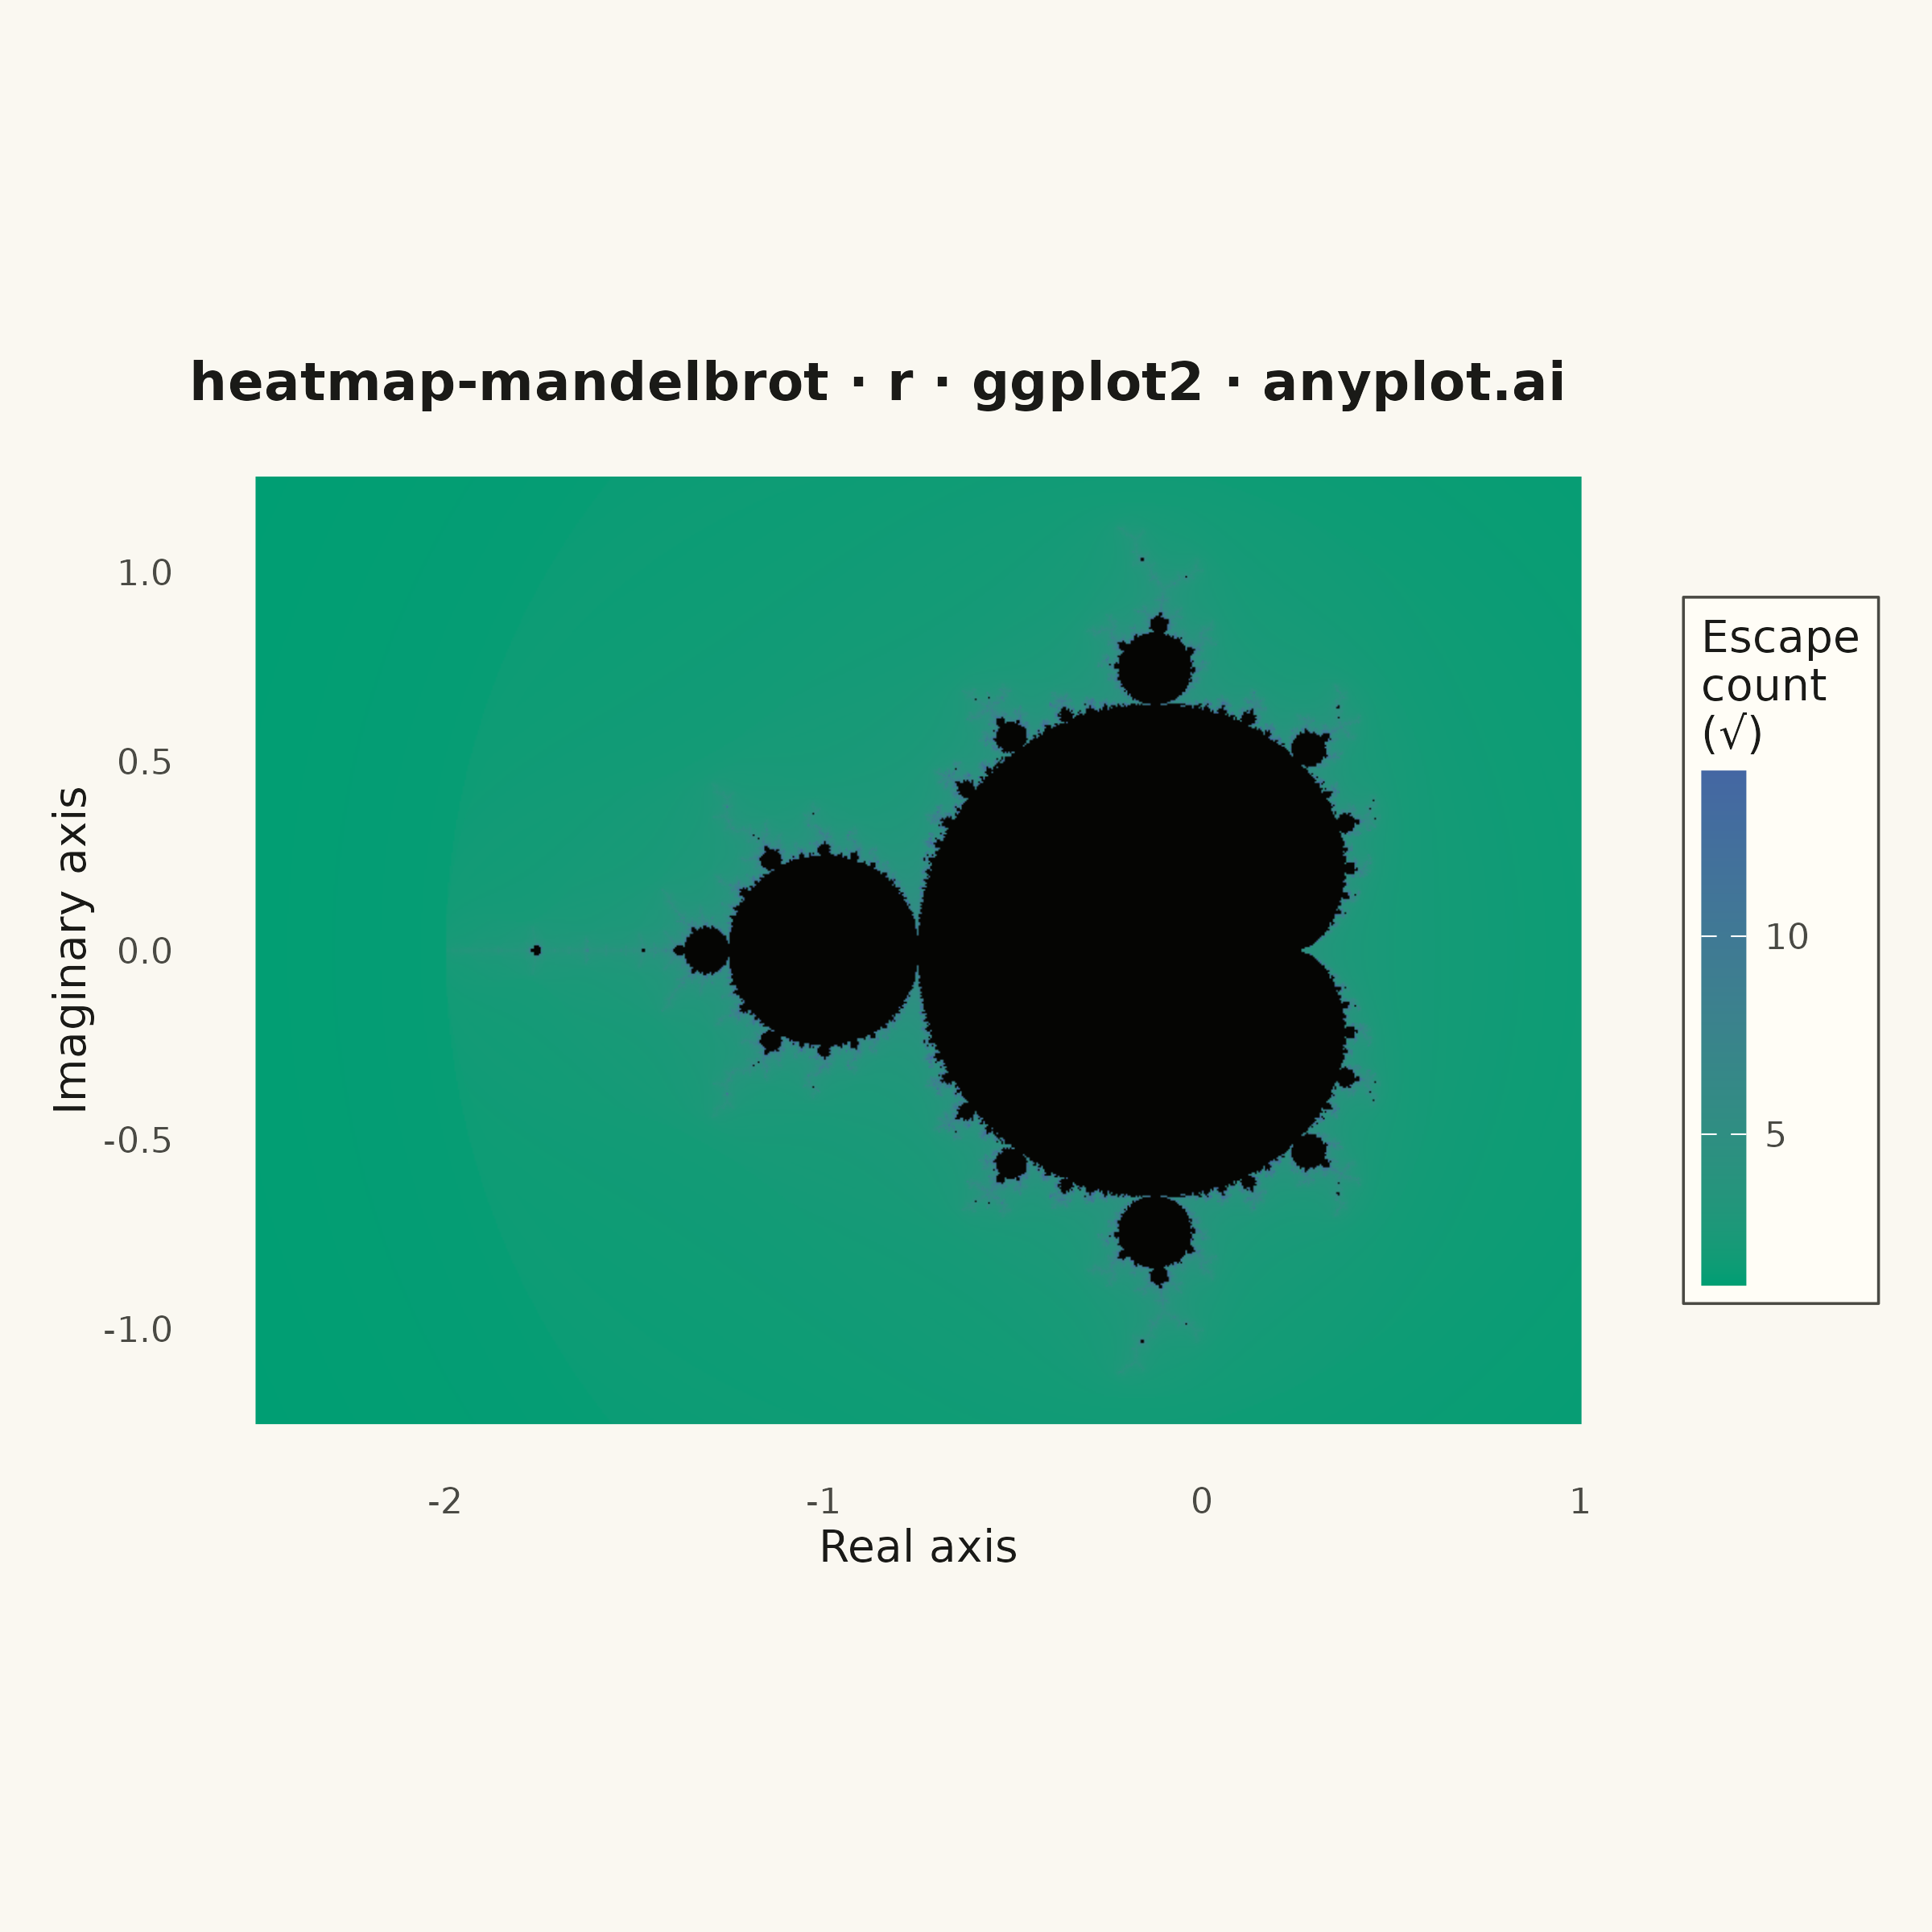
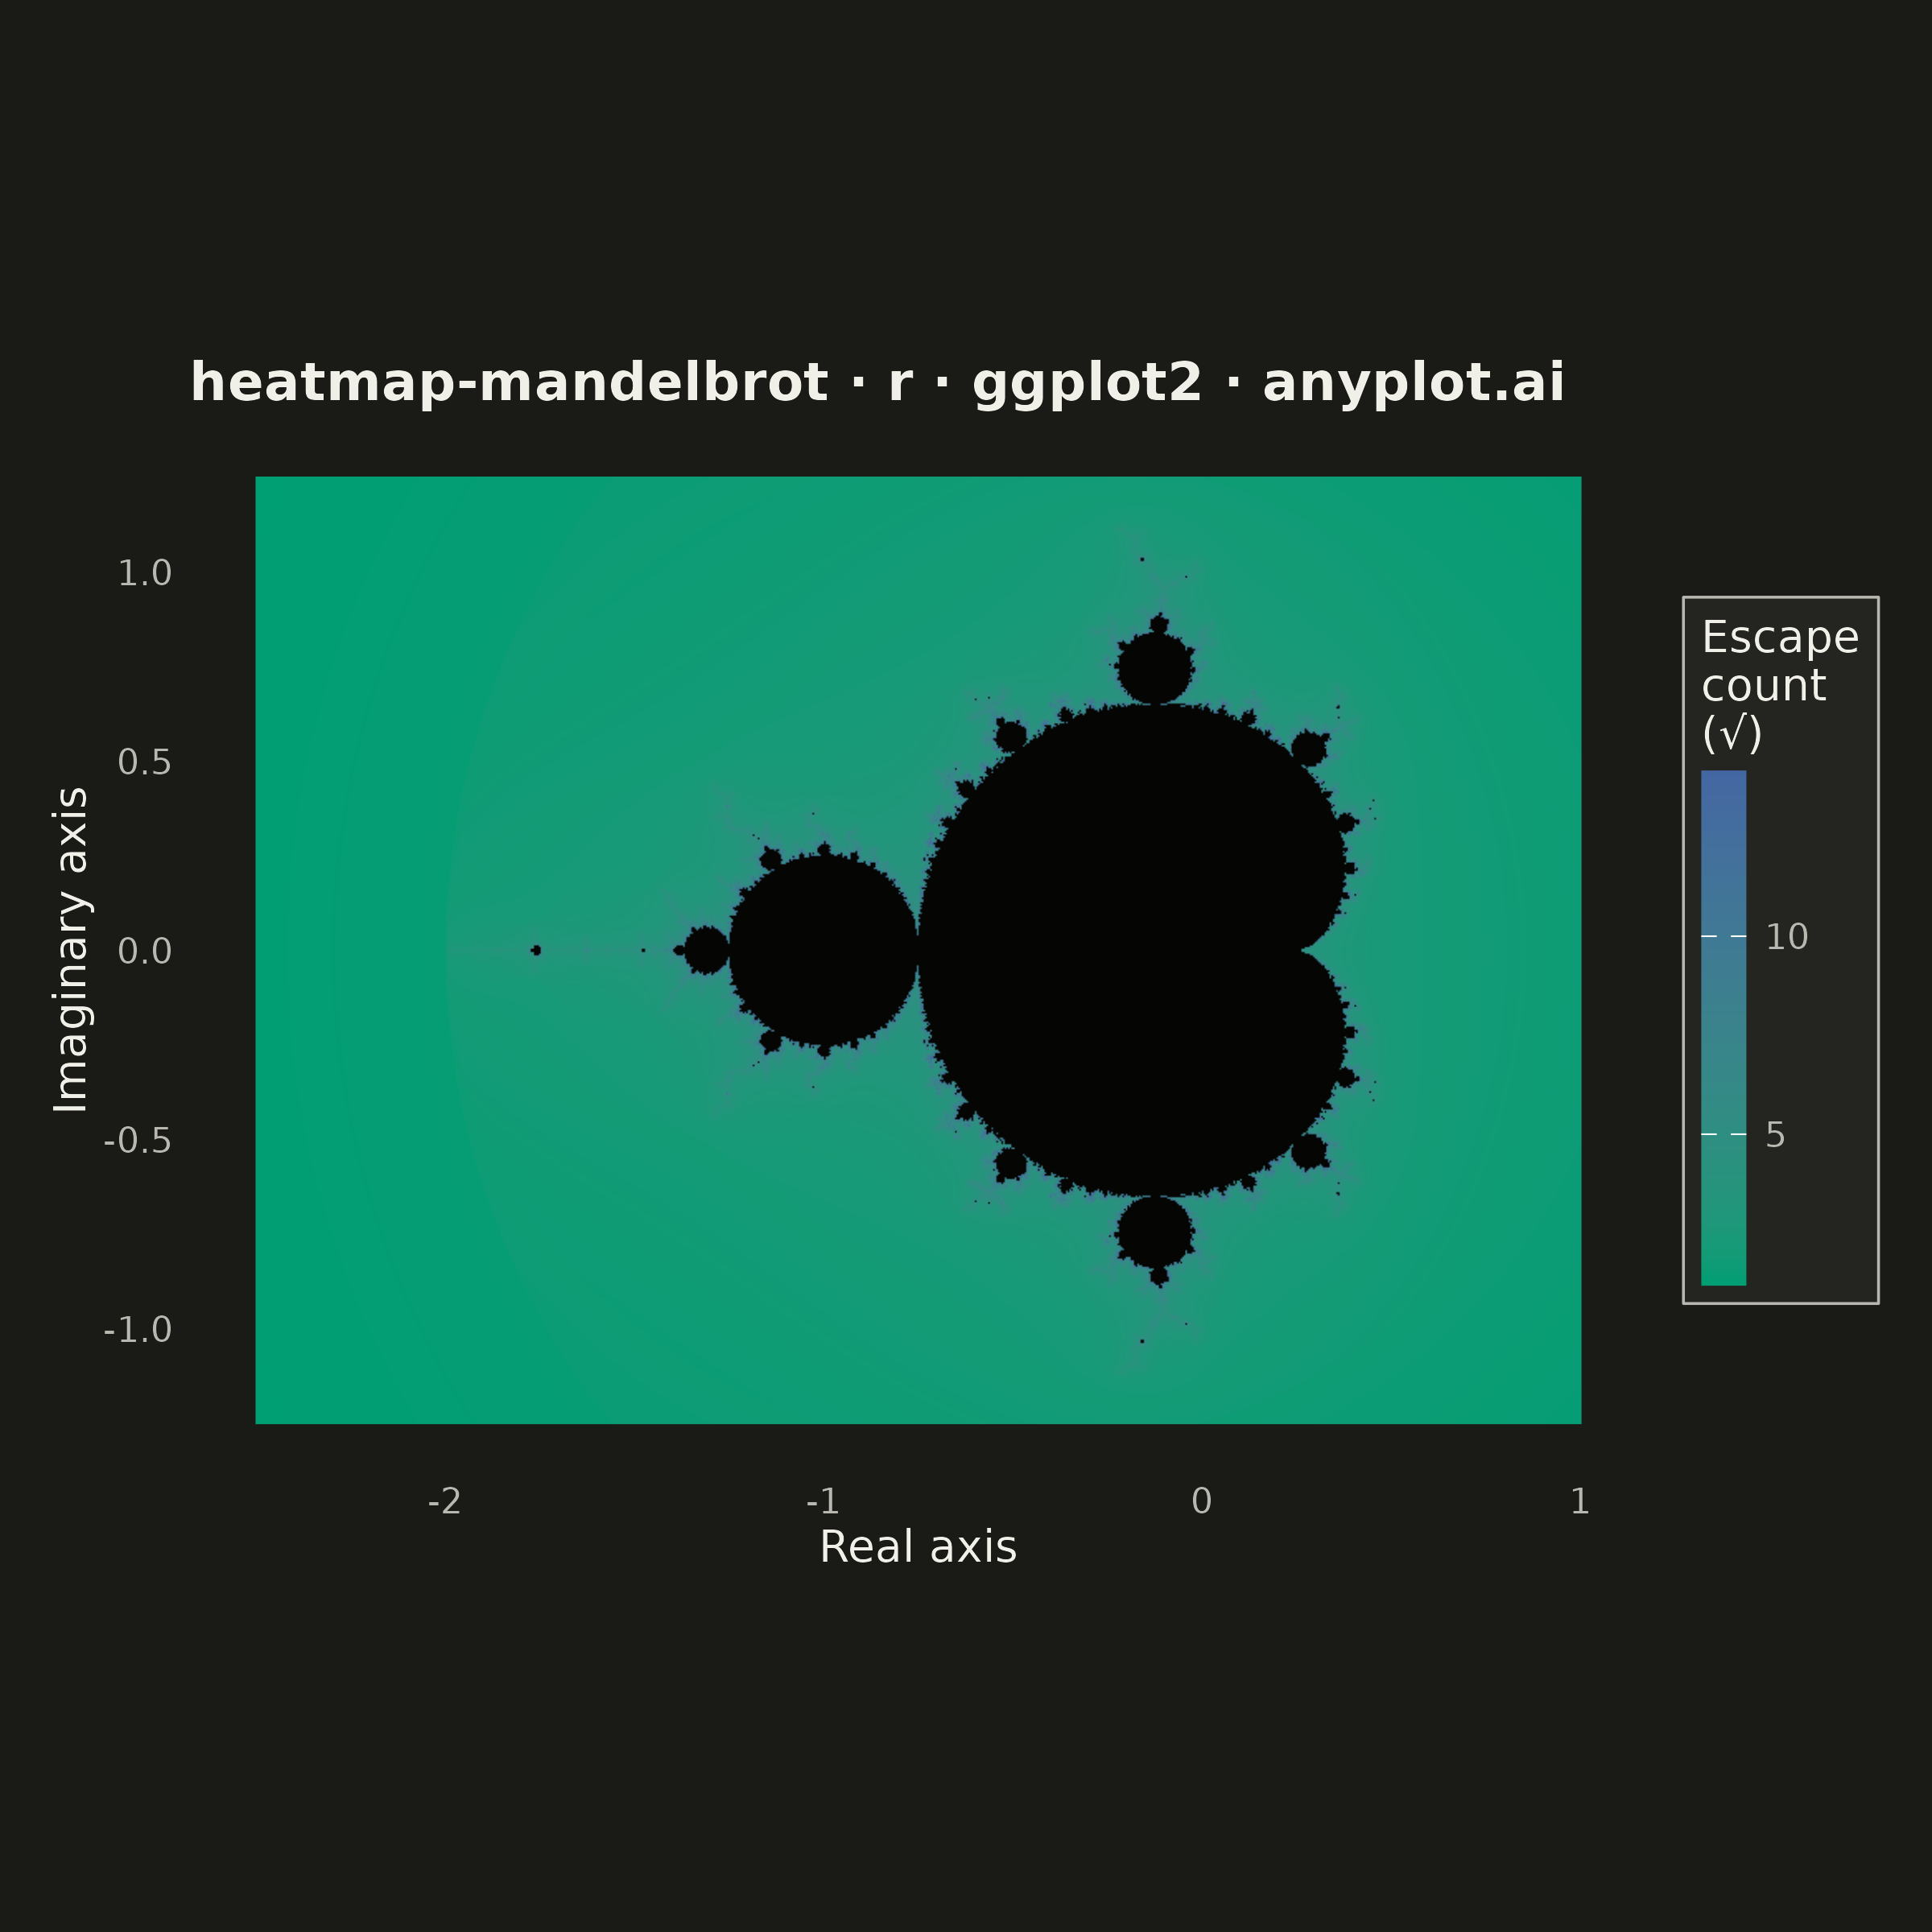
A visualization of the Mandelbrot set, the most iconic fractal in mathematics. Each pixel represents a complex number c on the complex plane, colored by how quickly the iteration z(n+1) = z(n)^2 + c diverges. The boundary between convergent and divergent regions reveals infinitely complex, self-similar structure including the characteristic cardioid and period-2 bulb.
#' anyplot.ai
#' heatmap-mandelbrot: Mandelbrot Set Fractal Visualization
#' Library: ggplot2 3.5.1 | R 4.4.1
#' Quality: 85/100 | Created: 2026-05-30

library(ggplot2)
library(ragg)

# Theme tokens (Imprint palette)
THEME       <- Sys.getenv("ANYPLOT_THEME", "light")
PAGE_BG     <- if (THEME == "light") "#FAF8F1" else "#1A1A17"
ELEVATED_BG <- if (THEME == "light") "#FFFDF6" else "#242420"
INK         <- if (THEME == "light") "#1A1A17" else "#F0EFE8"
INK_SOFT    <- if (THEME == "light") "#4A4A44" else "#B8B7B0"

# Imprint sequential colormap for continuous escape iterations
SEQ_LOW  <- "#009E73"  # Imprint position 1 — brand green (boundary region)
SEQ_HIGH <- "#4467A3"  # Imprint position 3 — blue (far exterior)

# Mandelbrot parameters
MAX_ITER <- 200
NX       <- 800
NY       <- 572  # maintains 3.5 : 2.5 complex-plane aspect ratio

x_seq <- seq(-2.5,  1.0,  length.out = NX)
y_seq <- seq(-1.25, 1.25, length.out = NY)

# Build flat grid vectors (all NX * NY coordinate pairs)
real_vec <- rep(x_seq, times = NY)
imag_vec <- rep(y_seq, each  = NX)

# Vectorized Mandelbrot iteration
# Narrows the active-index set each loop so work shrinks as points escape.
zr      <- numeric(NX * NY)
zi      <- numeric(NX * NY)
escape  <- rep(NA_real_, NX * NY)  # NA = inside the set
log_mag <- rep(NA_real_, NX * NY)  # log2(log2(|z|)) at escape — for smooth coloring

for (i in seq_len(MAX_ITER)) {
    idx <- which(is.na(escape))
    if (length(idx) == 0L) break

    zr_new <- zr[idx]^2 - zi[idx]^2 + real_vec[idx]
    zi_new <- 2.0 * zr[idx] * zi[idx] + imag_vec[idx]
    zr[idx] <- zr_new
    zi[idx] <- zi_new

    mod_sq <- zr[idx]^2 + zi[idx]^2
    hit    <- mod_sq > 4.0
    if (any(hit)) {
        hit_idx         <- idx[hit]
        escape[hit_idx] <- as.numeric(i)
        # Smooth coloring: log2(0.5 * log2(|z|^2)) = log2(log2(|z|))
        # Stable when mod_sq > 4 because 0.5 * log2(mod_sq) > 1 always holds.
        log_mag[hit_idx] <- log2(0.5 * log2(mod_sq[hit]))
    }
}

# Smooth escape count — eliminates integer banding at iteration boundaries
# escape + 1 - log2(log2(|z|)) : fractional part interpolates between iterations
escape_smooth <- escape + 1.0 - log_mag  # NA (interior) passes through as NA
escape_vis    <- sqrt(pmax(escape_smooth, 0.0))  # sqrt spreads boundary detail

df <- data.frame(
    real = real_vec,
    imag = imag_vec,
    esc  = escape_vis
)

TITLE <- "heatmap-mandelbrot · r · ggplot2 · anyplot.ai"

p <- ggplot(df, aes(x = real, y = imag, fill = esc)) +
    geom_raster(interpolate = TRUE) +
    scale_fill_gradient(
        low      = SEQ_LOW,
        high     = SEQ_HIGH,
        na.value = "#050503",  # fixed dark interior independent of theme
        name     = "Escape\ncount\n(√)",
        guide    = guide_colorbar(
            title.position = "top",
            barwidth       = 0.7,
            barheight      = 8
        )
    ) +
    coord_fixed(ratio = 1) +
    labs(
        title = TITLE,
        x     = "Real axis",
        y     = "Imaginary axis"
    ) +
    theme_minimal(base_size = 8) +
    theme(
        plot.background   = element_rect(fill = PAGE_BG,     color = PAGE_BG),
        panel.background  = element_rect(fill = PAGE_BG,      color = NA),
        panel.grid.major  = element_blank(),
        panel.grid.minor  = element_blank(),
        panel.border      = element_blank(),
        axis.title        = element_text(color = INK,        size = 10),
        axis.text         = element_text(color = INK_SOFT,   size = 8),
        plot.title        = element_text(color = INK,        size = 12, face = "bold"),
        legend.background = element_rect(fill = ELEVATED_BG, color = INK_SOFT,
                                         linewidth = 0.3),
        legend.text       = element_text(color = INK_SOFT,   size = 8),
        legend.title      = element_text(color = INK,        size = 10),
        plot.margin       = margin(12, 12, 12, 12)
    )

# Save — square canvas: width = 6, height = 6, dpi = 400 → 2400 × 2400 px
ggsave(
    filename = sprintf("plot-%s.png", THEME),
    plot     = p,
    device   = ragg::agg_png,
    width    = 6,
    height   = 6,
    units    = "in",
    dpi      = 400
)
Runnable source as JSON, for any HTTP client: https://api.anyplot.ai/specs/heatmap-mandelbrot/ggplot2/code. Any spec id and library id listed in llms-full.txt fit the same URL shape; every URL below is complete and callable.
{
  "spec_id": "heatmap-mandelbrot",
  "language": "r",
  "library": "ggplot2",
  "page": "https://anyplot.ai/heatmap-mandelbrot/r/ggplot2",
  "hub": "https://anyplot.ai/heatmap-mandelbrot",
  "code_json": "https://api.anyplot.ai/specs/heatmap-mandelbrot/ggplot2/code",
  "spec_json": "https://api.anyplot.ai/specs/heatmap-mandelbrot",
  "render_light_png": "https://storage.googleapis.com/anyplot-images/plots/heatmap-mandelbrot/r/ggplot2/plot-light.png",
  "render_dark_png": "https://storage.googleapis.com/anyplot-images/plots/heatmap-mandelbrot/r/ggplot2/plot-dark.png",
  "quality_score": 85.0,
  "license": "MIT",
  "guide": "https://anyplot.ai/llms.txt"
}
Part of Mandelbrot Set Fractal Visualization on anyplot.ai.