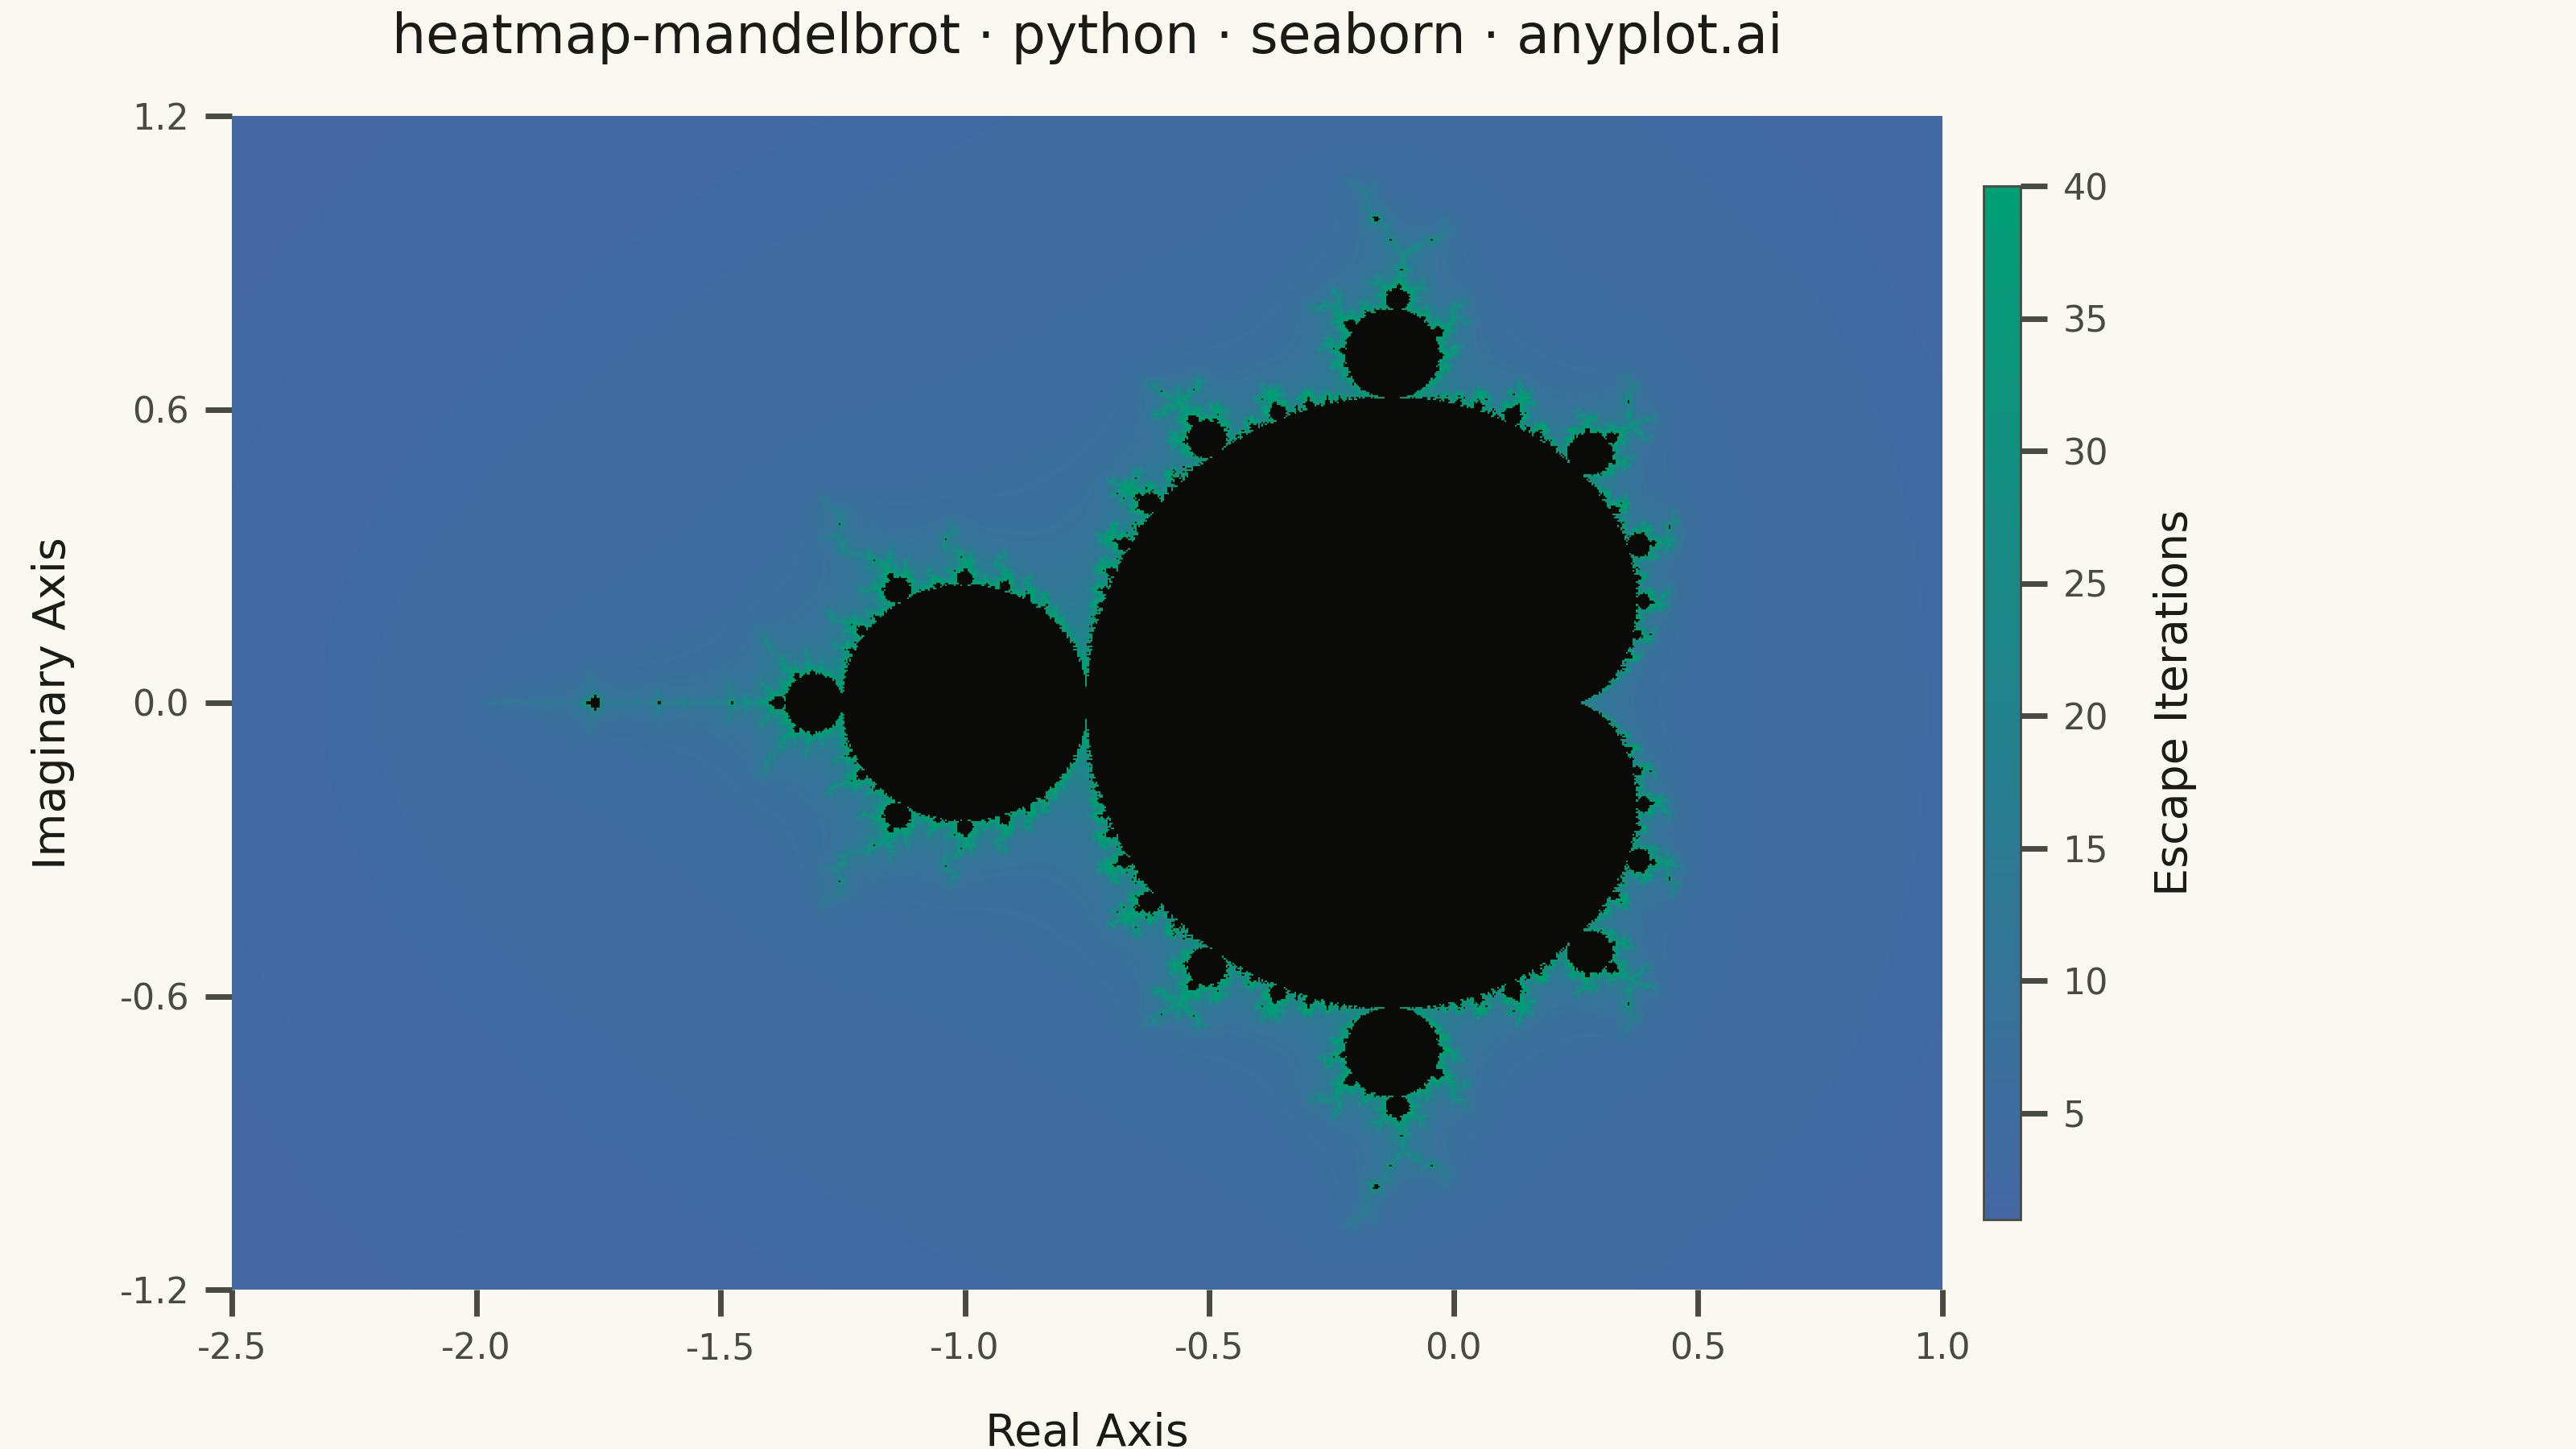
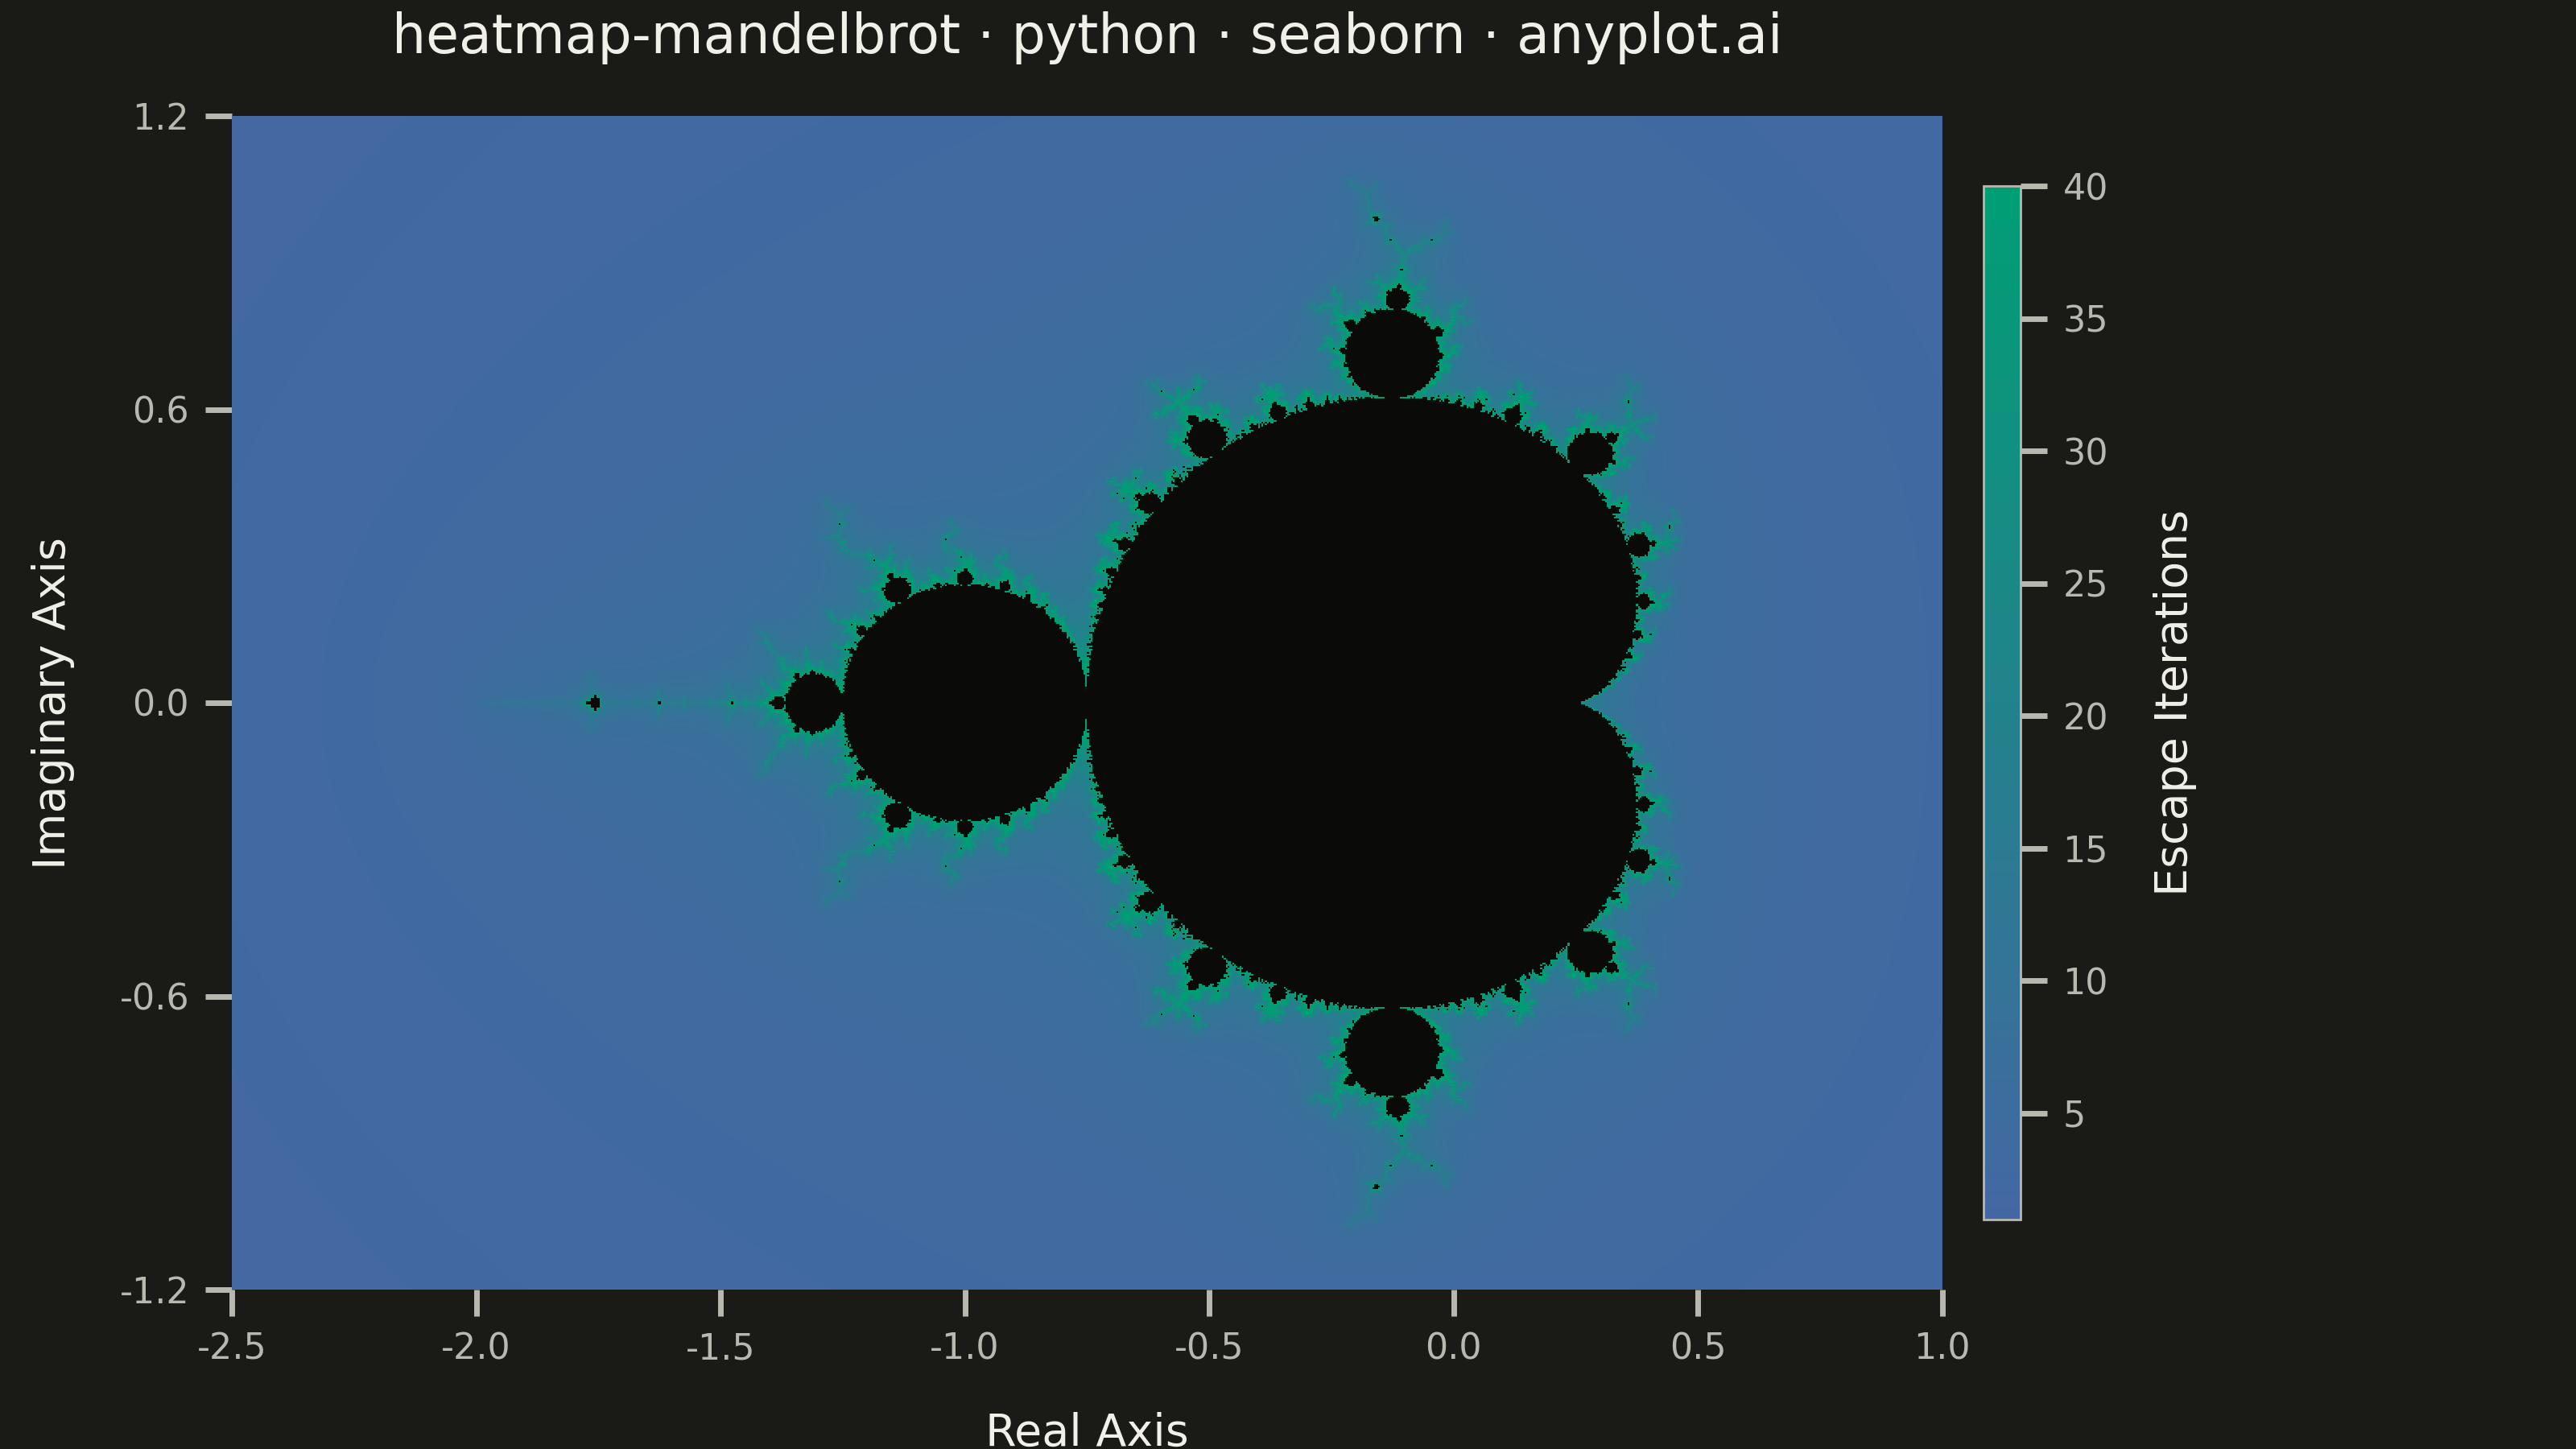
A visualization of the Mandelbrot set, the most iconic fractal in mathematics. Each pixel represents a complex number c on the complex plane, colored by how quickly the iteration z(n+1) = z(n)^2 + c diverges. The boundary between convergent and divergent regions reveals infinitely complex, self-similar structure including the characteristic cardioid and period-2 bulb.
""" anyplot.ai
heatmap-mandelbrot: Mandelbrot Set Fractal Visualization
Library: seaborn 0.13.2 | Python 3.13.13
Quality: 90/100 | Updated: 2026-05-30
"""

import os

import matplotlib.pyplot as plt
import numpy as np
import seaborn as sns
from matplotlib.colors import LinearSegmentedColormap


# Theme tokens
THEME = os.getenv("ANYPLOT_THEME", "light")
PAGE_BG = "#FAF8F1" if THEME == "light" else "#1A1A17"
ELEVATED_BG = "#FFFDF6" if THEME == "light" else "#242420"
INK = "#1A1A17" if THEME == "light" else "#F0EFE8"
INK_SOFT = "#4A4A44" if THEME == "light" else "#B8B7B0"
INK_MUTED = "#6B6A63" if THEME == "light" else "#A8A79F"

# Interior (never-escaping) points: near-black per spec, consistent across themes
INTERIOR_BG = "#0A0A08"

# Imprint sequential colormap — reversed so high iteration count (boundary) glows in brand green
imprint_seq = LinearSegmentedColormap.from_list("imprint_seq", ["#4467A3", "#009E73"])

sns.set_theme(
    style="ticks",
    rc={
        "figure.facecolor": PAGE_BG,
        "axes.facecolor": INTERIOR_BG,
        "axes.edgecolor": INK_SOFT,
        "axes.labelcolor": INK,
        "text.color": INK,
        "xtick.color": INK_SOFT,
        "ytick.color": INK_SOFT,
        "legend.facecolor": ELEVATED_BG,
        "legend.edgecolor": INK_SOFT,
    },
)

# Data — Mandelbrot set with smooth escape-time coloring
x_min, x_max = -2.5, 1.0
y_min, y_max = -1.25, 1.25
grid_w, grid_h = 1000, 714
max_iter = 200
bailout = 256.0  # High bailout eliminates smooth-coloring artifacts

real = np.linspace(x_min, x_max, grid_w)
imag = np.linspace(y_max, y_min, grid_h)
c = real[np.newaxis, :] + 1j * imag[:, np.newaxis]

z = np.zeros_like(c)
escape_iter = np.full(c.shape, np.nan)
escaped = np.zeros(c.shape, dtype=bool)

for i in range(1, max_iter + 1):
    active = ~escaped
    z[active] = z[active] ** 2 + c[active]
    newly_escaped = active & (np.abs(z) > bailout)
    if np.any(newly_escaped):
        escaped[newly_escaped] = True
        abs_z = np.abs(z[newly_escaped])
        escape_iter[newly_escaped] = i + 1.0 - np.log2(np.log2(abs_z))

interior = ~escaped

# Plot
fig, ax = plt.subplots(figsize=(8, 4.5), dpi=400)
fig.set_facecolor(PAGE_BG)

sns.heatmap(
    escape_iter,
    mask=interior,
    cmap=imprint_seq,
    vmin=1,
    vmax=40,
    cbar_kws={"label": "Escape Iterations", "shrink": 0.88, "aspect": 28, "pad": 0.02, "format": "%.0f"},
    xticklabels=False,
    yticklabels=False,
    ax=ax,
)

# Custom axis ticks for complex plane coordinates
n_xticks = 8
n_yticks = 5
ax.set_xticks(np.linspace(0, grid_w, n_xticks))
ax.set_xticklabels([f"{v:.1f}" for v in np.linspace(x_min, x_max, n_xticks)], fontsize=8)
ax.set_yticks(np.linspace(0, grid_h, n_yticks))
ax.set_yticklabels([f"{v:.1f}" for v in np.linspace(y_max, y_min, n_yticks)], fontsize=8)

# Labels and title — title is 50 chars, under the 67-char threshold so no scaling needed
title = "heatmap-mandelbrot · python · seaborn · anyplot.ai"
ax.set_xlabel("Real Axis", fontsize=10, labelpad=10)
ax.set_ylabel("Imaginary Axis", fontsize=10, labelpad=10)
ax.set_title(title, fontsize=12, fontweight="medium", pad=14)

# Colorbar styling
cbar = ax.collections[0].colorbar
cbar.ax.tick_params(labelsize=8, colors=INK_SOFT)
cbar.set_label("Escape Iterations", fontsize=10, labelpad=10, color=INK)
cbar.outline.set_edgecolor(INK_SOFT)
cbar.outline.set_linewidth(0.5)

sns.despine(ax=ax, left=True, bottom=True)

fig.subplots_adjust(left=0.09, right=0.89, top=0.92, bottom=0.11)

# Save — no bbox_inches='tight' (would trim canvas from exact 3200×1800)
plt.savefig(f"plot-{THEME}.png", dpi=400, facecolor=PAGE_BG)
Runnable source as JSON, for any HTTP client: https://api.anyplot.ai/specs/heatmap-mandelbrot/seaborn/code. Any spec id and library id listed in llms-full.txt fit the same URL shape; every URL below is complete and callable.
{
  "spec_id": "heatmap-mandelbrot",
  "language": "python",
  "library": "seaborn",
  "page": "https://anyplot.ai/heatmap-mandelbrot/python/seaborn",
  "hub": "https://anyplot.ai/heatmap-mandelbrot",
  "code_json": "https://api.anyplot.ai/specs/heatmap-mandelbrot/seaborn/code",
  "spec_json": "https://api.anyplot.ai/specs/heatmap-mandelbrot",
  "render_light_png": "https://storage.googleapis.com/anyplot-images/plots/heatmap-mandelbrot/python/seaborn/plot-light.png",
  "render_dark_png": "https://storage.googleapis.com/anyplot-images/plots/heatmap-mandelbrot/python/seaborn/plot-dark.png",
  "quality_score": 90.0,
  "license": "MIT",
  "guide": "https://anyplot.ai/llms.txt"
}
Part of Mandelbrot Set Fractal Visualization on anyplot.ai.