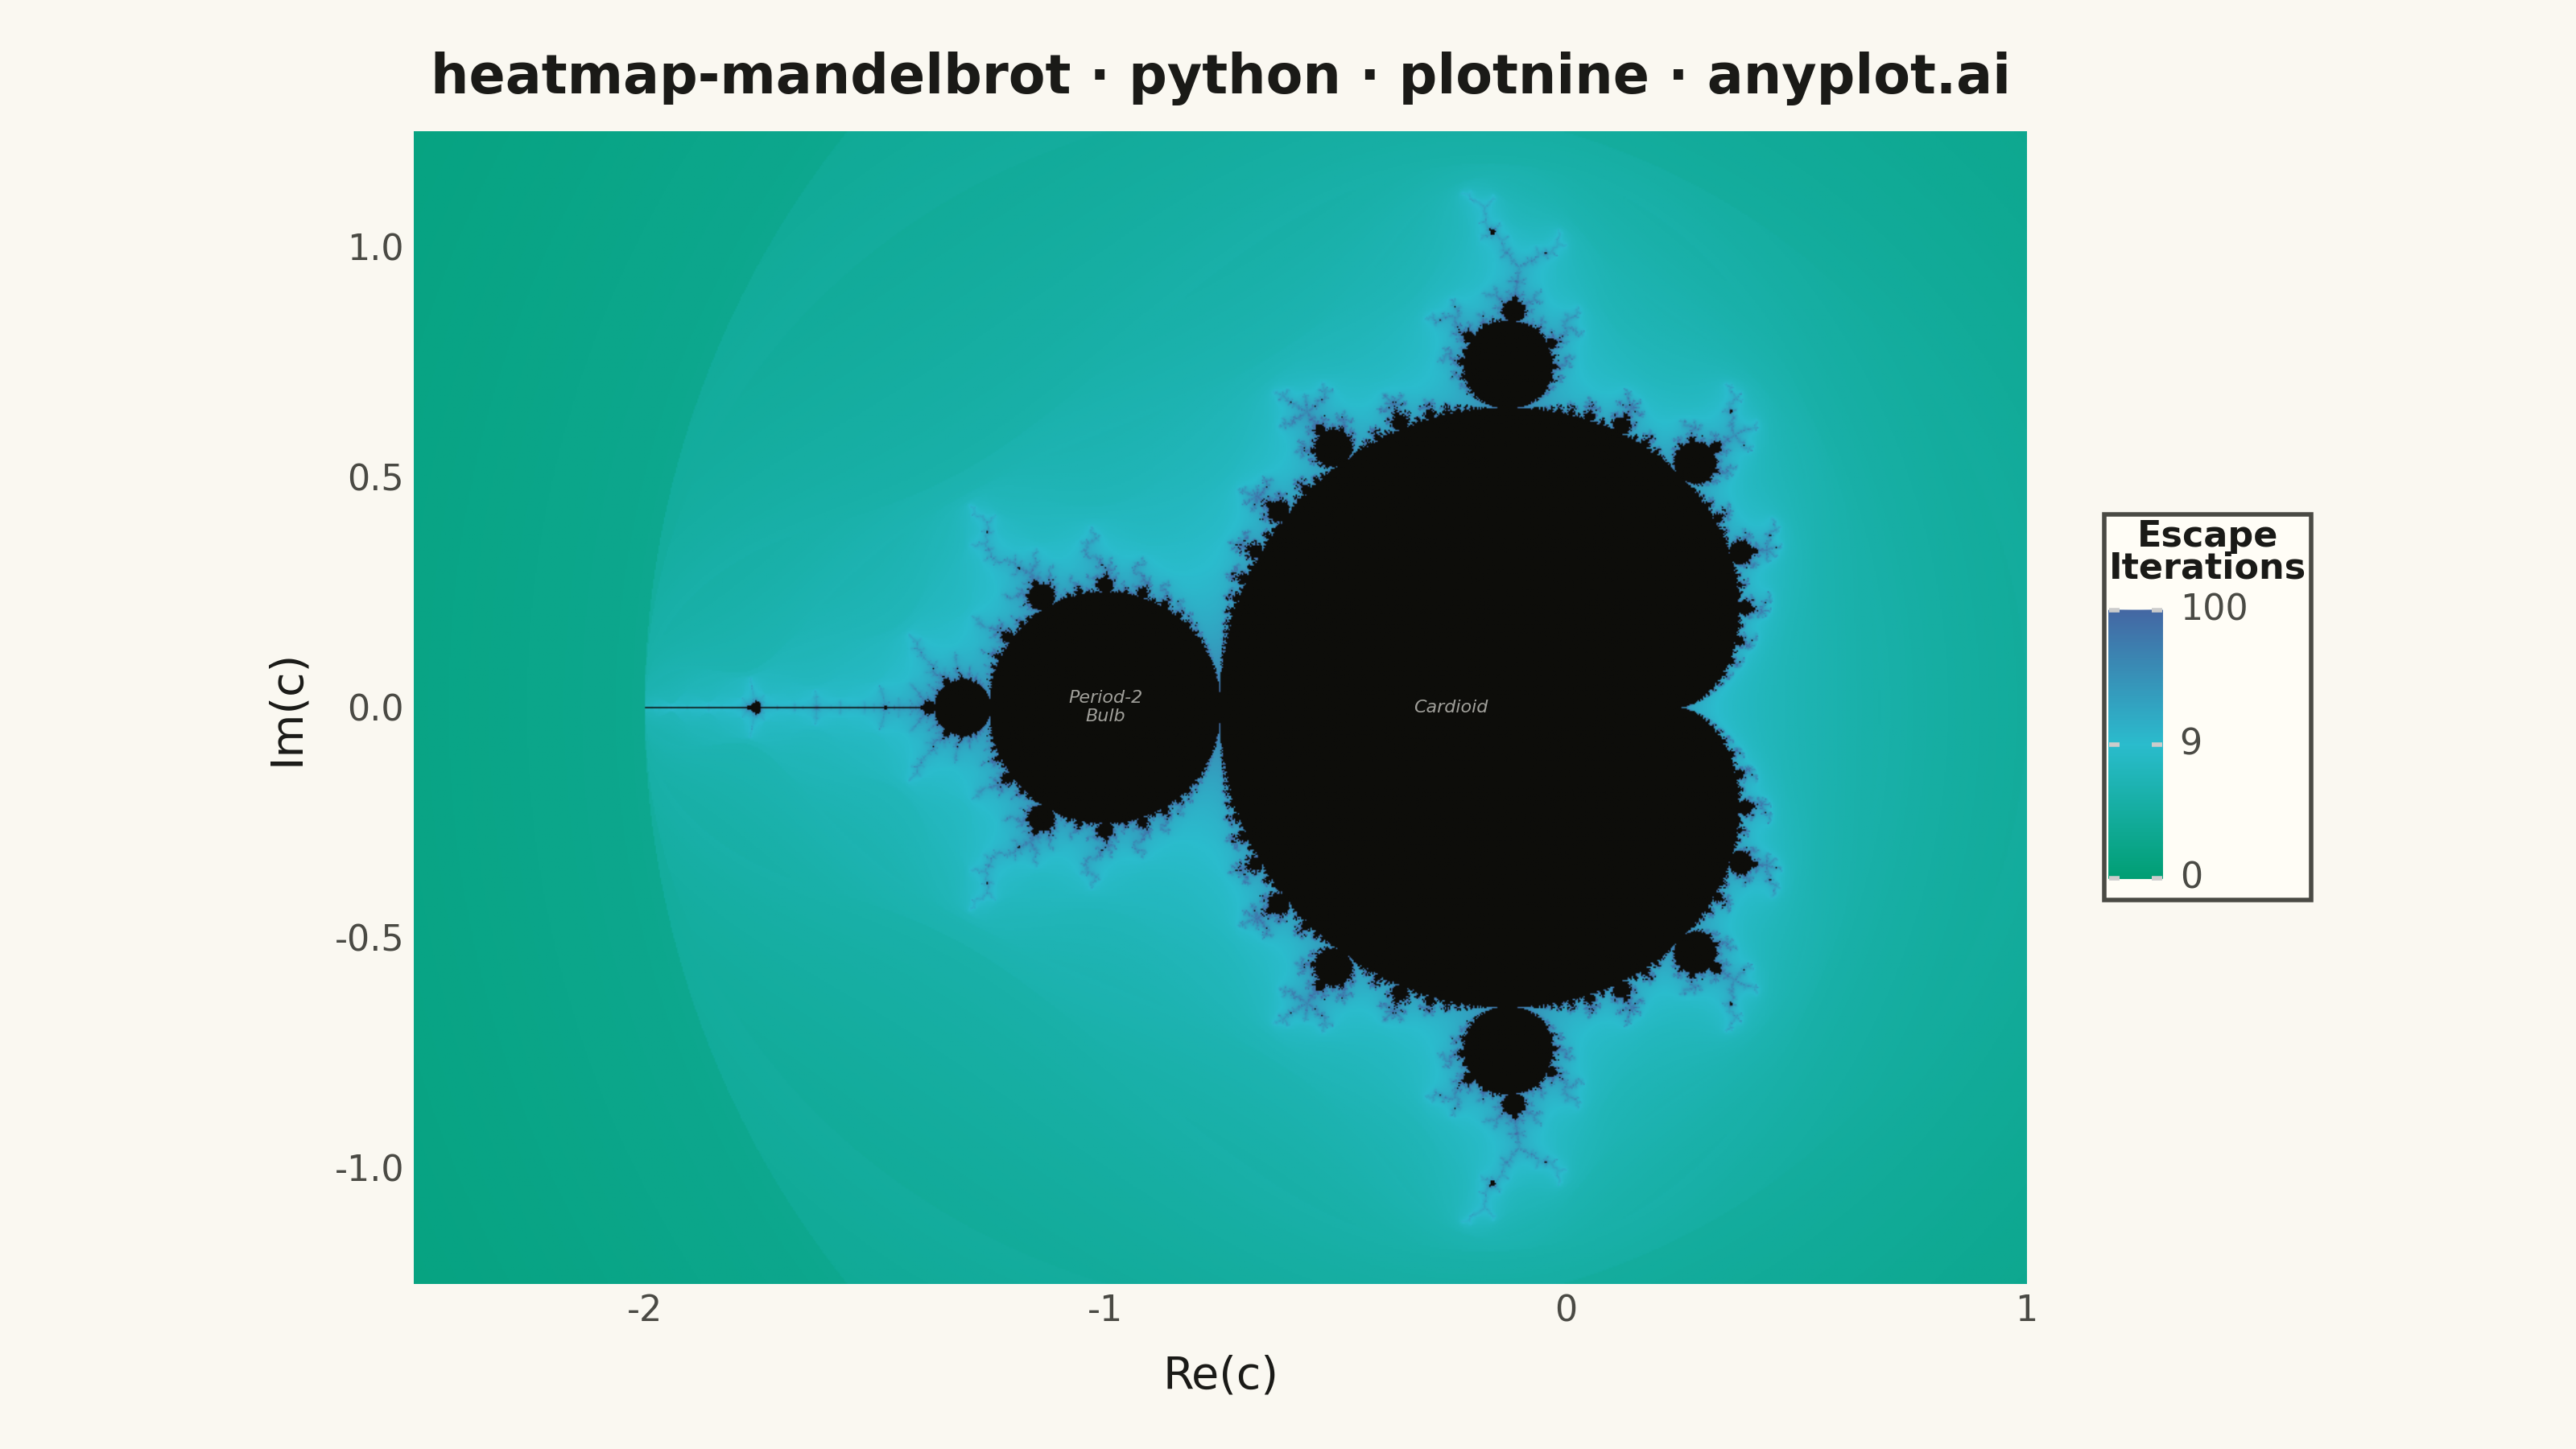
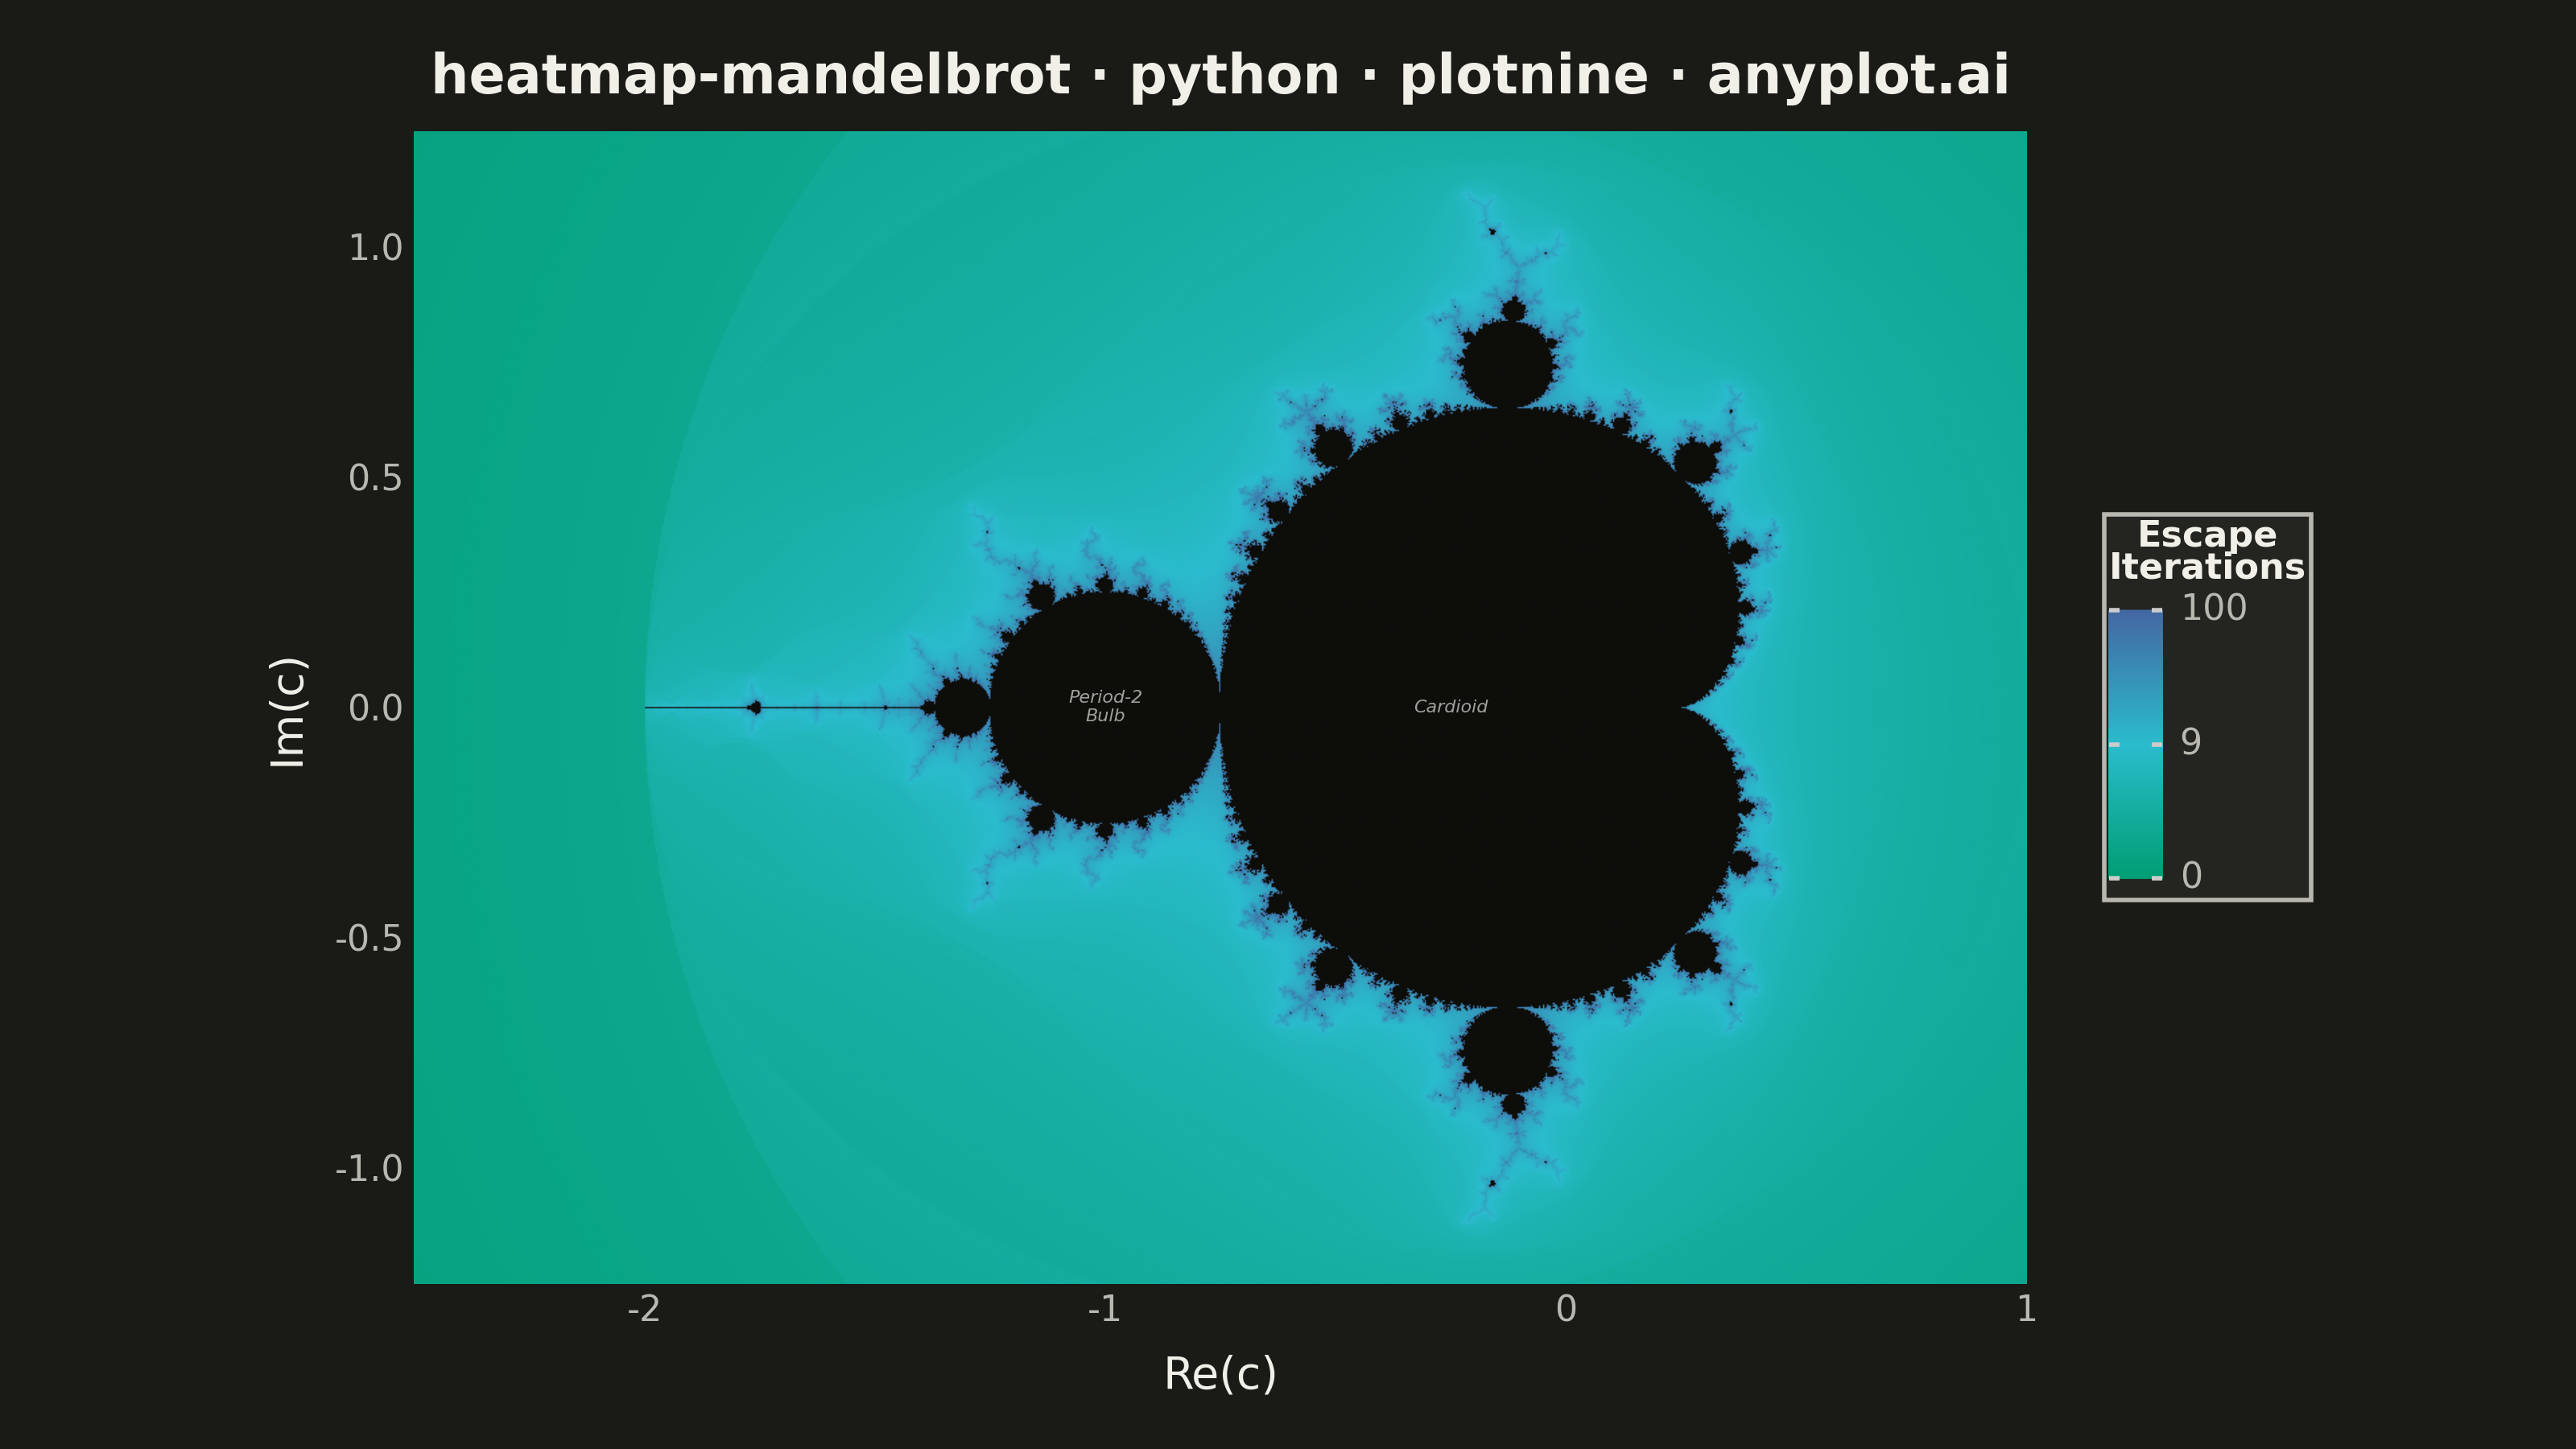
A visualization of the Mandelbrot set, the most iconic fractal in mathematics. Each pixel represents a complex number c on the complex plane, colored by how quickly the iteration z(n+1) = z(n)^2 + c diverges. The boundary between convergent and divergent regions reveals infinitely complex, self-similar structure including the characteristic cardioid and period-2 bulb.
""" anyplot.ai
heatmap-mandelbrot: Mandelbrot Set Fractal Visualization
Library: plotnine 0.15.4 | Python 3.13.13
Quality: 87/100 | Updated: 2026-05-30
"""

import os
import sys


# This script is named plotnine.py which would shadow the installed package.
# Remove the script's directory from sys.path so the library is found instead.
sys.path = [p for p in sys.path if os.path.abspath(p or ".") != os.path.dirname(os.path.abspath(__file__))]

import numpy as np
import pandas as pd
from plotnine import (
    aes,
    annotate,
    coord_fixed,
    element_blank,
    element_rect,
    element_text,
    geom_raster,
    ggplot,
    guide_colorbar,
    guides,
    labs,
    scale_fill_gradientn,
    scale_x_continuous,
    scale_y_continuous,
    theme,
    theme_minimal,
)


# Theme tokens — Imprint palette, theme-adaptive chrome
THEME = os.getenv("ANYPLOT_THEME", "light")
PAGE_BG = "#FAF8F1" if THEME == "light" else "#1A1A17"
ELEVATED_BG = "#FFFDF6" if THEME == "light" else "#242420"
INK = "#1A1A17" if THEME == "light" else "#F0EFE8"
INK_SOFT = "#4A4A44" if THEME == "light" else "#B8B7B0"
INTERIOR_COLOR = "#0D0D0A"  # Mandelbrot interior — near-black regardless of theme
ANNOT_COLOR = "#F0EFE8"  # near-white; annotations always on dark Mandelbrot interior

# Data — Mandelbrot set: z(n+1) = z(n)² + c
x_min, x_max = -2.5, 1.0
y_min, y_max = -1.25, 1.25
max_iter = 100
nx, ny = 1200, 857

real = np.linspace(x_min, x_max, nx)
imag = np.linspace(y_min, y_max, ny)
real_grid, imag_grid = np.meshgrid(real, imag)
c = real_grid + 1j * imag_grid

# Vectorized iteration with smooth escape-time coloring
z = np.zeros_like(c)
escape_time = np.full(c.shape, np.nan, dtype=float)
active = np.ones(c.shape, dtype=bool)

for i in range(max_iter):
    z[active] = z[active] ** 2 + c[active]
    escaped = active & (np.abs(z) > 2)
    escape_time[escaped] = i + 1 - np.log2(np.log2(np.abs(z[escaped])))
    active[escaped] = False

# Interior points (never escape) remain NaN → na_value in scale renders them as INTERIOR_COLOR
escape_time = np.clip(escape_time, 0, max_iter)

# Log-transform escape time so the color gradient spreads across the boundary region.
# Without this, most exterior pixels (escape ≈ 1–5) collapse into a uniform flat green.
escape_log = np.where(np.isnan(escape_time), np.nan, np.log1p(escape_time) / np.log1p(max_iter) * max_iter)

# 3 colorbar breaks evenly spaced in log space → labeled with original iteration counts.
_log_positions = [0.0, 50.0, 100.0]
_orig_iters = [round(np.expm1(v / max_iter * np.log1p(max_iter))) for v in _log_positions]
_break_labels = [str(v) for v in _orig_iters]

# Long-form DataFrame for plotnine grammar of graphics
df = pd.DataFrame({"real": real_grid.ravel(), "imag": imag_grid.ravel(), "escape": escape_log.ravel()})

title = "heatmap-mandelbrot · python · plotnine · anyplot.ai"

# Plot — layered grammar of graphics composition
plot = (
    ggplot(df, aes(x="real", y="imag", fill="escape"))
    + geom_raster(interpolate=True)
    + scale_fill_gradientn(
        colors=["#009E73", "#2ABCCD", "#4467A3"],  # Imprint seq: green → cyan → blue
        limits=(0, max_iter),
        name="Escape\nIterations",
        na_value=INTERIOR_COLOR,
        breaks=_log_positions,
        labels=_break_labels,
    )
    + guides(fill=guide_colorbar(nbin=300))
    + coord_fixed(ratio=1.0)
    + scale_x_continuous(expand=(0, 0))
    + scale_y_continuous(expand=(0, 0))
    + annotate("text", x=-0.25, y=0, label="Cardioid", color=ANNOT_COLOR, size=4, alpha=0.65, fontstyle="italic")
    + annotate(
        "text",
        x=-1.0,
        y=0,
        label="Period-2\nBulb",
        color=ANNOT_COLOR,
        size=4,
        alpha=0.65,
        fontstyle="italic",
        ha="center",
    )
    + labs(x="Re(c)", y="Im(c)", title=title)
    + theme_minimal()
    + theme(
        figure_size=(8, 4.5),
        plot_title=element_text(size=12, weight="bold", ha="center", color=INK),
        axis_title_x=element_text(size=10, color=INK),
        axis_title_y=element_text(size=10, color=INK),
        axis_text=element_text(size=8, color=INK_SOFT),
        axis_ticks=element_blank(),
        legend_title=element_text(size=8, weight="bold", color=INK),
        legend_text=element_text(size=8, color=INK_SOFT),
        legend_background=element_rect(fill=ELEVATED_BG, color=INK_SOFT),
        legend_position="right",
        legend_key_height=60,
        legend_key_width=12,
        panel_grid_major=element_blank(),
        panel_grid_minor=element_blank(),
        panel_background=element_rect(fill=INTERIOR_COLOR),
        plot_background=element_rect(fill=PAGE_BG, color=PAGE_BG),
        plot_margin=0.02,
    )
)

# Save
plot.save(f"plot-{THEME}.png", dpi=400, width=8, height=4.5, units="in", verbose=False)
Runnable source as JSON, for any HTTP client: https://api.anyplot.ai/specs/heatmap-mandelbrot/plotnine/code. Any spec id and library id listed in llms-full.txt fit the same URL shape; every URL below is complete and callable.
{
  "spec_id": "heatmap-mandelbrot",
  "language": "python",
  "library": "plotnine",
  "page": "https://anyplot.ai/heatmap-mandelbrot/python/plotnine",
  "hub": "https://anyplot.ai/heatmap-mandelbrot",
  "code_json": "https://api.anyplot.ai/specs/heatmap-mandelbrot/plotnine/code",
  "spec_json": "https://api.anyplot.ai/specs/heatmap-mandelbrot",
  "render_light_png": "https://storage.googleapis.com/anyplot-images/plots/heatmap-mandelbrot/python/plotnine/plot-light.png",
  "render_dark_png": "https://storage.googleapis.com/anyplot-images/plots/heatmap-mandelbrot/python/plotnine/plot-dark.png",
  "quality_score": 87.0,
  "license": "MIT",
  "guide": "https://anyplot.ai/llms.txt"
}
Part of Mandelbrot Set Fractal Visualization on anyplot.ai.