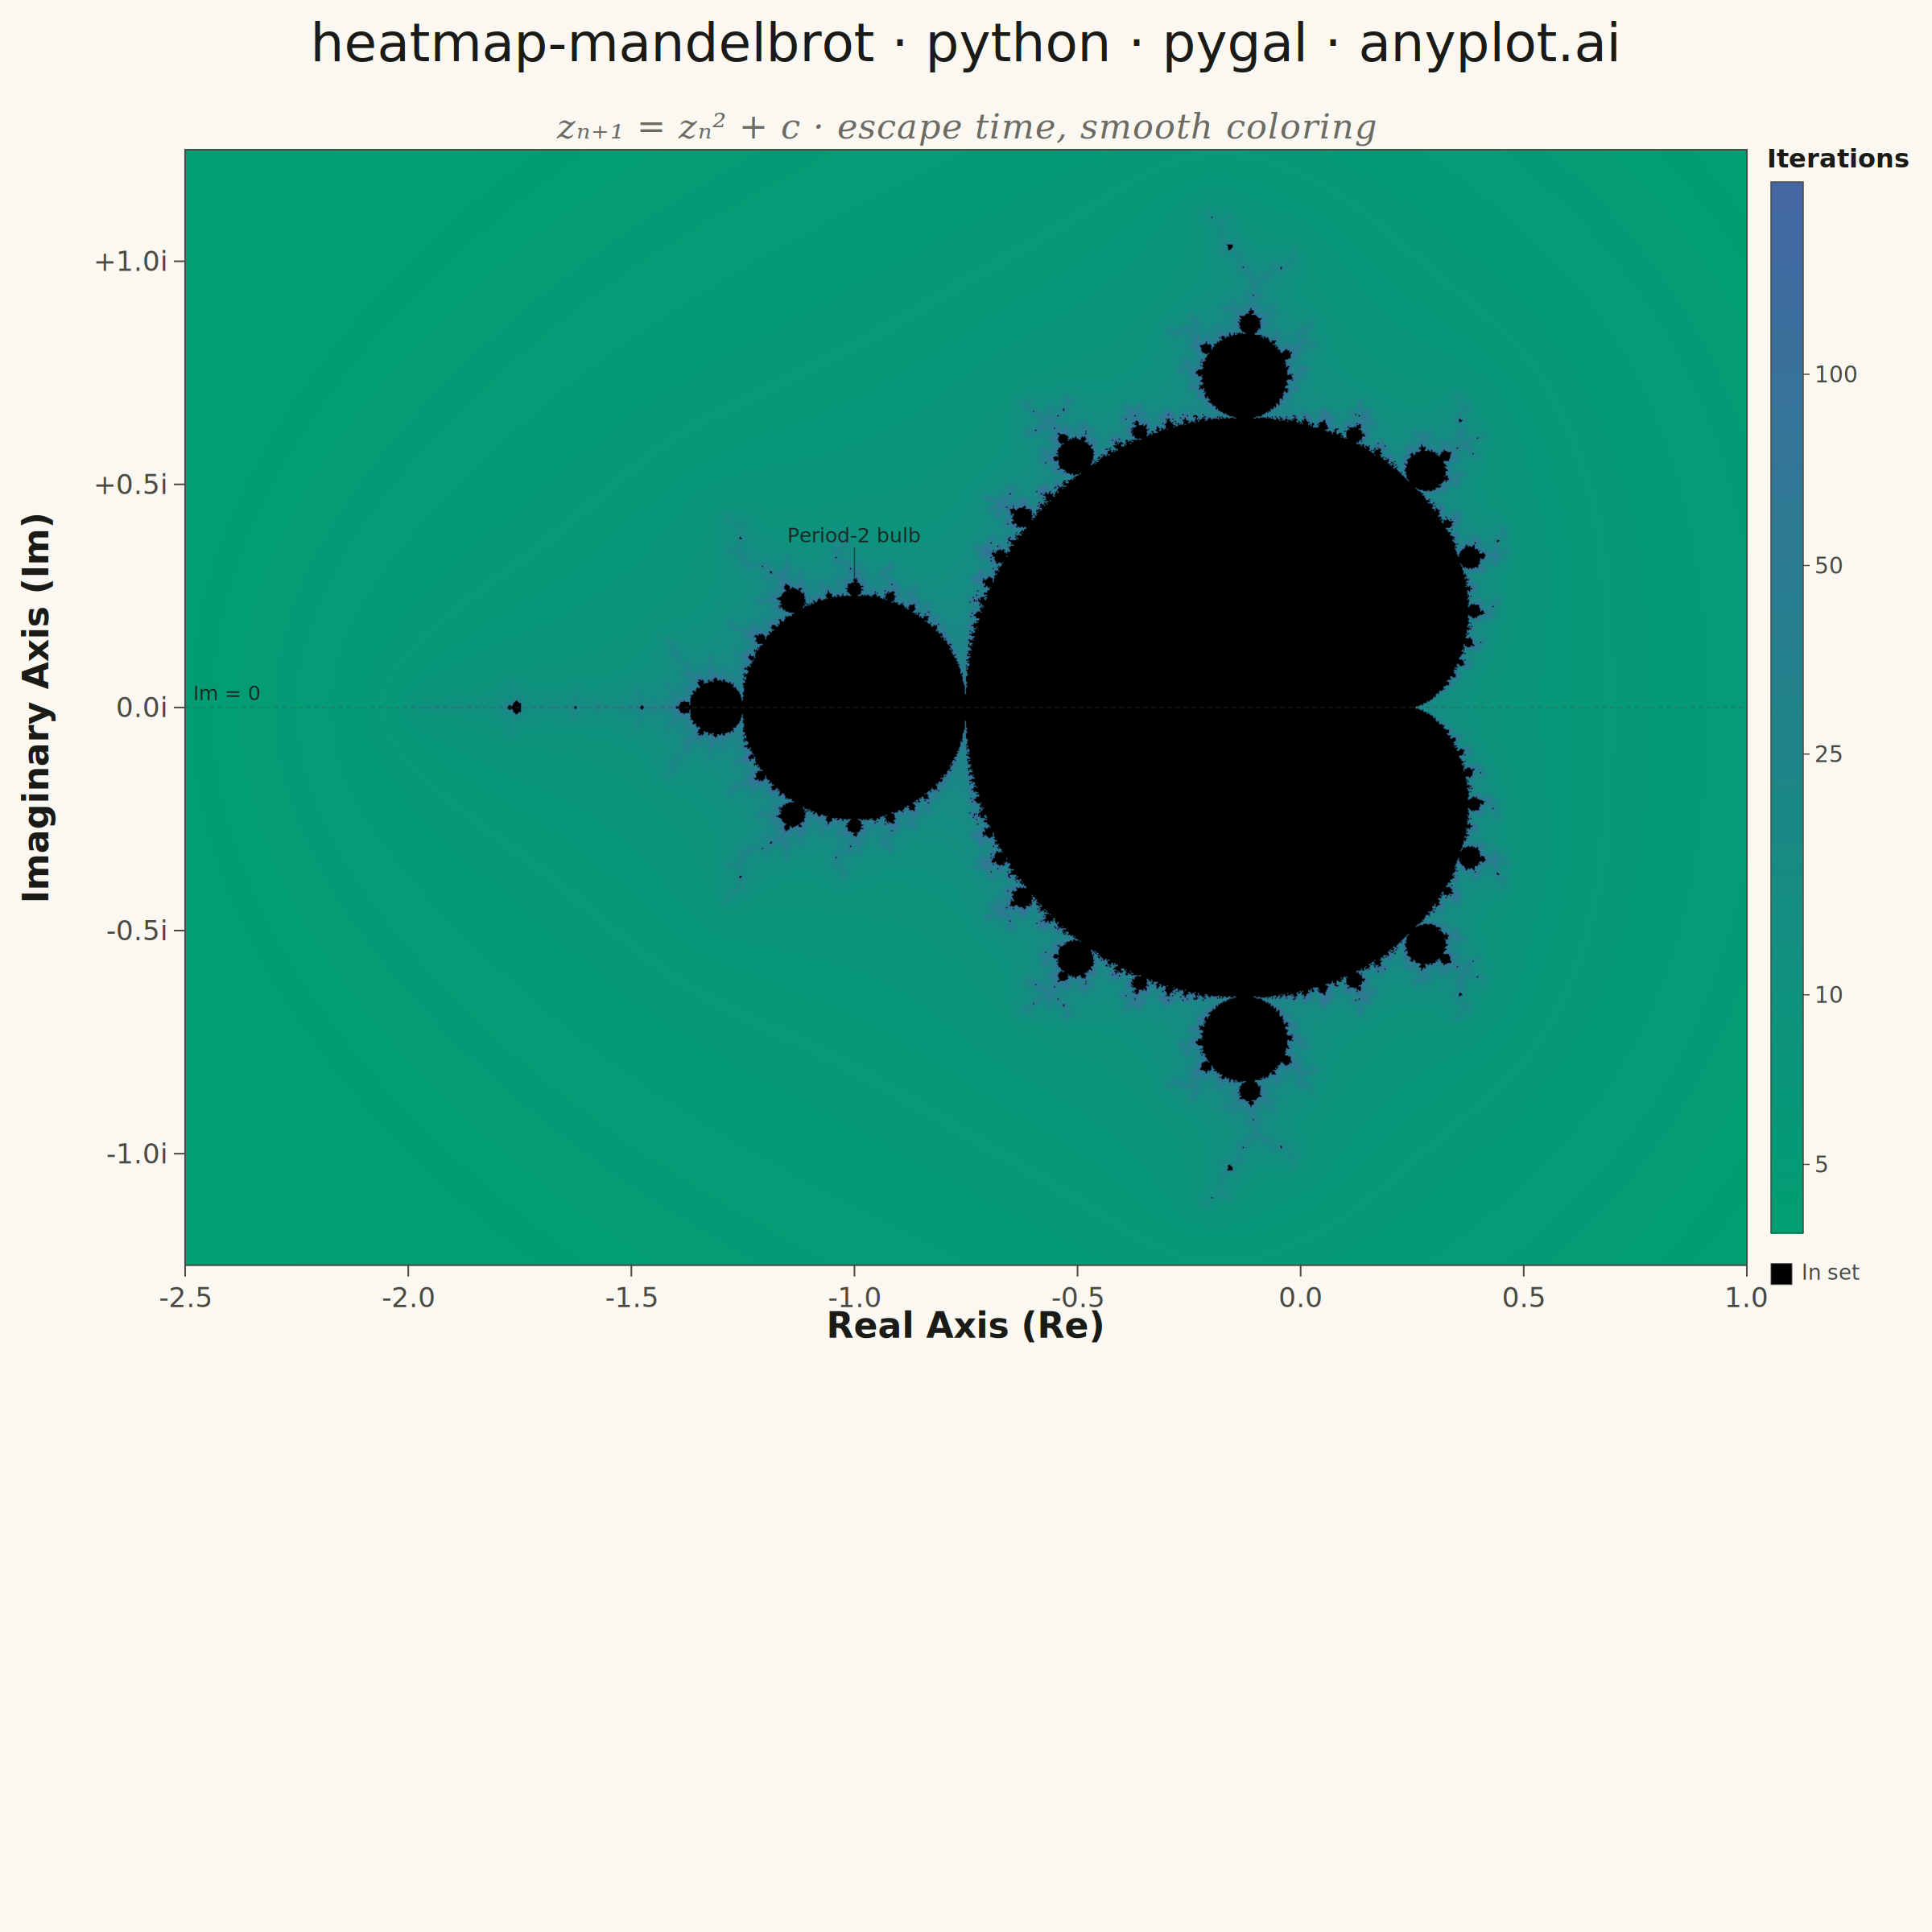
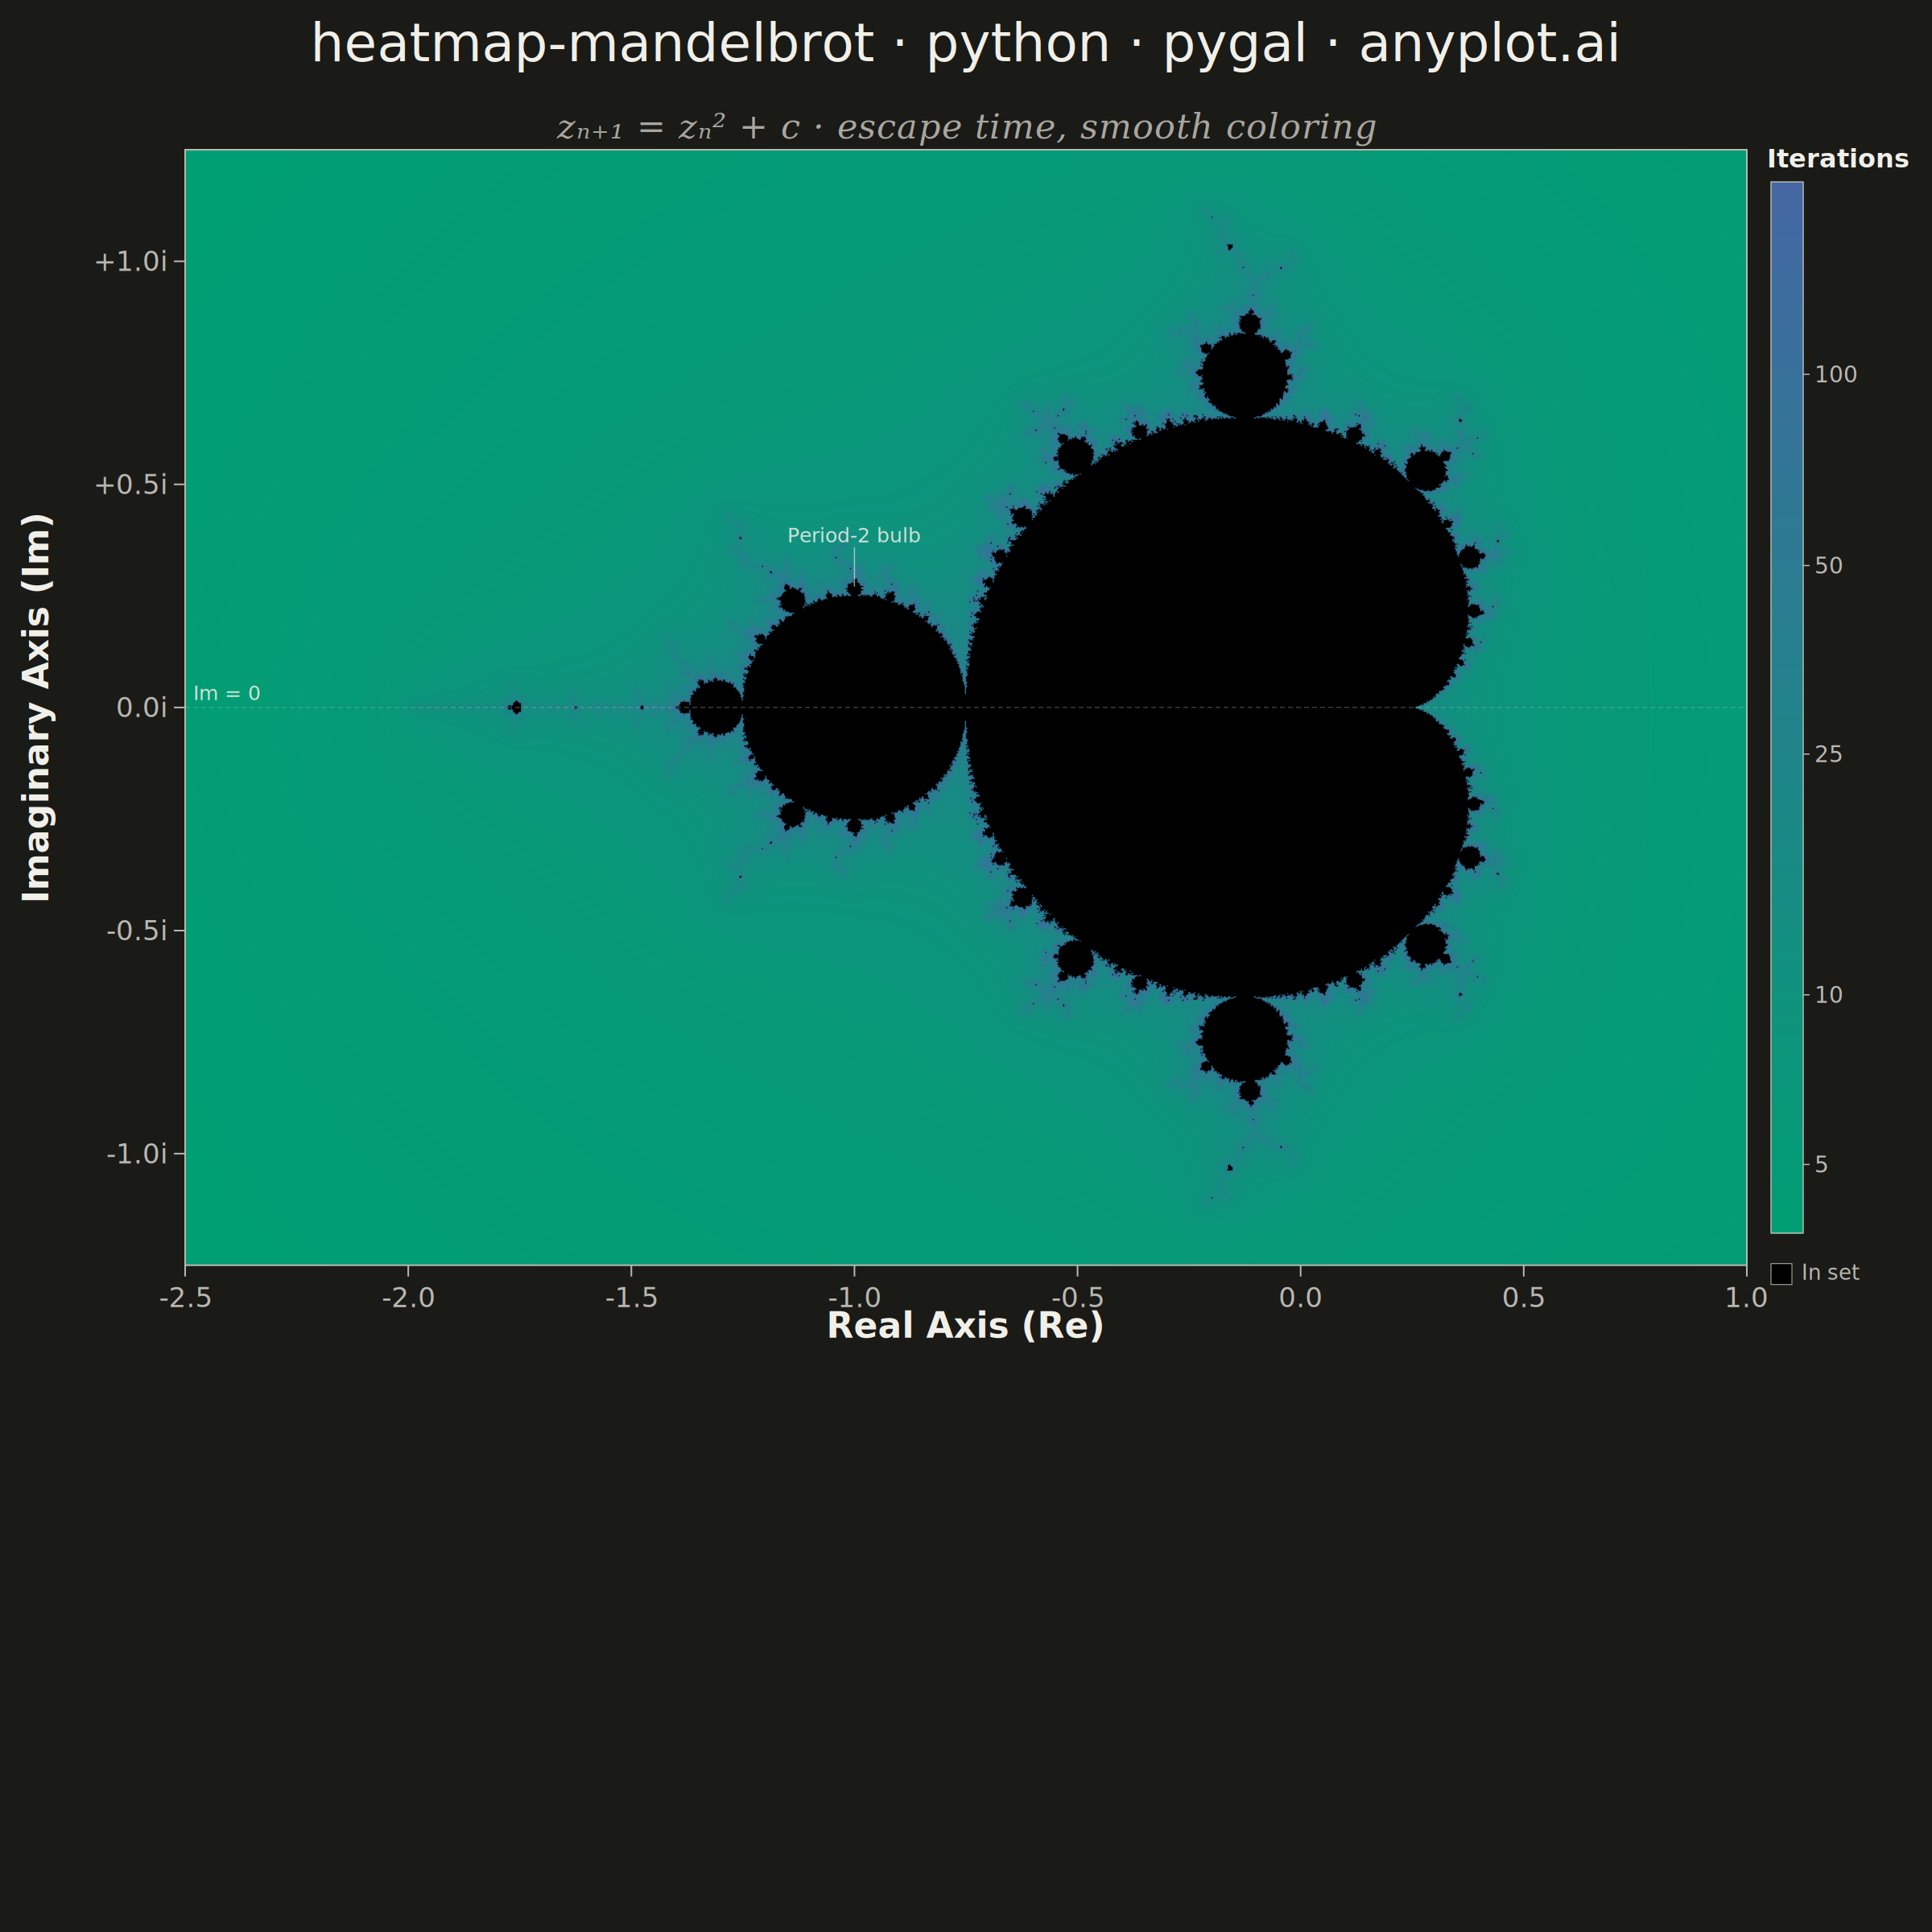
A visualization of the Mandelbrot set, the most iconic fractal in mathematics. Each pixel represents a complex number c on the complex plane, colored by how quickly the iteration z(n+1) = z(n)^2 + c diverges. The boundary between convergent and divergent regions reveals infinitely complex, self-similar structure including the characteristic cardioid and period-2 bulb.
""" anyplot.ai
heatmap-mandelbrot: Mandelbrot Set Fractal Visualization
Library: pygal 3.1.0 | Python 3.13.13
Quality: 91/100 | Updated: 2026-05-30
"""

import base64
import os
import sys
from io import BytesIO
from pathlib import Path


sys.path = [p for p in sys.path if p != str(Path(__file__).parent)]

import numpy as np
from PIL import Image
from pygal.graph.graph import Graph
from pygal.style import Style


# Theme tokens — Imprint palette, theme-adaptive chrome
THEME = os.getenv("ANYPLOT_THEME", "light")
PAGE_BG = "#FAF8F1" if THEME == "light" else "#1A1A17"
INK = "#1A1A17" if THEME == "light" else "#F0EFE8"
INK_SOFT = "#4A4A44" if THEME == "light" else "#B8B7B0"
INK_MUTED = "#6B6A63" if THEME == "light" else "#A8A79F"

# Imprint sequential colormap: brand green (#009E73) → blue (#4467A3)
_SEQ_START = (0, 158, 115)  # #009E73
_SEQ_END = (68, 103, 163)  # #4467A3

# Data — Mandelbrot set on the complex plane
x_min, x_max = -2.5, 1.0
y_min, y_max = -1.25, 1.25
max_iter = 200
bailout = 256
grid_w, grid_h = 1400, 1000

real = np.linspace(x_min, x_max, grid_w)
imag = np.linspace(y_max, y_min, grid_h)
c = real[np.newaxis, :] + 1j * imag[:, np.newaxis]

z = np.zeros_like(c)
escape_iter = np.full(c.shape, max_iter, dtype=np.float64)
mask = np.ones(c.shape, dtype=bool)

for i in range(max_iter):
    z[mask] = z[mask] ** 2 + c[mask]
    escaped = mask & (np.abs(z) > bailout)
    log_zn = np.log(np.abs(z[escaped]))
    nu = np.log(log_zn / np.log(bailout)) / np.log(2)
    escape_iter[escaped] = i + 1 - nu
    mask[escaped] = False

exterior = escape_iter < max_iter

# Imprint sequential LUT: #009E73 → #4467A3 (1024 stops)
lut_size = 1024
t_vals = np.linspace(0, 1, lut_size)
lut = np.zeros((lut_size, 3), dtype=np.uint8)
for ch, (s, e) in enumerate(zip(_SEQ_START, _SEQ_END, strict=True)):
    lut[:, ch] = np.round(s + (e - s) * t_vals).astype(np.uint8)

# Log-normalized color mapping (exterior = Imprint seq; interior = black)
cell_colors = np.zeros((*c.shape, 3), dtype=np.uint8)
log_min, log_max = 0.0, 1.0
if np.any(exterior):
    iter_vals = escape_iter[exterior]
    log_vals = np.log(iter_vals + 1)
    log_min, log_max = log_vals.min(), log_vals.max()
    span = log_max - log_min
    normalized = (log_vals - log_min) / span if span > 0 else np.zeros_like(log_vals)
    indices = np.clip((normalized * (lut_size - 1)).astype(int), 0, lut_size - 1)
    cell_colors[exterior] = lut[indices]

# Encode heatmap as PNG data URI for SVG embedding
heatmap_img = Image.fromarray(cell_colors)
buf = BytesIO()
heatmap_img.save(buf, format="PNG")
heatmap_data_uri = "data:image/png;base64," + base64.b64encode(buf.getvalue()).decode()

# Title — 48 chars < 67 baseline, no scaling needed
title_str = "heatmap-mandelbrot · python · pygal · anyplot.ai"
title_fontsize = round(66 * 67 / len(title_str)) if len(title_str) > 67 else 66


# Module-level function holds all SVG generation logic — keeps class minimal
def _draw_heatmap_overlay(self):
    gw = self.view.width
    gh = self.view.height

    pad_left, pad_top = 200, 80
    pad_right, pad_bottom = 200, 100
    x_span = self._x_range[1] - self._x_range[0]
    y_span = self._y_range[1] - self._y_range[0]

    avail_w = gw - pad_left - pad_right
    avail_h = gh - pad_top - pad_bottom
    if avail_w / avail_h > x_span / y_span:
        plot_h = avail_h
        plot_w = plot_h * x_span / y_span
    else:
        plot_w = avail_w
        plot_h = plot_w * y_span / x_span

    px, py = pad_left, pad_top
    root = self.svg.node(self.nodes["plot"], class_="mandelbrot-heatmap")

    # Embedded heatmap image
    ns = "http://www.w3.org/1999/xlink"
    img = self.svg.node(root, "image", x=px, y=py, width=plot_w, height=plot_h)
    img.attrib["{%s}href" % ns] = self._heatmap_uri
    img.attrib["preserveAspectRatio"] = "none"

    # Plot border
    self.svg.node(
        root, "rect", x=px, y=py, width=plot_w, height=plot_h, style=f"fill:none;stroke:{INK_SOFT};stroke-width:2"
    )

    # Subtitle — mathematical formula in italic serif, sized to match axis titles
    sub = self.svg.node(
        root,
        "text",
        x=px + plot_w / 2,
        y=py - 14,
        style=(
            f"font-size:43px;font-style:italic;font-weight:300;"
            f"font-family:'Georgia',serif;fill:{INK_MUTED};letter-spacing:1px"
        ),
    )
    sub.text = "zₙ₊₁ = zₙ² + c · escape time, smooth coloring"
    sub.attrib["text-anchor"] = "middle"

    # Reference hairline at Im=0 — marks the real axis
    im0_frac = (self._y_range[1] - 0.0) / y_span
    im0_y = py + im0_frac * plot_h
    self.svg.node(
        root,
        "line",
        x1=px,
        y1=im0_y,
        x2=px + plot_w,
        y2=im0_y,
        style=f"stroke:{INK_SOFT};stroke-width:1;stroke-dasharray:6,4;opacity:0.5",
    )
    im0_lbl = self.svg.node(
        root, "text", x=px + 10, y=im0_y - 9, style=f"font-size:25px;font-family:sans-serif;fill:{INK};opacity:0.85"
    )
    im0_lbl.text = "Im = 0"

    # Period-2 bulb label — placed in colored exterior above the bulb (Im ≈ 0.37)
    # so the label uses INK against green and is readable in both themes
    p2_re = -1.0
    ann_im = 0.37  # exterior above the bulb top (~Im 0.25)
    ann_frac_x = (p2_re - self._x_range[0]) / x_span
    ann_frac_y = (self._y_range[1] - ann_im) / y_span
    ann_cx = px + ann_frac_x * plot_w
    ann_cy = py + ann_frac_y * plot_h
    bulb_top_im = 0.26
    bulb_top_frac_y = (self._y_range[1] - bulb_top_im) / y_span
    bulb_top_y = py + bulb_top_frac_y * plot_h
    self.svg.node(
        root,
        "line",
        x1=ann_cx,
        y1=ann_cy + 6,
        x2=ann_cx,
        y2=bulb_top_y - 6,
        style=f"stroke:{INK};stroke-width:1.5;opacity:0.6",
    )
    ann = self.svg.node(
        root, "text", x=ann_cx, y=ann_cy, style=f"font-size:25px;font-family:sans-serif;fill:{INK};opacity:0.85"
    )
    ann.text = "Period-2 bulb"
    ann.attrib["text-anchor"] = "middle"

    # X-axis ticks and labels
    for val in [-2.5, -2.0, -1.5, -1.0, -0.5, 0.0, 0.5, 1.0]:
        frac = (val - self._x_range[0]) / x_span
        tx = px + frac * plot_w
        ty = py + plot_h
        self.svg.node(root, "line", x1=tx, y1=ty, x2=tx, y2=ty + 14, style=f"stroke:{INK_SOFT};stroke-width:2")
        lbl = self.svg.node(
            root, "text", x=tx, y=ty + 52, style=f"font-size:34px;font-family:sans-serif;fill:{INK_SOFT}"
        )
        lbl.text = f"{val:.1f}"
        lbl.attrib["text-anchor"] = "middle"

    # X-axis title
    xl = self.svg.node(
        root,
        "text",
        x=px + plot_w / 2,
        y=py + plot_h + 90,
        style=f"font-size:44px;font-weight:600;font-family:sans-serif;fill:{INK}",
    )
    xl.text = "Real Axis (Re)"
    xl.attrib["text-anchor"] = "middle"

    # Y-axis ticks and labels
    for val in [-1.0, -0.5, 0.0, 0.5, 1.0]:
        frac = (self._y_range[1] - val) / y_span
        ty = py + frac * plot_h
        self.svg.node(root, "line", x1=px - 14, y1=ty, x2=px, y2=ty, style=f"stroke:{INK_SOFT};stroke-width:2")
        label = f"{val:+.1f}i" if val != 0 else "0.0i"
        lbl = self.svg.node(
            root, "text", x=px - 24, y=ty + 12, style=f"font-size:34px;font-family:sans-serif;fill:{INK_SOFT}"
        )
        lbl.text = label
        lbl.attrib["text-anchor"] = "end"

    # Y-axis title (rotated)
    ylx = px - 170
    yly = py + plot_h / 2
    yl = self.svg.node(
        root, "text", x=ylx, y=yly, style=f"font-size:44px;font-weight:600;font-family:sans-serif;fill:{INK}"
    )
    yl.text = "Imaginary Axis (Im)"
    yl.attrib["text-anchor"] = "middle"
    yl.attrib["transform"] = f"rotate(-90, {ylx}, {yly})"

    # Colorbar gradient
    cb_x = px + plot_w + 30
    cb_w = 40
    cb_top = py + 40
    cb_h = plot_h - 80
    n_seg = 100

    for s in range(n_seg):
        t = 1.0 - s / (n_seg - 1)
        ci = min(int(t * (self._lut_sz - 1)), self._lut_sz - 1)
        r, g, b = self._colorbar_lut[ci]
        sy = cb_top + s * cb_h / n_seg
        self.svg.node(
            root,
            "rect",
            x=cb_x,
            y=sy,
            width=cb_w,
            height=cb_h / n_seg + 1,
            style=f"fill:#{r:02x}{g:02x}{b:02x};stroke:none",
        )

    self.svg.node(
        root, "rect", x=cb_x, y=cb_top, width=cb_w, height=cb_h, style=f"fill:none;stroke:{INK_SOFT};stroke-width:1.5"
    )

    # Colorbar tick labels
    log_span = self._log_range[1] - self._log_range[0]
    for iter_val in [1, 5, 10, 25, 50, 100, 200]:
        log_val = np.log(iter_val + 1)
        if log_val < self._log_range[0] or log_val > self._log_range[1]:
            continue
        t_c = (log_val - self._log_range[0]) / log_span if log_span > 0 else 0
        frac = 1.0 - t_c
        ty = cb_top + frac * cb_h
        self.svg.node(
            root, "line", x1=cb_x + cb_w, y1=ty, x2=cb_x + cb_w + 8, y2=ty, style=f"stroke:{INK_SOFT};stroke-width:1.5"
        )
        lbl = self.svg.node(
            root, "text", x=cb_x + cb_w + 14, y=ty + 10, style=f"font-size:28px;font-family:sans-serif;fill:{INK_SOFT}"
        )
        lbl.text = str(iter_val)

    # Colorbar title
    cbt = self.svg.node(
        root,
        "text",
        x=cb_x - 5,
        y=cb_top - 18,
        style=f"font-size:32px;font-weight:600;font-family:sans-serif;fill:{INK}",
    )
    cbt.text = "Iterations"
    cbt.attrib["text-anchor"] = "start"

    # In-set legend
    lg_y = cb_top + cb_h + 38
    self.svg.node(
        root, "rect", x=cb_x, y=lg_y, width=26, height=26, style=f"fill:#000000;stroke:{INK_SOFT};stroke-width:1"
    )
    lg = self.svg.node(
        root, "text", x=cb_x + 38, y=lg_y + 20, style=f"font-size:26px;font-family:sans-serif;fill:{INK_SOFT}"
    )
    lg.text = "In set"


# Minimal pygal Graph subclass — routing stubs only, logic lives in _draw_heatmap_overlay
class _HeatmapGraph(Graph):
    _adapters = []
    _compute = _compute_x_labels = _compute_y_labels = _compute_x_labels_major = _compute_y_labels_major = lambda self: (
        None
    )
    _plot = _draw_heatmap_overlay


# Pygal Style — theme-adaptive Imprint palette
custom_style = Style(
    background=PAGE_BG,
    plot_background=PAGE_BG,
    foreground=INK,
    foreground_strong=INK,
    foreground_subtle=INK_MUTED,
    colors=("#009E73",),
    title_font_size=title_fontsize,
    title_font_family="sans-serif",
    label_font_size=44,
    major_label_font_size=44,
    legend_font_size=44,
    value_font_size=36,
)

# Create chart using pygal's rendering pipeline
chart = _HeatmapGraph(
    width=2400,
    height=2400,
    style=custom_style,
    title=title_str,
    show_legend=False,
    show_x_guides=False,
    show_y_guides=False,
    print_values=False,
    margin=30,
    spacing=10,
)

# Bind heatmap data to chart instance (avoids __init__ override)
chart._heatmap_uri = heatmap_data_uri
chart._x_range = (x_min, x_max)
chart._y_range = (y_min, y_max)
chart._colorbar_lut = lut
chart._log_range = (log_min, log_max)
chart._lut_sz = lut_size

chart.add("In set", [1])

# Save PNG and interactive HTML (both theme-suffixed)
chart.render_to_png(f"plot-{THEME}.png")

svg_content = chart.render().decode("utf-8")
html_content = f"""<!DOCTYPE html>
<html>
<head>
    <meta charset="utf-8">
    <title>heatmap-mandelbrot · python · pygal · anyplot.ai</title>
    <style>
        body {{ margin: 0; display: flex; justify-content: center; align-items: center;
               min-height: 100vh; background: {PAGE_BG}; }}
        .chart {{ max-width: 100%; height: auto; }}
    </style>
</head>
<body>
    <figure class="chart">
        {svg_content}
    </figure>
</body>
</html>
"""

with open(f"plot-{THEME}.html", "w", encoding="utf-8") as f:
    f.write(html_content)
Runnable source as JSON, for any HTTP client: https://api.anyplot.ai/specs/heatmap-mandelbrot/pygal/code. Any spec id and library id listed in llms-full.txt fit the same URL shape; every URL below is complete and callable.
{
  "spec_id": "heatmap-mandelbrot",
  "language": "python",
  "library": "pygal",
  "page": "https://anyplot.ai/heatmap-mandelbrot/python/pygal",
  "hub": "https://anyplot.ai/heatmap-mandelbrot",
  "code_json": "https://api.anyplot.ai/specs/heatmap-mandelbrot/pygal/code",
  "spec_json": "https://api.anyplot.ai/specs/heatmap-mandelbrot",
  "render_light_png": "https://storage.googleapis.com/anyplot-images/plots/heatmap-mandelbrot/python/pygal/plot-light.png",
  "render_dark_png": "https://storage.googleapis.com/anyplot-images/plots/heatmap-mandelbrot/python/pygal/plot-dark.png",
  "interactive_light_html": "https://storage.googleapis.com/anyplot-images/plots/heatmap-mandelbrot/python/pygal/plot-light.html",
  "interactive_dark_html": "https://storage.googleapis.com/anyplot-images/plots/heatmap-mandelbrot/python/pygal/plot-dark.html",
  "quality_score": 91.0,
  "license": "MIT",
  "guide": "https://anyplot.ai/llms.txt"
}
Part of Mandelbrot Set Fractal Visualization on anyplot.ai.