The same plot in 14 other libraries — JavaScript: Chart.js, D3.js, Apache ECharts, Highcharts; Python: Altair, Bokeh, lets-plot, Matplotlib, Plotly, plotnine, Pygal, Seaborn; R: ggplot2; Julia: Makie.jl. Compare all 15 side by side: Mandelbrot Set Fractal Visualization in Python, R, Julia and JavaScript.
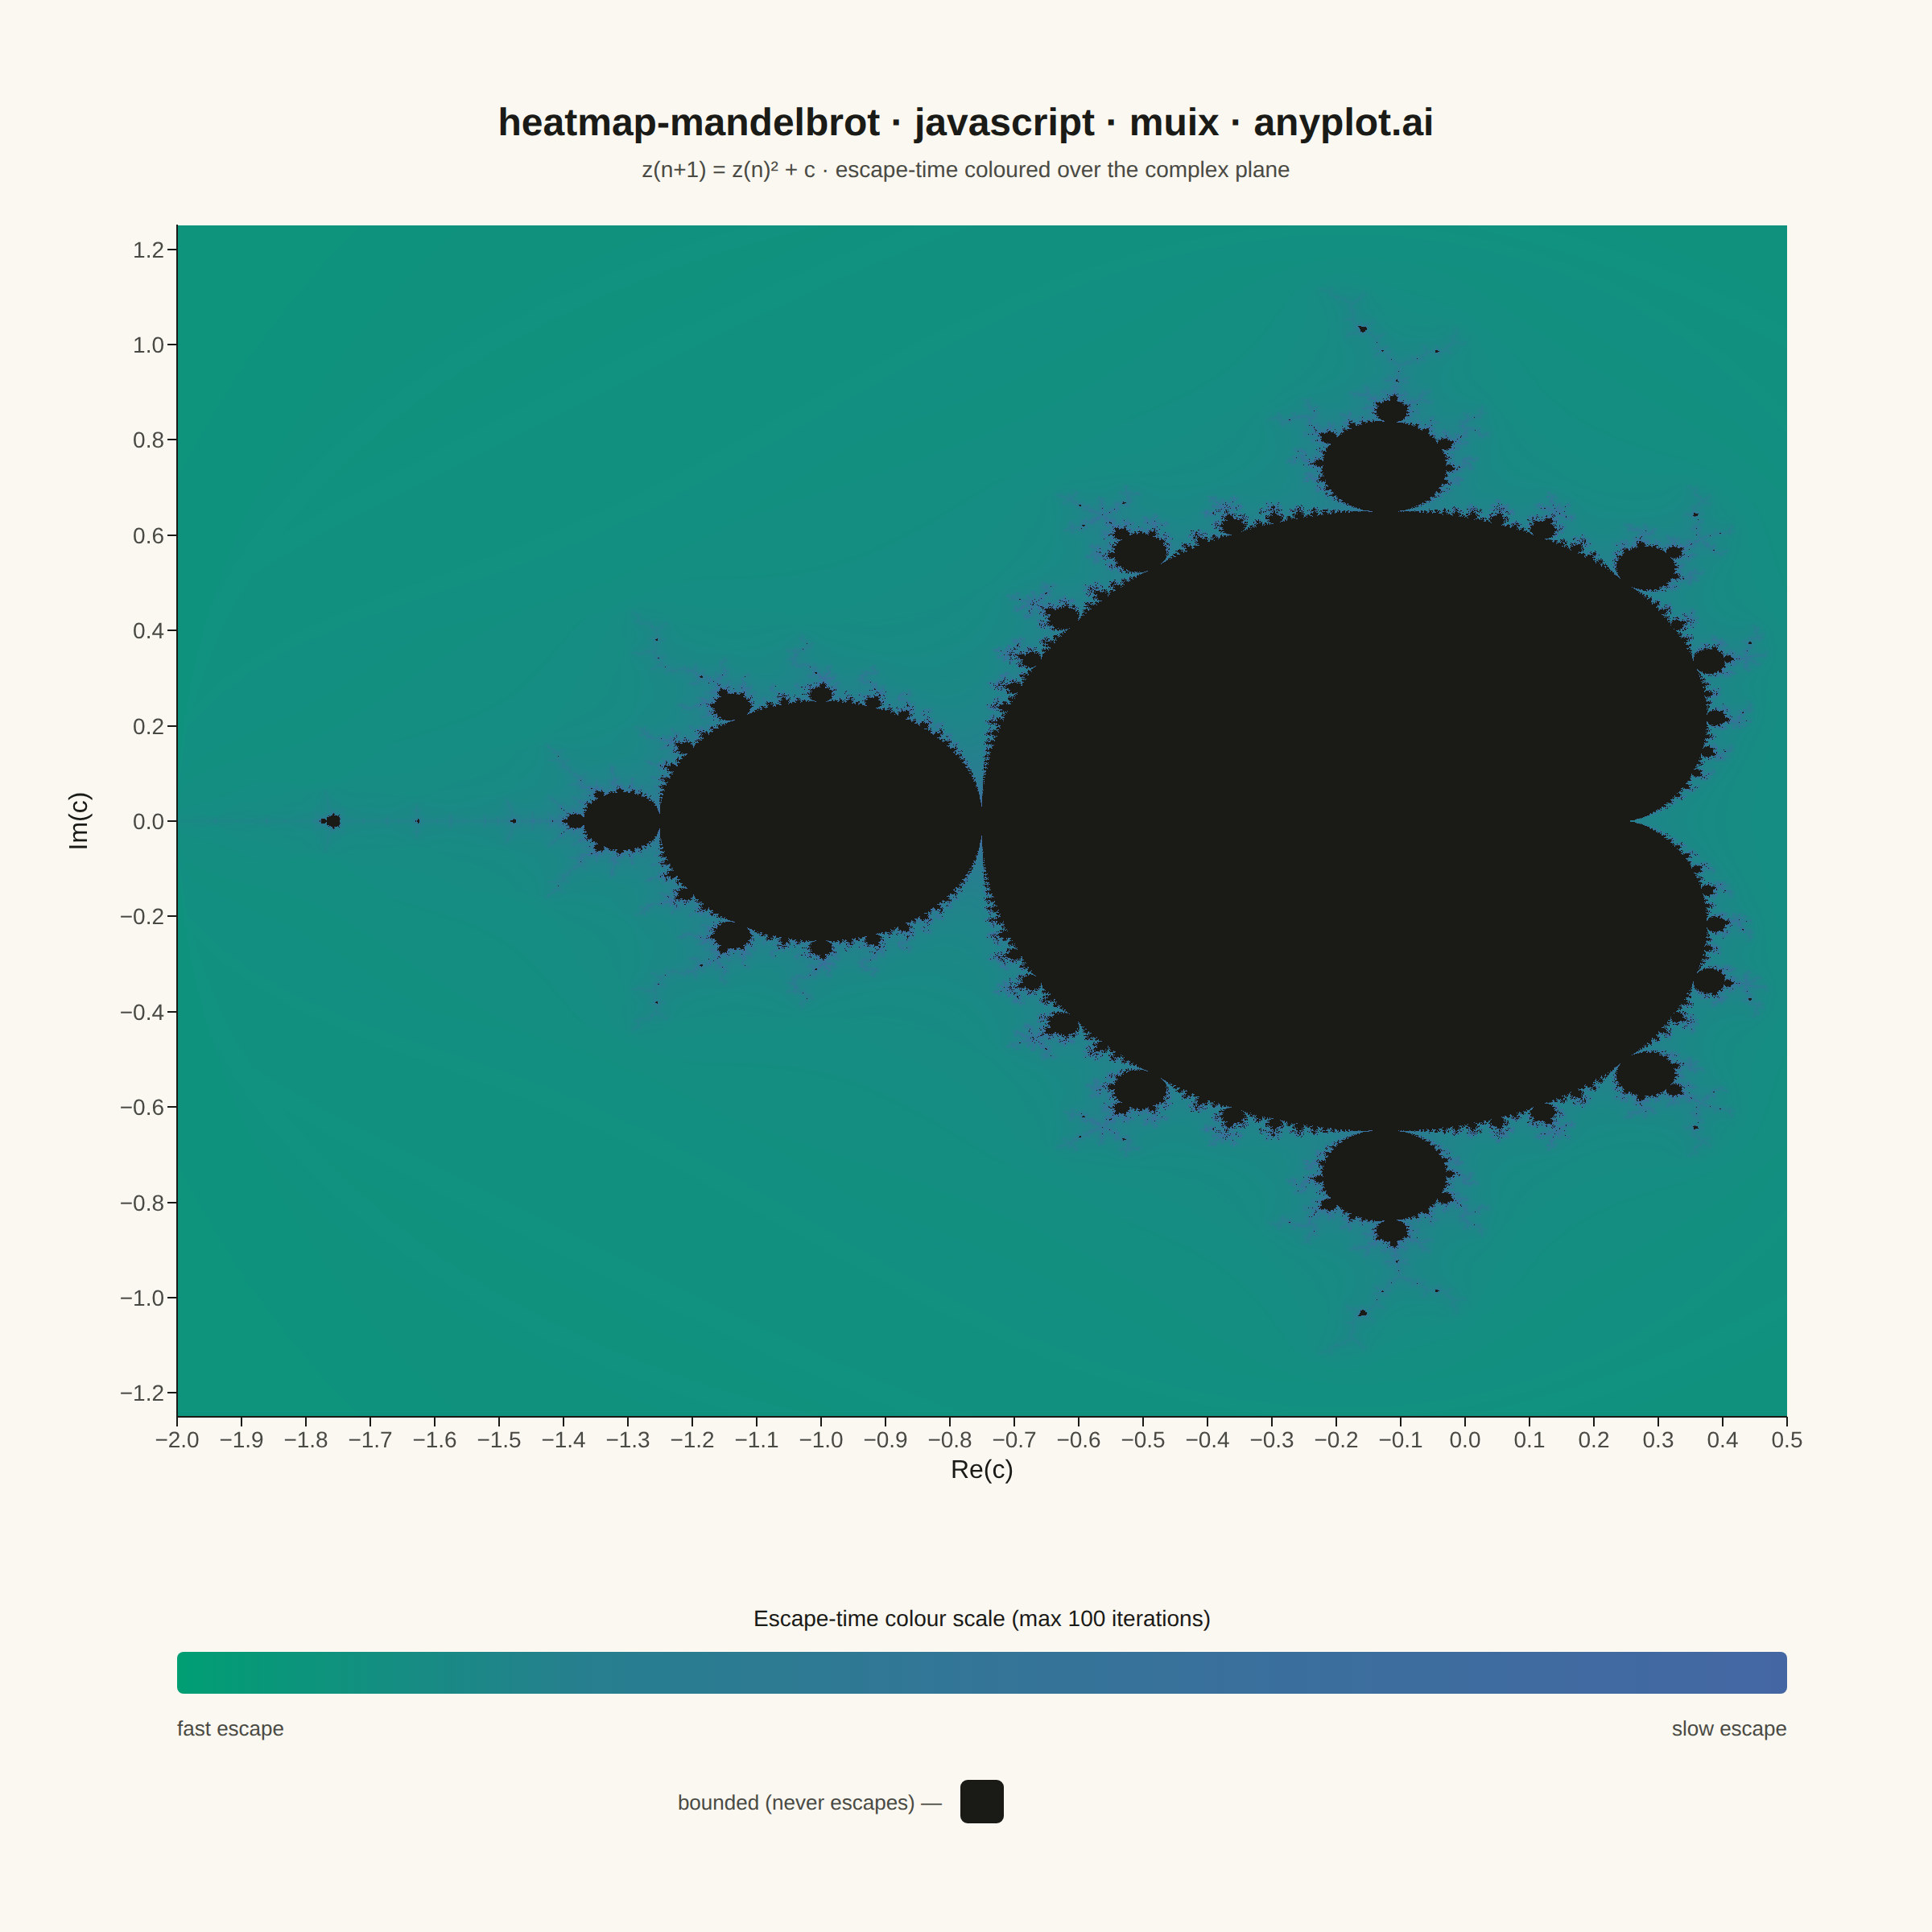
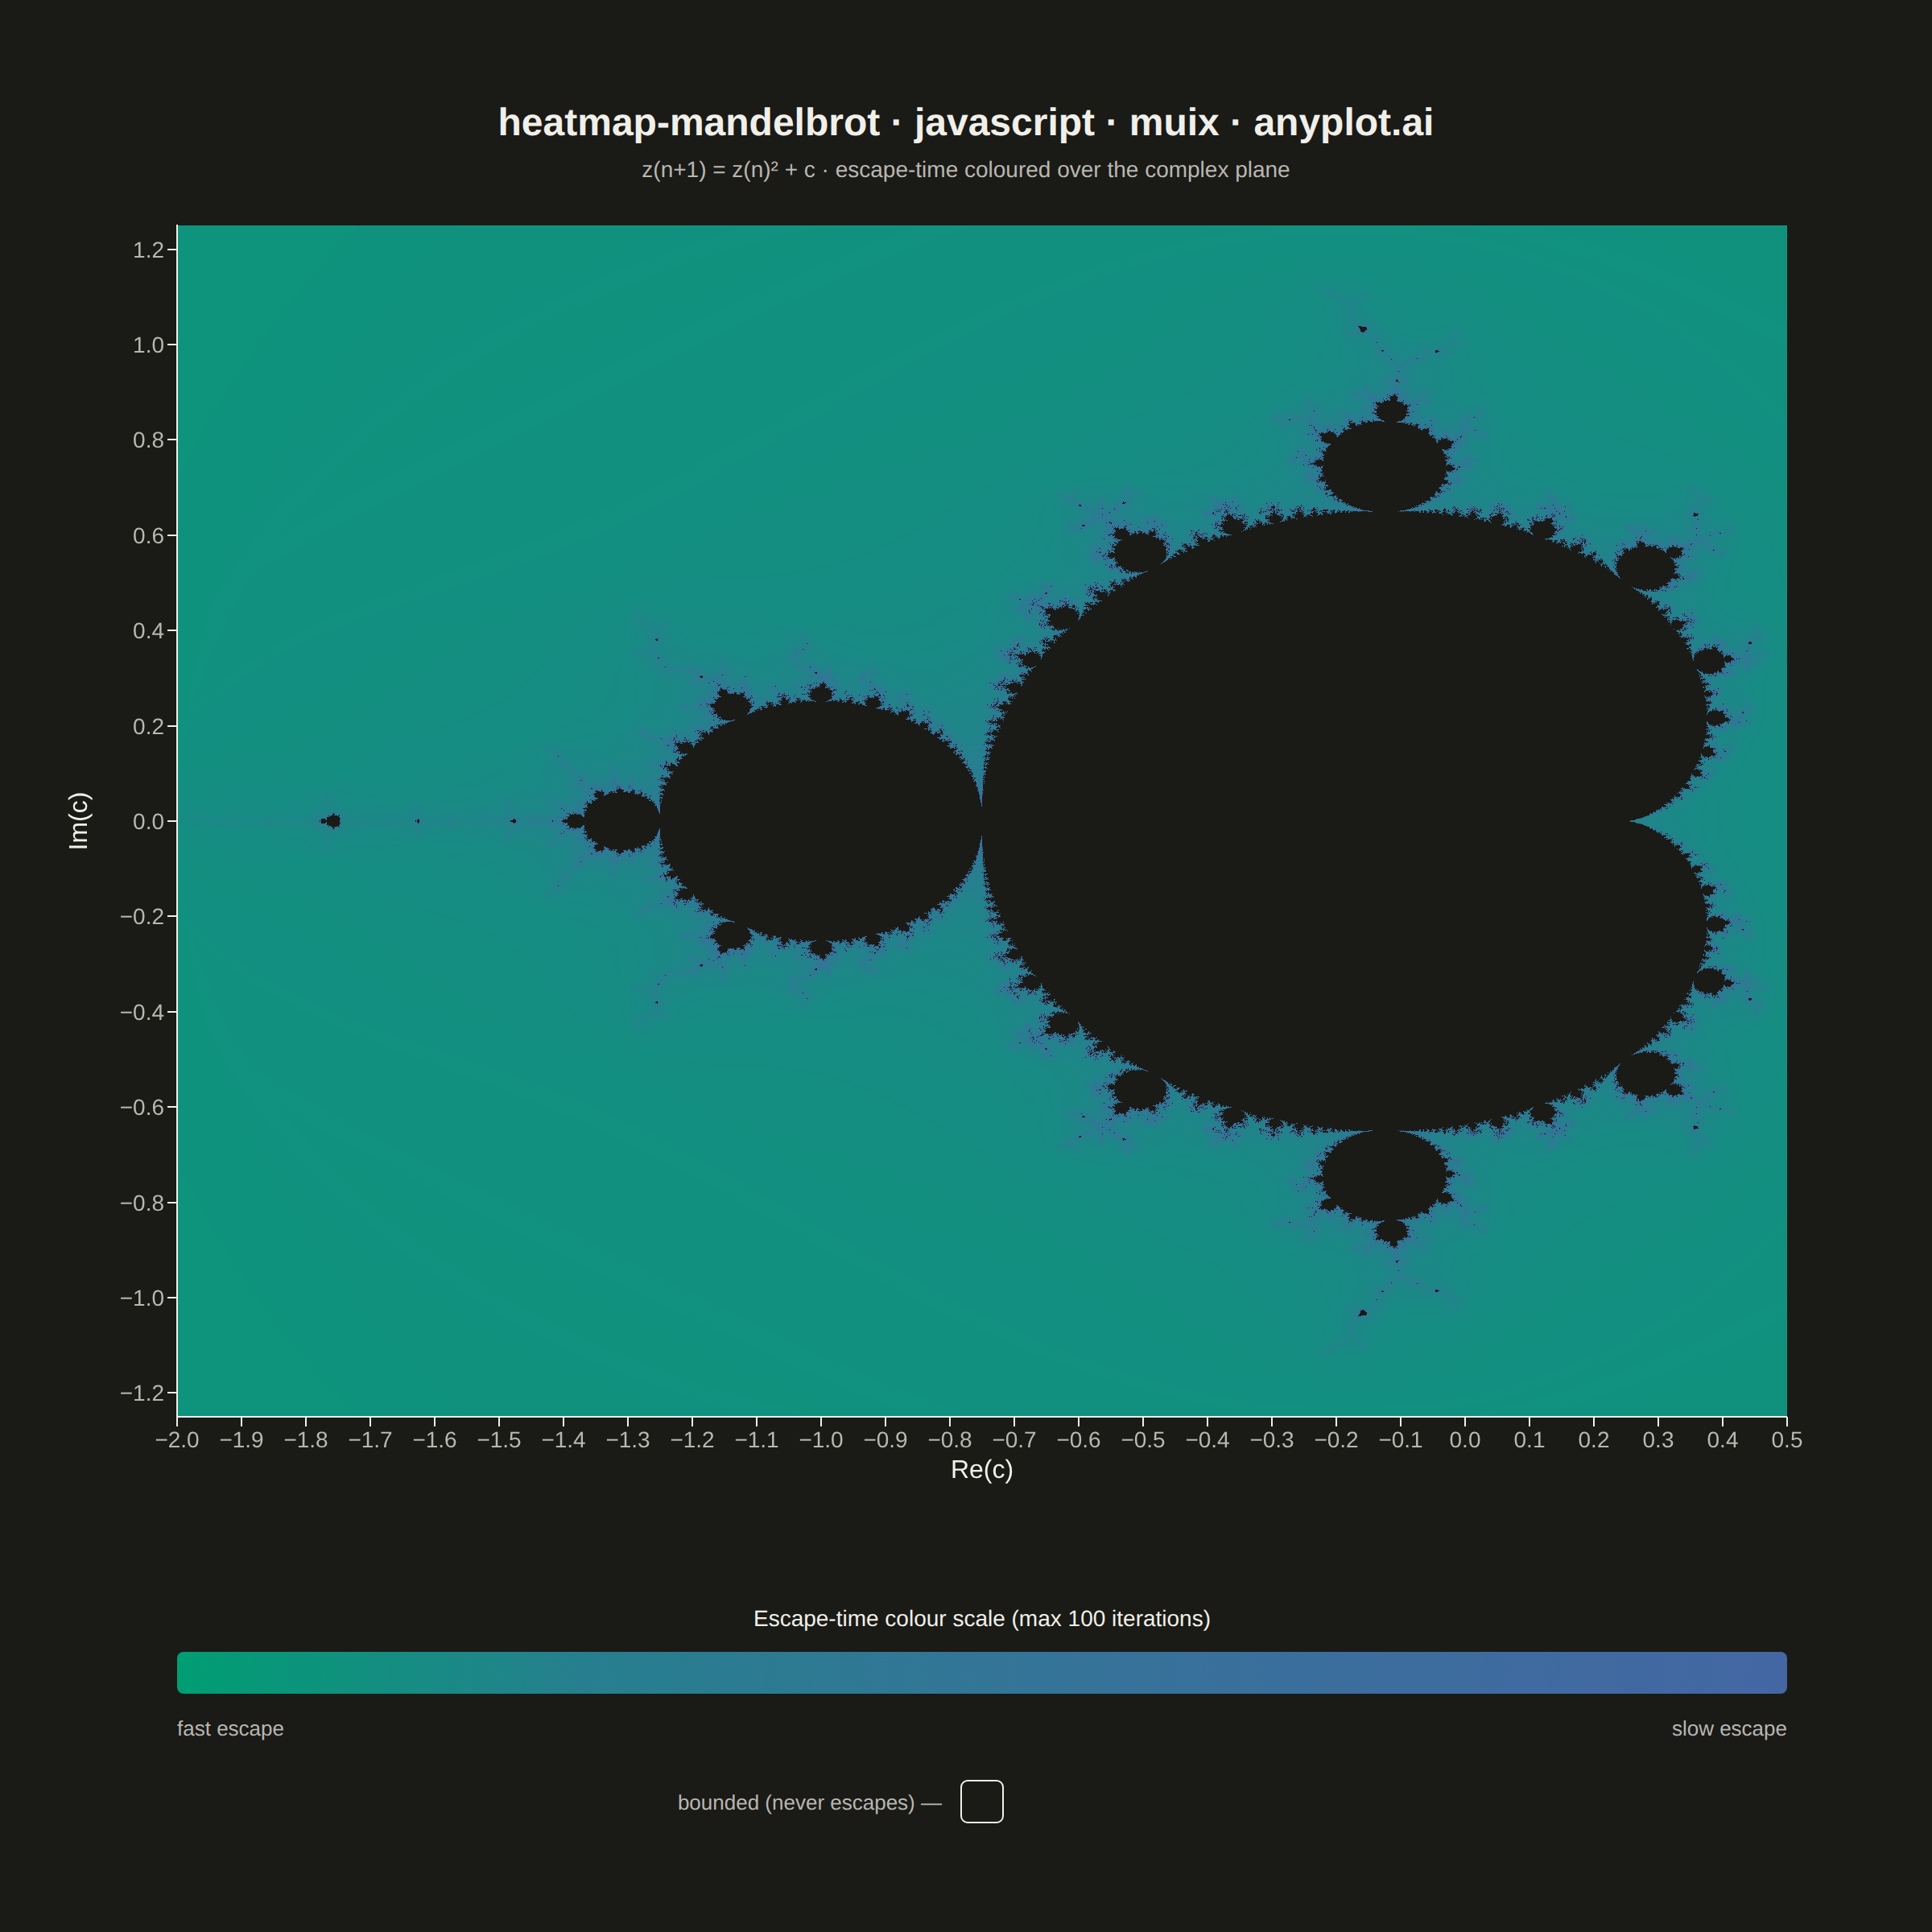
A visualization of the Mandelbrot set, the most iconic fractal in mathematics. Each pixel represents a complex number c on the complex plane, colored by how quickly the iteration z(n+1) = z(n)^2 + c diverges. The boundary between convergent and divergent regions reveals infinitely complex, self-similar structure including the characteristic cardioid and period-2 bulb.
// anyplot.ai
// heatmap-mandelbrot: Mandelbrot Set Fractal Visualization
// Library: muix 7.29.1 | JavaScript 22.23.2
// Quality: 89/100 | Created: 2026-08-25
//# anyplot-orientation: square
// anyplot.ai
// heatmap-mandelbrot: Mandelbrot Set Fractal Visualization
// Library: MUI X Charts | React | Node 22
// License: @mui/x-charts — MIT (community). Pro/Premium are out of scope.
// Quality: pending | Created: 2026-08-25

import * as React from "react";
import { ChartContainer } from "@mui/x-charts/ChartContainer";
import { ChartsXAxis } from "@mui/x-charts/ChartsXAxis";
import { ChartsYAxis } from "@mui/x-charts/ChartsYAxis";
import { useDrawingArea } from "@mui/x-charts/hooks";

const t = window.ANYPLOT_TOKENS;
const { width, height } = window.ANYPLOT_SIZE;

// --- Complex-plane window (spec defaults, cropped to a square aspect so both
// axes share one scale — the classic cardioid + period-2 bulb sit fully inside) ---
const X_MIN = -2.0;
const X_MAX = 0.5;
const Y_MIN = -1.25;
const Y_MAX = 1.25;
const MAX_ITERATIONS = 100;
const ESCAPE_RADIUS_SQ = 4;

// --- Imprint sequential colormap: seq[0] (brand green, fast escape) -> seq[1]
// (blue, slow escape); points that never escape get a fixed near-black swatch
// — a hard-coded data color (not the theme-adaptive `ink` chrome token) so it
// stays identical between light and dark renders, distinct from the gradient.
function hexRgb(hex: string): [number, number, number] {
  return [
    parseInt(hex.slice(1, 3), 16),
    parseInt(hex.slice(3, 5), 16),
    parseInt(hex.slice(5, 7), 16),
  ];
}
const SEQ_LOW = hexRgb(t.seq[0]);
const SEQ_HIGH = hexRgb(t.seq[1]);
const INTERIOR_HEX = "#1A1A17";
const INTERIOR_RGB = hexRgb(INTERIOR_HEX);

function escapeColor(frac: number): [number, number, number] {
  return [
    Math.round(SEQ_LOW[0] + (SEQ_HIGH[0] - SEQ_LOW[0]) * frac),
    Math.round(SEQ_LOW[1] + (SEQ_HIGH[1] - SEQ_LOW[1]) * frac),
    Math.round(SEQ_LOW[2] + (SEQ_HIGH[2] - SEQ_LOW[2]) * frac),
  ];
}

// Most exterior points escape within the first handful of iterations, so a
// linear ramp spends nearly all of its range on the interior's near-boundary
// halo. A gamma < 1 stretches the low end across more of the ramp, pulling
// the filamentary detail near the set's boundary out of a flat green field.
const COLOR_GAMMA = 0.42;
function gammaFrac(frac: number): number {
  return Math.pow(Math.max(0, Math.min(1, frac)), COLOR_GAMMA);
}

// --- Raster fractal layer -----------------------------------------------------
// MUI X Charts' community package has no per-pixel raster primitive (Heatmap is
// Pro-only), so the fractal field is painted onto a plain <canvas> — not a
// competing charting library, just the browser's 2D drawing API — sized and
// positioned from MUI X's own drawing-area context so it exactly fills the
// axes' plot rectangle. Escape-time colour, axes, ticks and the legend below
// are all genuine MUI X / Imprint pieces.
function MandelbrotCanvas() {
  const { left, top, width: areaW, height: areaH } = useDrawingArea();
  const canvasRef = React.useRef<HTMLCanvasElement | null>(null);

  React.useLayoutEffect(() => {
    const canvas = canvasRef.current;
    if (!canvas || areaW <= 0 || areaH <= 0) return;
    const dpr = Math.min(window.devicePixelRatio || 1, 2);
    const pxW = Math.max(1, Math.round(areaW * dpr));
    const pxH = Math.max(1, Math.round(areaH * dpr));
    canvas.width = pxW;
    canvas.height = pxH;
    const ctx = canvas.getContext("2d");
    if (!ctx) return;
    const image = ctx.createImageData(pxW, pxH);
    const data = image.data;

    for (let py = 0; py < pxH; py++) {
      const im0 = Y_MAX - (py / (pxH - 1)) * (Y_MAX - Y_MIN);
      for (let px = 0; px < pxW; px++) {
        const re0 = X_MIN + (px / (pxW - 1)) * (X_MAX - X_MIN);

        let zr = 0;
        let zi = 0;
        let n = 0;
        while (n < MAX_ITERATIONS && zr * zr + zi * zi <= ESCAPE_RADIUS_SQ) {
          const zr2 = zr * zr - zi * zi + re0;
          zi = 2 * zr * zi + im0;
          zr = zr2;
          n++;
        }

        const idx = (py * pxW + px) * 4;
        if (n >= MAX_ITERATIONS) {
          data[idx] = INTERIOR_RGB[0];
          data[idx + 1] = INTERIOR_RGB[1];
          data[idx + 2] = INTERIOR_RGB[2];
        } else {
          // Smooth (renormalized) escape count — a continuous colour ramp with
          // no discrete banding between adjacent iteration counts.
          const magSq = zr * zr + zi * zi;
          const smoothN =
            n + 1 - Math.log(Math.log(Math.sqrt(magSq))) / Math.LN2;
          const frac = Math.max(0, Math.min(1, smoothN / MAX_ITERATIONS));
          const [r, g, b] = escapeColor(gammaFrac(frac));
          data[idx] = r;
          data[idx + 1] = g;
          data[idx + 2] = b;
        }
        data[idx + 3] = 255;
      }
    }
    ctx.putImageData(image, 0, 0);
  }, [areaW, areaH]);

  return (
    <foreignObject x={left} y={top} width={areaW} height={areaH}>
      <canvas
        ref={canvasRef}
        style={{ width: "100%", height: "100%", display: "block" }}
      />
    </foreignObject>
  );
}

// --- Legend: escape-time colour ramp + a swatch for the bounded interior ------
// Anchored well below the drawing area's bottom edge (past the x-axis's own
// tick labels + axis-title chrome) so the two never collide.
function Legend() {
  const { left, top, width: areaW, height: areaH } = useDrawingArea();
  const drawingBottom = top + areaH;
  const barX = left;
  const barW = areaW;
  const barH = 26;
  const titleY = drawingBottom + 130;
  const barY = titleY + 16;
  const endLabelY = barY + barH + 26;
  const swatchSize = 26;
  const swatchY = endLabelY + 28;
  const swatchX = barX + barW / 2 - swatchSize / 2;

  return (
    <>
      <defs>
        <linearGradient id="mandelbrotRamp" x1="0" y1="0" x2="1" y2="0">
          {[0, 0.25, 0.5, 0.75, 1].map((stop) => {
            const [r, g, b] = escapeColor(gammaFrac(stop));
            return (
              <stop
                key={stop}
                offset={`${stop * 100}%`}
                stopColor={`rgb(${r},${g},${b})`}
              />
            );
          })}
        </linearGradient>
      </defs>
      <text
        x={barX + barW / 2}
        y={titleY}
        textAnchor="middle"
        fontSize={14}
        fill={t.ink}
      >
        Escape-time colour scale (max {MAX_ITERATIONS} iterations)
      </text>
      <rect
        x={barX}
        y={barY}
        width={barW}
        height={barH}
        fill="url(#mandelbrotRamp)"
        rx={4}
      />
      <text
        x={barX}
        y={endLabelY}
        textAnchor="start"
        fontSize={13}
        fill={t.inkSoft}
      >
        fast escape
      </text>
      <text
        x={barX + barW}
        y={endLabelY}
        textAnchor="end"
        fontSize={13}
        fill={t.inkSoft}
      >
        slow escape
      </text>
      {/* Fixed fill color happens to equal the dark theme's page background
          (#1A1A17), so the swatch would vanish on dark without a border. The
          stroke is chrome (theme-adaptive ink), not a data color, so it stays
          within the "only chrome flips" rule while guaranteeing visibility. */}
      <rect
        x={swatchX}
        y={swatchY}
        width={swatchSize}
        height={swatchSize}
        fill={INTERIOR_HEX}
        stroke={t.ink}
        strokeWidth={1}
        rx={4}
      />
      <text
        x={swatchX - 12}
        y={swatchY + swatchSize / 2 + 5}
        textAnchor="end"
        fontSize={13}
        fill={t.inkSoft}
      >
        bounded (never escapes) —
      </text>
    </>
  );
}

function ChartTitle() {
  const { top } = useDrawingArea();
  return (
    <>
      <text
        x={width / 2}
        y={top - 56}
        textAnchor="middle"
        fontSize={24}
        fontWeight={600}
        fill={t.ink}
      >
        heatmap-mandelbrot · javascript · muix · anyplot.ai
      </text>
      <text
        x={width / 2}
        y={top - 30}
        textAnchor="middle"
        fontSize={14}
        fill={t.inkSoft}
      >
        z(n+1) = z(n)² + c · escape-time coloured over the complex plane
      </text>
    </>
  );
}

const MARGIN = { top: 140, right: 90, bottom: 320, left: 110 };

export default function Chart() {
  return (
    <ChartContainer
      width={width}
      height={height}
      series={[]}
      skipAnimation
      margin={MARGIN}
      xAxis={[
        {
          scaleType: "linear",
          min: X_MIN,
          max: X_MAX,
          label: "Re(c)",
          tickLabelStyle: { fontSize: 14, fill: t.inkSoft },
          labelStyle: { fontSize: 16, fill: t.ink },
        },
      ]}
      yAxis={[
        {
          scaleType: "linear",
          min: Y_MIN,
          max: Y_MAX,
          label: "Im(c)",
          // ChartsYAxis positions the rotated axis label at a fixed offset of
          // `tickFontSize + tickSize + 10` from the axis line — not the actual
          // measured width of the tick text — so with the default tickFontSize
          // (12) the label sat almost on top of wide tick labels like "-0.2".
          // tickLabelStyle.fontSize below still controls the *rendered* tick
          // font size; bumping this deprecated prop only pushes the label
          // further left to clear the tick text.
          tickFontSize: 40,
          tickLabelStyle: { fontSize: 14, fill: t.inkSoft },
          labelStyle: { fontSize: 16, fill: t.ink },
        },
      ]}
    >
      <ChartTitle />
      <MandelbrotCanvas />
      <ChartsXAxis />
      <ChartsYAxis />
      <Legend />
    </ChartContainer>
  );
}
Runnable source as JSON, for any HTTP client: https://api.anyplot.ai/specs/heatmap-mandelbrot/muix/code. Any spec id and library id listed in llms-full.txt fit the same URL shape; every URL below is complete and callable.
{
  "spec_id": "heatmap-mandelbrot",
  "language": "javascript",
  "library": "muix",
  "page": "https://anyplot.ai/heatmap-mandelbrot/javascript/muix",
  "hub": "https://anyplot.ai/heatmap-mandelbrot",
  "code_json": "https://api.anyplot.ai/specs/heatmap-mandelbrot/muix/code",
  "spec_json": "https://api.anyplot.ai/specs/heatmap-mandelbrot",
  "render_light_png": "https://storage.googleapis.com/anyplot-images/plots/heatmap-mandelbrot/javascript/muix/plot-light.png",
  "render_dark_png": "https://storage.googleapis.com/anyplot-images/plots/heatmap-mandelbrot/javascript/muix/plot-dark.png",
  "interactive_light_html": "https://storage.googleapis.com/anyplot-images/plots/heatmap-mandelbrot/javascript/muix/plot-light.html",
  "interactive_dark_html": "https://storage.googleapis.com/anyplot-images/plots/heatmap-mandelbrot/javascript/muix/plot-dark.html",
  "quality_score": 89.0,
  "license": "MIT",
  "guide": "https://anyplot.ai/llms.txt"
}
Part of Mandelbrot Set Fractal Visualization on anyplot.ai.