The same plot in 14 other libraries — Python: Altair, Bokeh, lets-plot, Matplotlib, plotnine, Pygal, Seaborn; R: ggplot2; Julia: Makie.jl; JavaScript: Chart.js, D3.js, Apache ECharts, Highcharts, MUI X Charts. Compare all 15 side by side: Mandelbrot Set Fractal Visualization in Python, R, Julia and JavaScript.
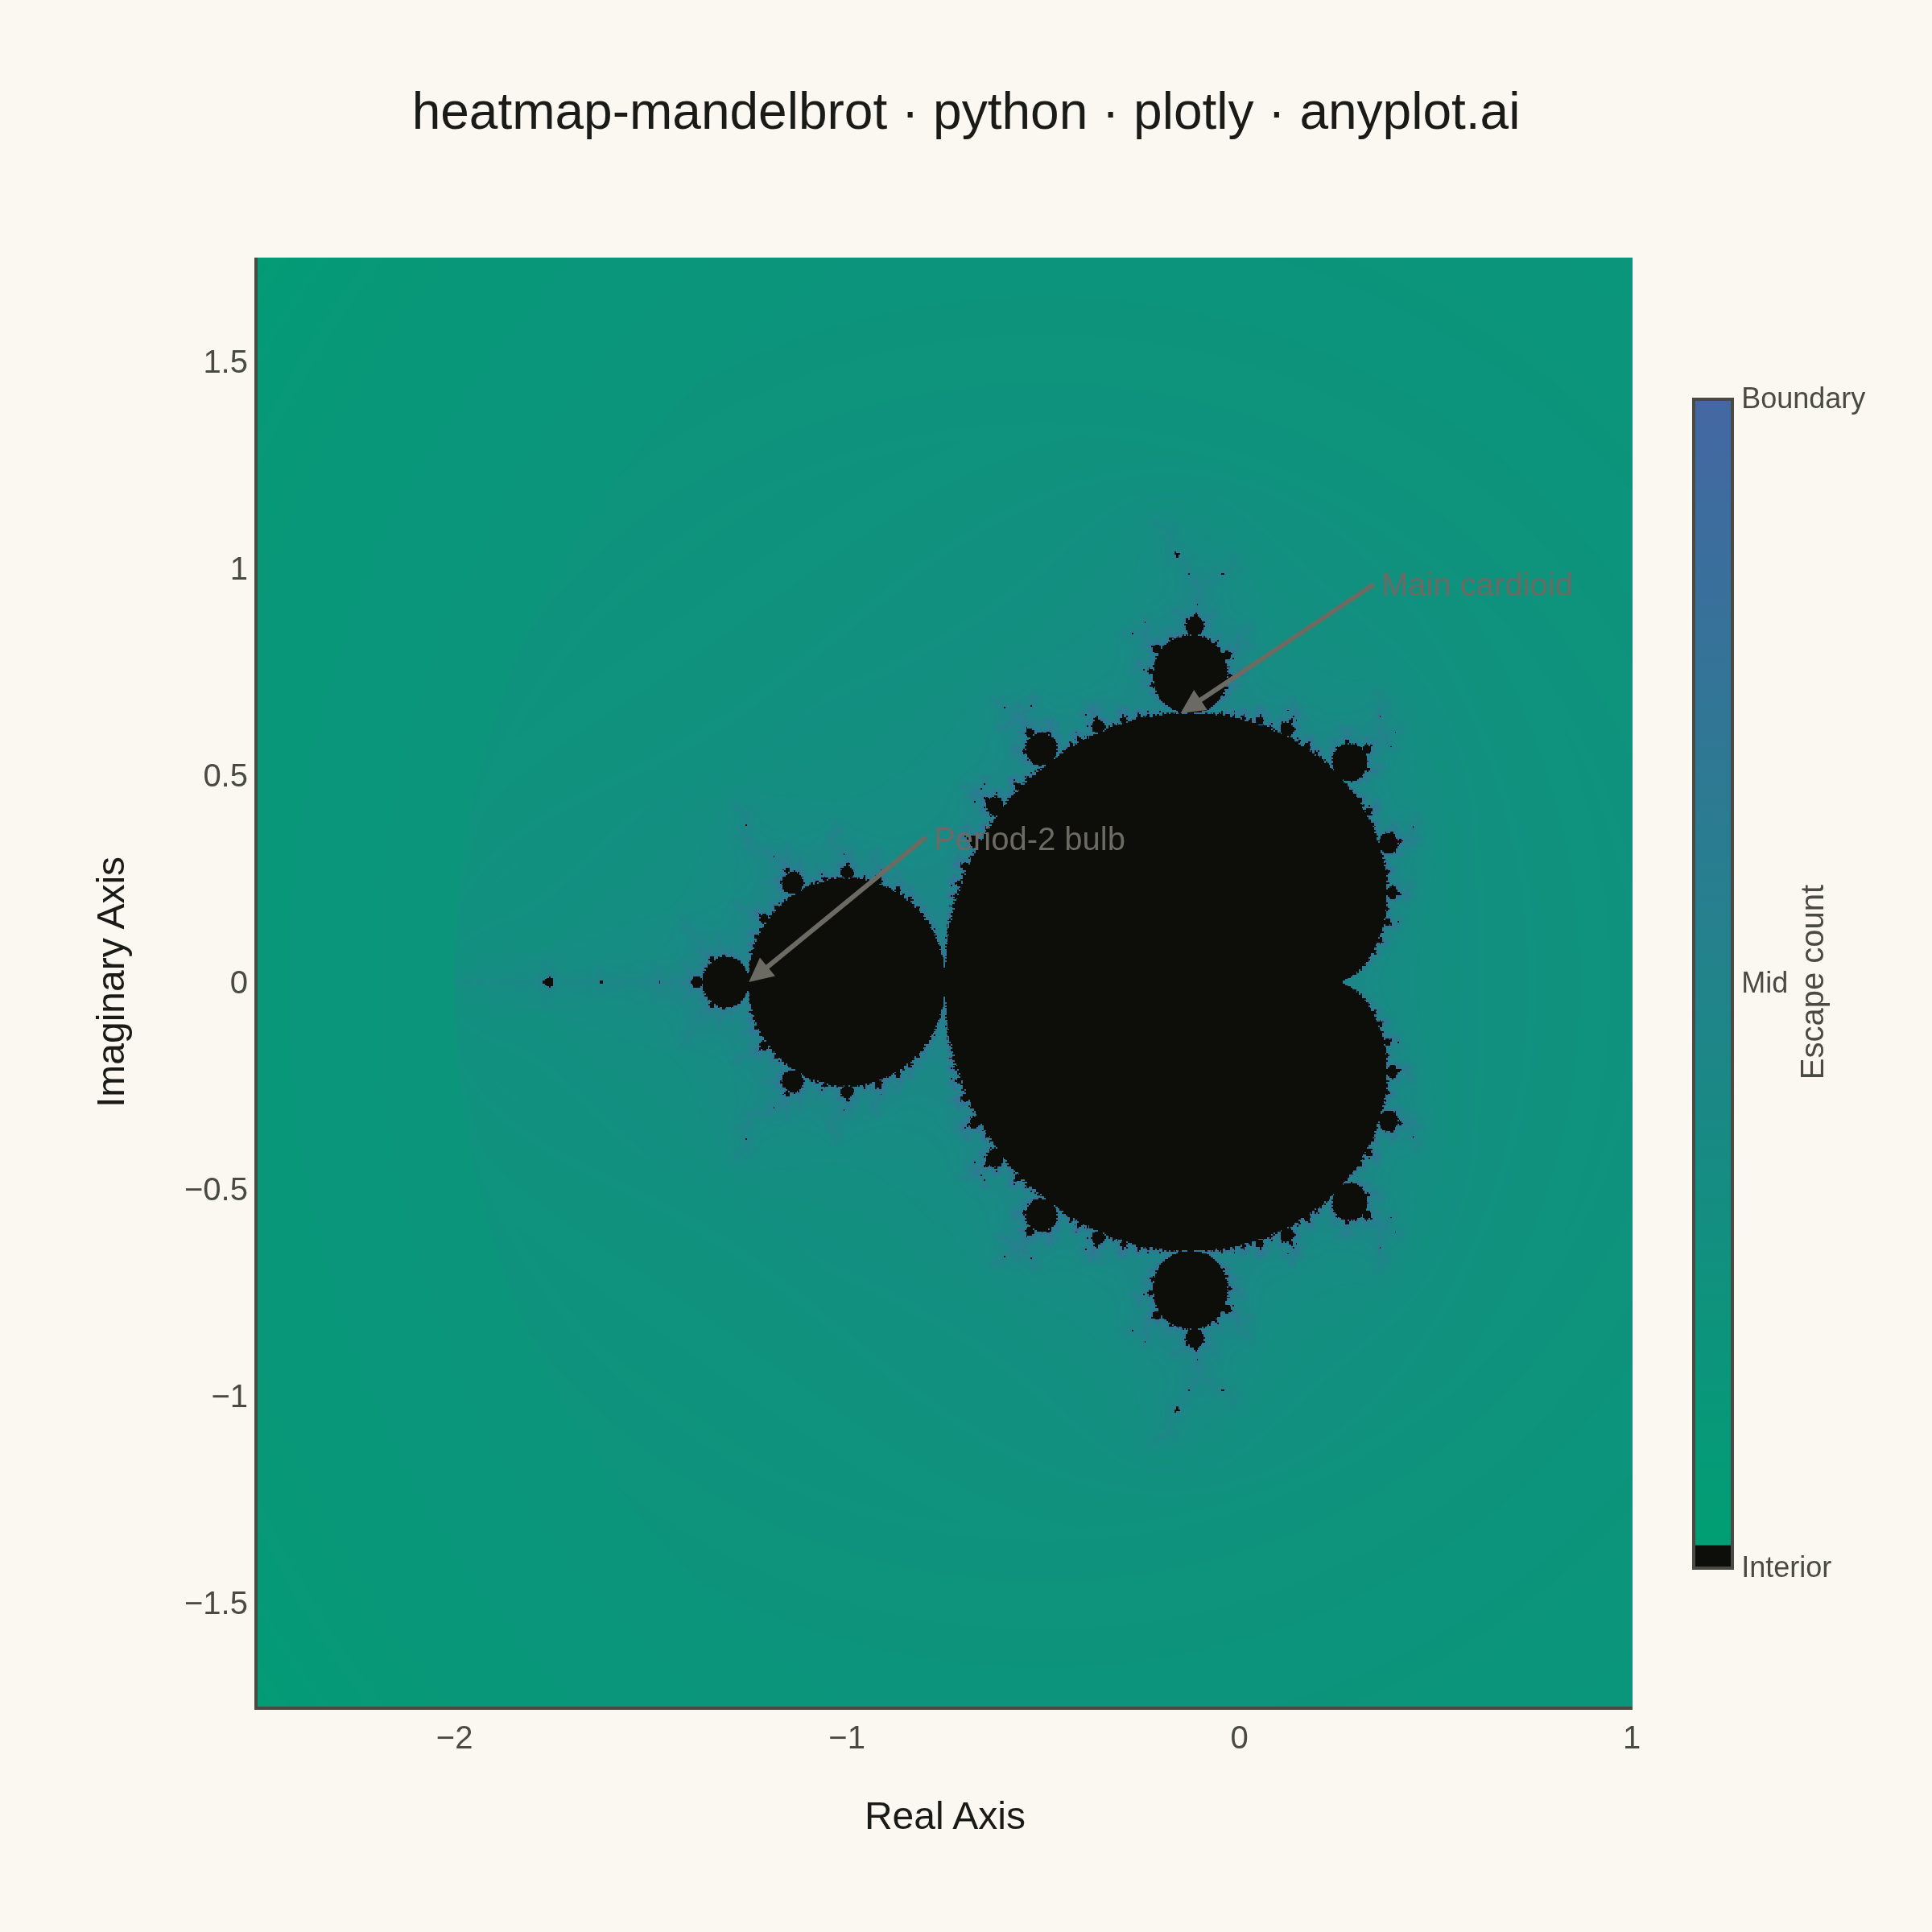
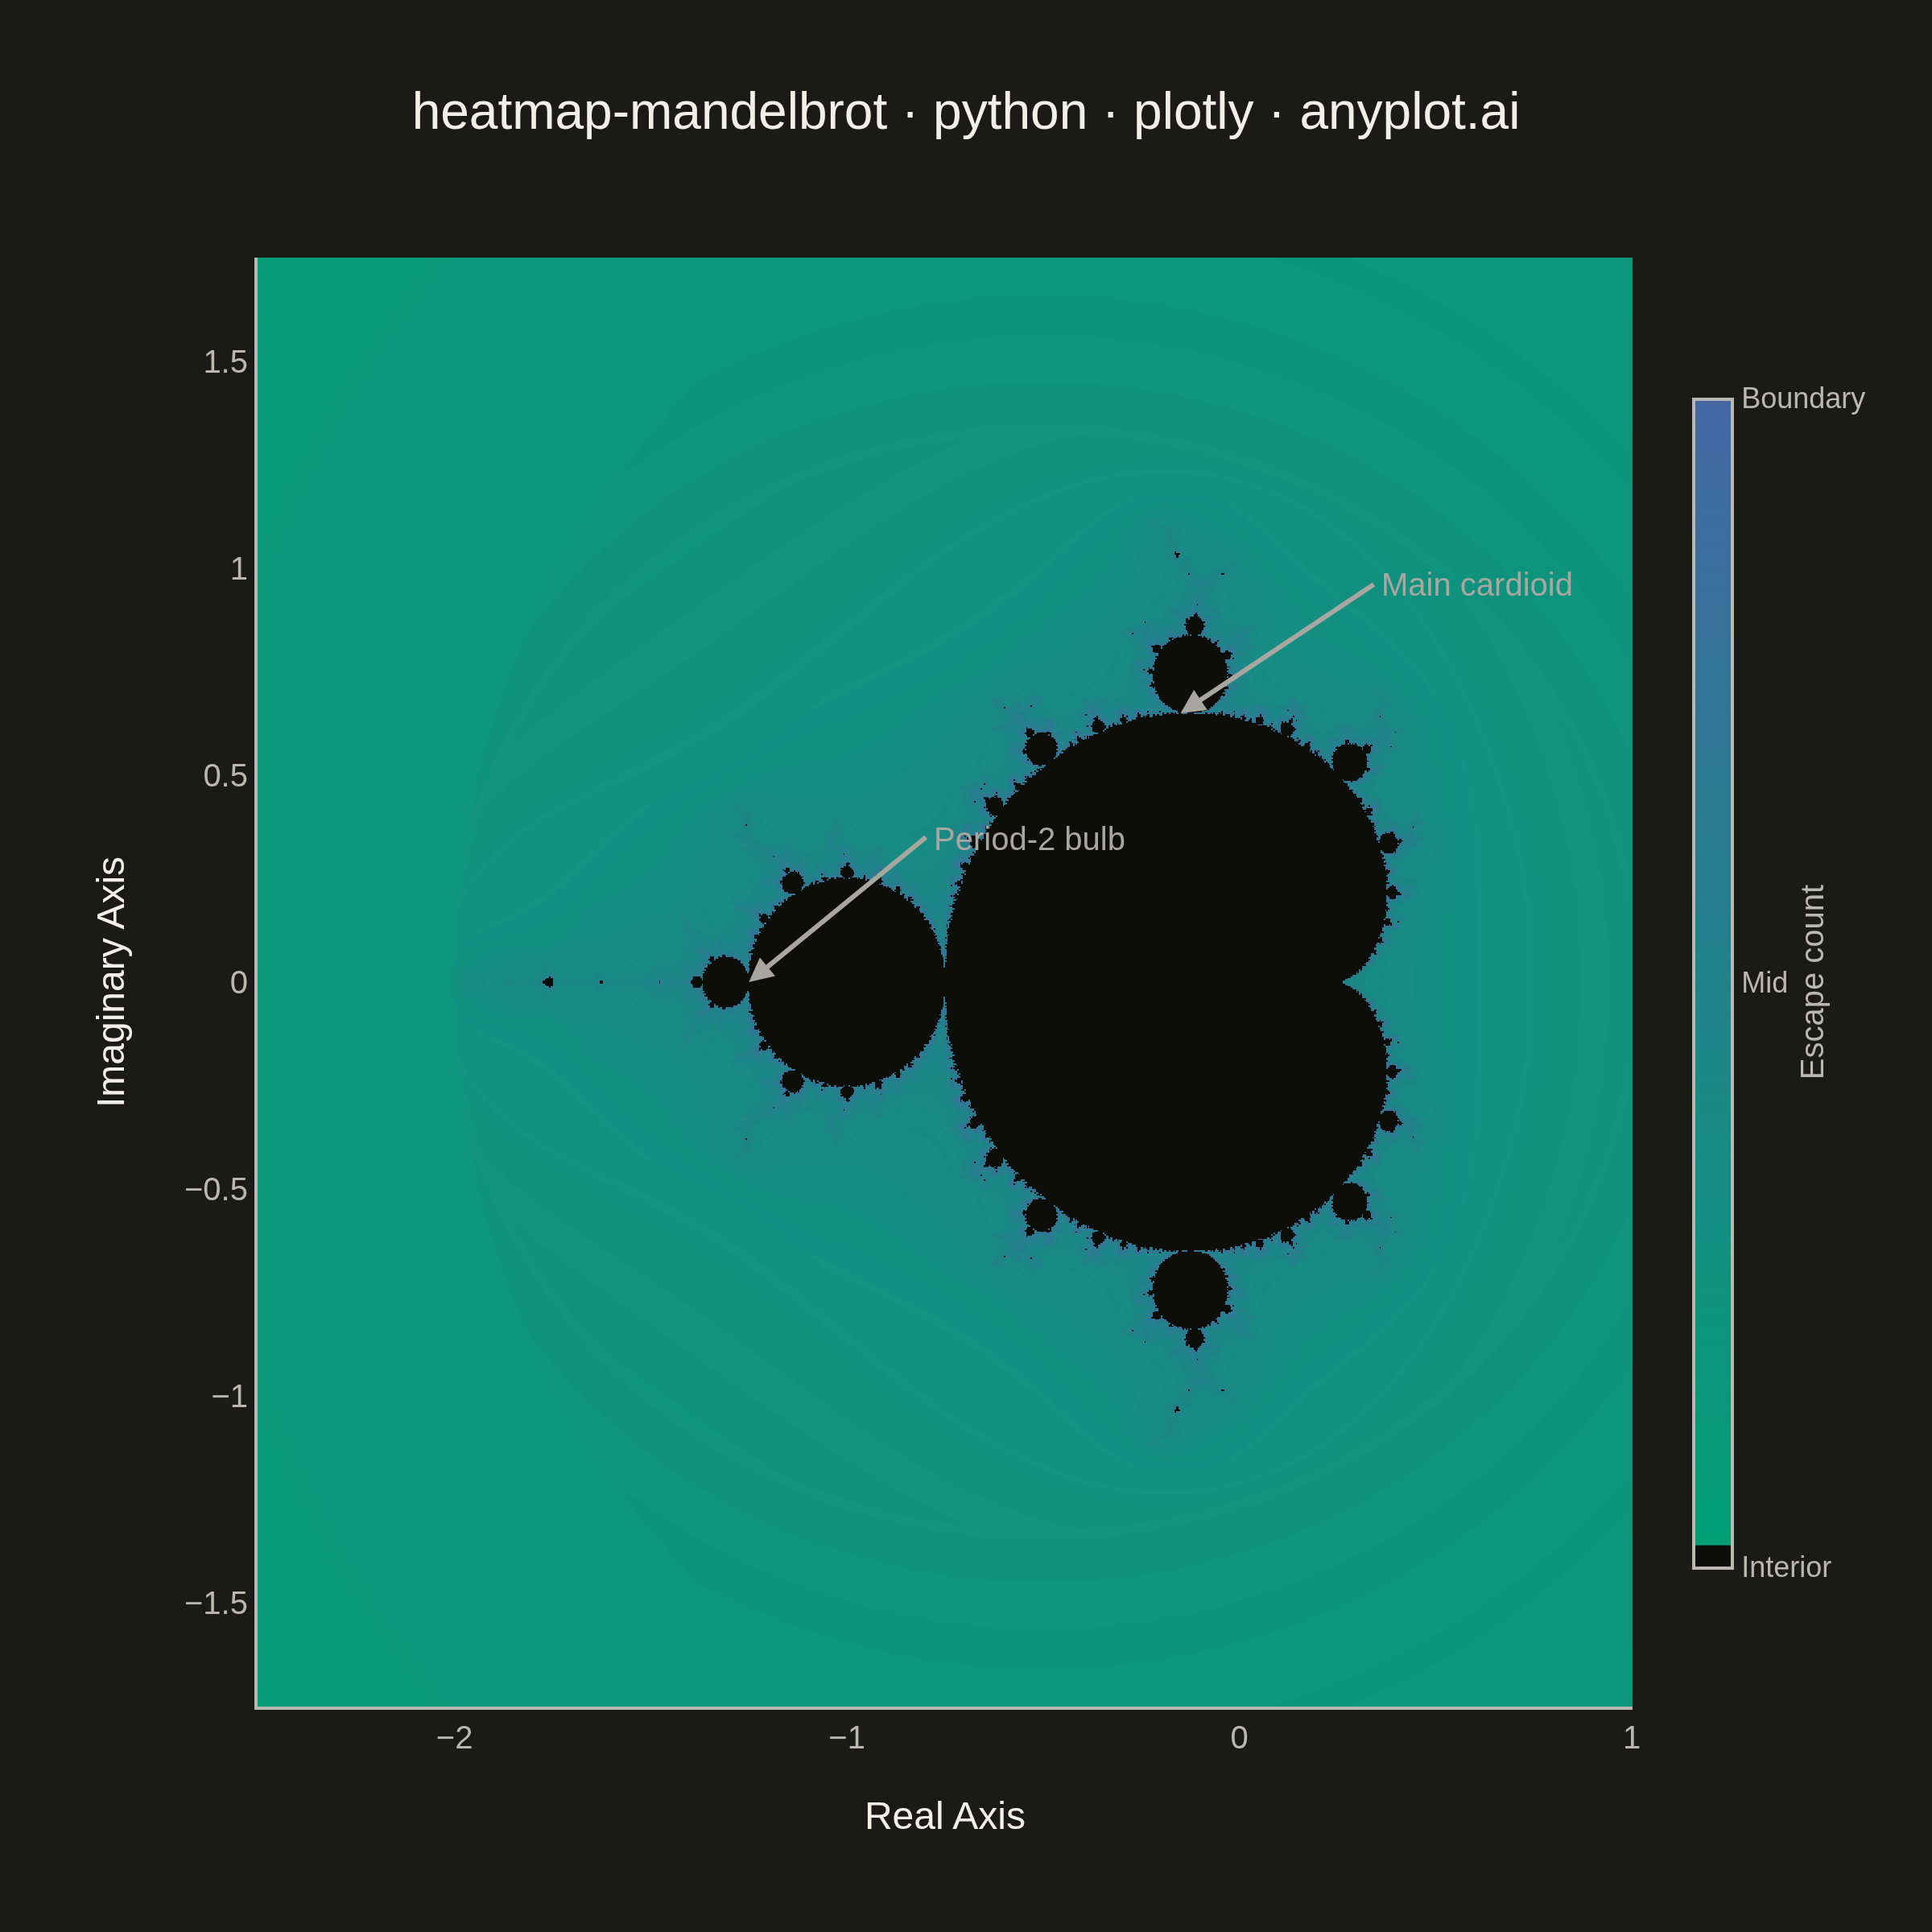
A visualization of the Mandelbrot set, the most iconic fractal in mathematics. Each pixel represents a complex number c on the complex plane, colored by how quickly the iteration z(n+1) = z(n)^2 + c diverges. The boundary between convergent and divergent regions reveals infinitely complex, self-similar structure including the characteristic cardioid and period-2 bulb.
""" anyplot.ai
heatmap-mandelbrot: Mandelbrot Set Fractal Visualization
Library: plotly 6.7.0 | Python 3.13.13
Quality: 87/100 | Created: 2026-05-30
"""

import os

import numpy as np
import plotly.graph_objects as go


# Theme tokens
THEME = os.getenv("ANYPLOT_THEME", "light")
PAGE_BG = "#FAF8F1" if THEME == "light" else "#1A1A17"
ELEVATED_BG = "#FFFDF6" if THEME == "light" else "#242420"
INK = "#1A1A17" if THEME == "light" else "#F0EFE8"
INK_SOFT = "#4A4A44" if THEME == "light" else "#B8B7B0"
INK_MUTED = "#6B6A63" if THEME == "light" else "#A8A79F"
GRID = "rgba(26,26,23,0.15)" if THEME == "light" else "rgba(240,239,232,0.15)"
INSIDE_COLOR = "#0D0D0A"  # near-black for points inside the Mandelbrot set

# Data: Mandelbrot set on the complex plane
# Equal x/y extents (3.5 × 3.5 units) for square canvas
x_min, x_max = -2.5, 1.0  # real axis — standard full view
y_min, y_max = -1.75, 1.75  # imaginary axis — expanded to match x extent
max_iter = 256
resolution = 1000  # square grid

real = np.linspace(x_min, x_max, resolution)
imag = np.linspace(y_min, y_max, resolution)
C = real[np.newaxis, :] + 1j * imag[:, np.newaxis]  # shape (resolution, resolution)

Z = np.zeros_like(C)
escape_count = np.zeros(C.shape, dtype=float)
escaped = np.zeros(C.shape, dtype=bool)

for i in range(max_iter):
    mask = ~escaped
    Z[mask] = Z[mask] ** 2 + C[mask]
    newly_escaped = mask & (np.abs(Z) > 2.0)
    escape_count[newly_escaped] = i + 1
    escaped |= newly_escaped

# Smooth coloring: remove discrete banding via normalized iteration count
abs_z = np.abs(Z)
log_z = np.log2(np.maximum(abs_z, 1.0 + 1e-10))
log_log_z = np.log2(np.maximum(log_z, 1e-10))
smooth = np.where(escaped, escape_count - log_log_z, -1.0)

# Power-law (gamma=0.3) normalization spreads colors across the full exterior
# much better than log or sqrt — most escaped pixels have low iteration counts,
# so a strong gamma pulls the green→blue gradient into the near-boundary bands
s_min = smooth[escaped].min()
s_max = smooth[escaped].max()
linear_norm = (smooth - s_min) / (s_max - s_min)
gamma_norm = np.power(np.maximum(linear_norm, 0.0), 0.3)
z_data = np.where(escaped, gamma_norm * 0.98 + 0.02, 0.0)

# Colorscale: inside set = near-black; escaped = Imprint sequential (green → blue)
colorscale = [[0.000, INSIDE_COLOR], [0.019, INSIDE_COLOR], [0.020, "#009E73"], [1.000, "#4467A3"]]

# Plot
title = "heatmap-mandelbrot · python · plotly · anyplot.ai"
title_fontsize = round(16 * 67 / len(title)) if len(title) > 67 else 16

fig = go.Figure(
    go.Heatmap(
        z=z_data,
        x=real,
        y=imag,
        colorscale=colorscale,
        showscale=True,
        zmin=0.0,
        zmax=1.0,
        hovertemplate="Re: %{x:.3f}<br>Im: %{y:.3f}<extra></extra>",
        colorbar=dict(
            thickness=12,
            len=0.85,
            title=dict(text="Escape count", side="right", font=dict(size=10, color=INK_SOFT)),
            tickfont=dict(size=9, color=INK_SOFT),
            bgcolor=PAGE_BG,
            outlinecolor=INK_SOFT,
            outlinewidth=1,
            tickvals=[0.0, 0.5, 1.0],
            ticktext=["Interior", "Mid", "Boundary"],
        ),
    )
)

fig.update_layout(
    autosize=False,
    paper_bgcolor=PAGE_BG,
    plot_bgcolor=PAGE_BG,
    margin=dict(l=80, r=90, t=80, b=70),
    title=dict(text=title, font=dict(size=title_fontsize, color=INK), x=0.5, xanchor="center"),
    xaxis=dict(
        title=dict(text="Real Axis", font=dict(size=12, color=INK)),
        tickfont=dict(size=10, color=INK_SOFT),
        gridcolor=GRID,
        linecolor=INK_SOFT,
        zerolinecolor=INK_SOFT,
        zerolinewidth=1,
    ),
    yaxis=dict(
        title=dict(text="Imaginary Axis", font=dict(size=12, color=INK)),
        tickfont=dict(size=10, color=INK_SOFT),
        gridcolor=GRID,
        linecolor=INK_SOFT,
        zerolinecolor=INK_SOFT,
        zerolinewidth=1,
    ),
    annotations=[
        dict(
            x=-1.25,
            y=0.0,
            text="Period-2 bulb",
            showarrow=True,
            arrowhead=2,
            arrowsize=1,
            arrowwidth=1.5,
            arrowcolor=INK_MUTED,
            font=dict(size=10, color=INK_MUTED),
            ax=55,
            ay=-45,
            xanchor="left",
        ),
        dict(
            x=-0.15,
            y=0.65,
            text="Main cardioid",
            showarrow=True,
            arrowhead=2,
            arrowsize=1,
            arrowwidth=1.5,
            arrowcolor=INK_MUTED,
            font=dict(size=10, color=INK_MUTED),
            ax=60,
            ay=-40,
            xanchor="left",
        ),
    ],
)

# Save — square canvas: 2400×2400 via width=600, height=600, scale=4
fig.write_image(f"plot-{THEME}.png", width=600, height=600, scale=4)
fig.write_html(f"plot-{THEME}.html", include_plotlyjs="cdn")
Runnable source as JSON, for any HTTP client: https://api.anyplot.ai/specs/heatmap-mandelbrot/plotly/code. Any spec id and library id listed in llms-full.txt fit the same URL shape; every URL below is complete and callable.
{
  "spec_id": "heatmap-mandelbrot",
  "language": "python",
  "library": "plotly",
  "page": "https://anyplot.ai/heatmap-mandelbrot/python/plotly",
  "hub": "https://anyplot.ai/heatmap-mandelbrot",
  "code_json": "https://api.anyplot.ai/specs/heatmap-mandelbrot/plotly/code",
  "spec_json": "https://api.anyplot.ai/specs/heatmap-mandelbrot",
  "render_light_png": "https://storage.googleapis.com/anyplot-images/plots/heatmap-mandelbrot/python/plotly/plot-light.png",
  "render_dark_png": "https://storage.googleapis.com/anyplot-images/plots/heatmap-mandelbrot/python/plotly/plot-dark.png",
  "interactive_light_html": "https://storage.googleapis.com/anyplot-images/plots/heatmap-mandelbrot/python/plotly/plot-light.html",
  "interactive_dark_html": "https://storage.googleapis.com/anyplot-images/plots/heatmap-mandelbrot/python/plotly/plot-dark.html",
  "quality_score": 87.0,
  "license": "MIT",
  "guide": "https://anyplot.ai/llms.txt"
}
Part of Mandelbrot Set Fractal Visualization on anyplot.ai.