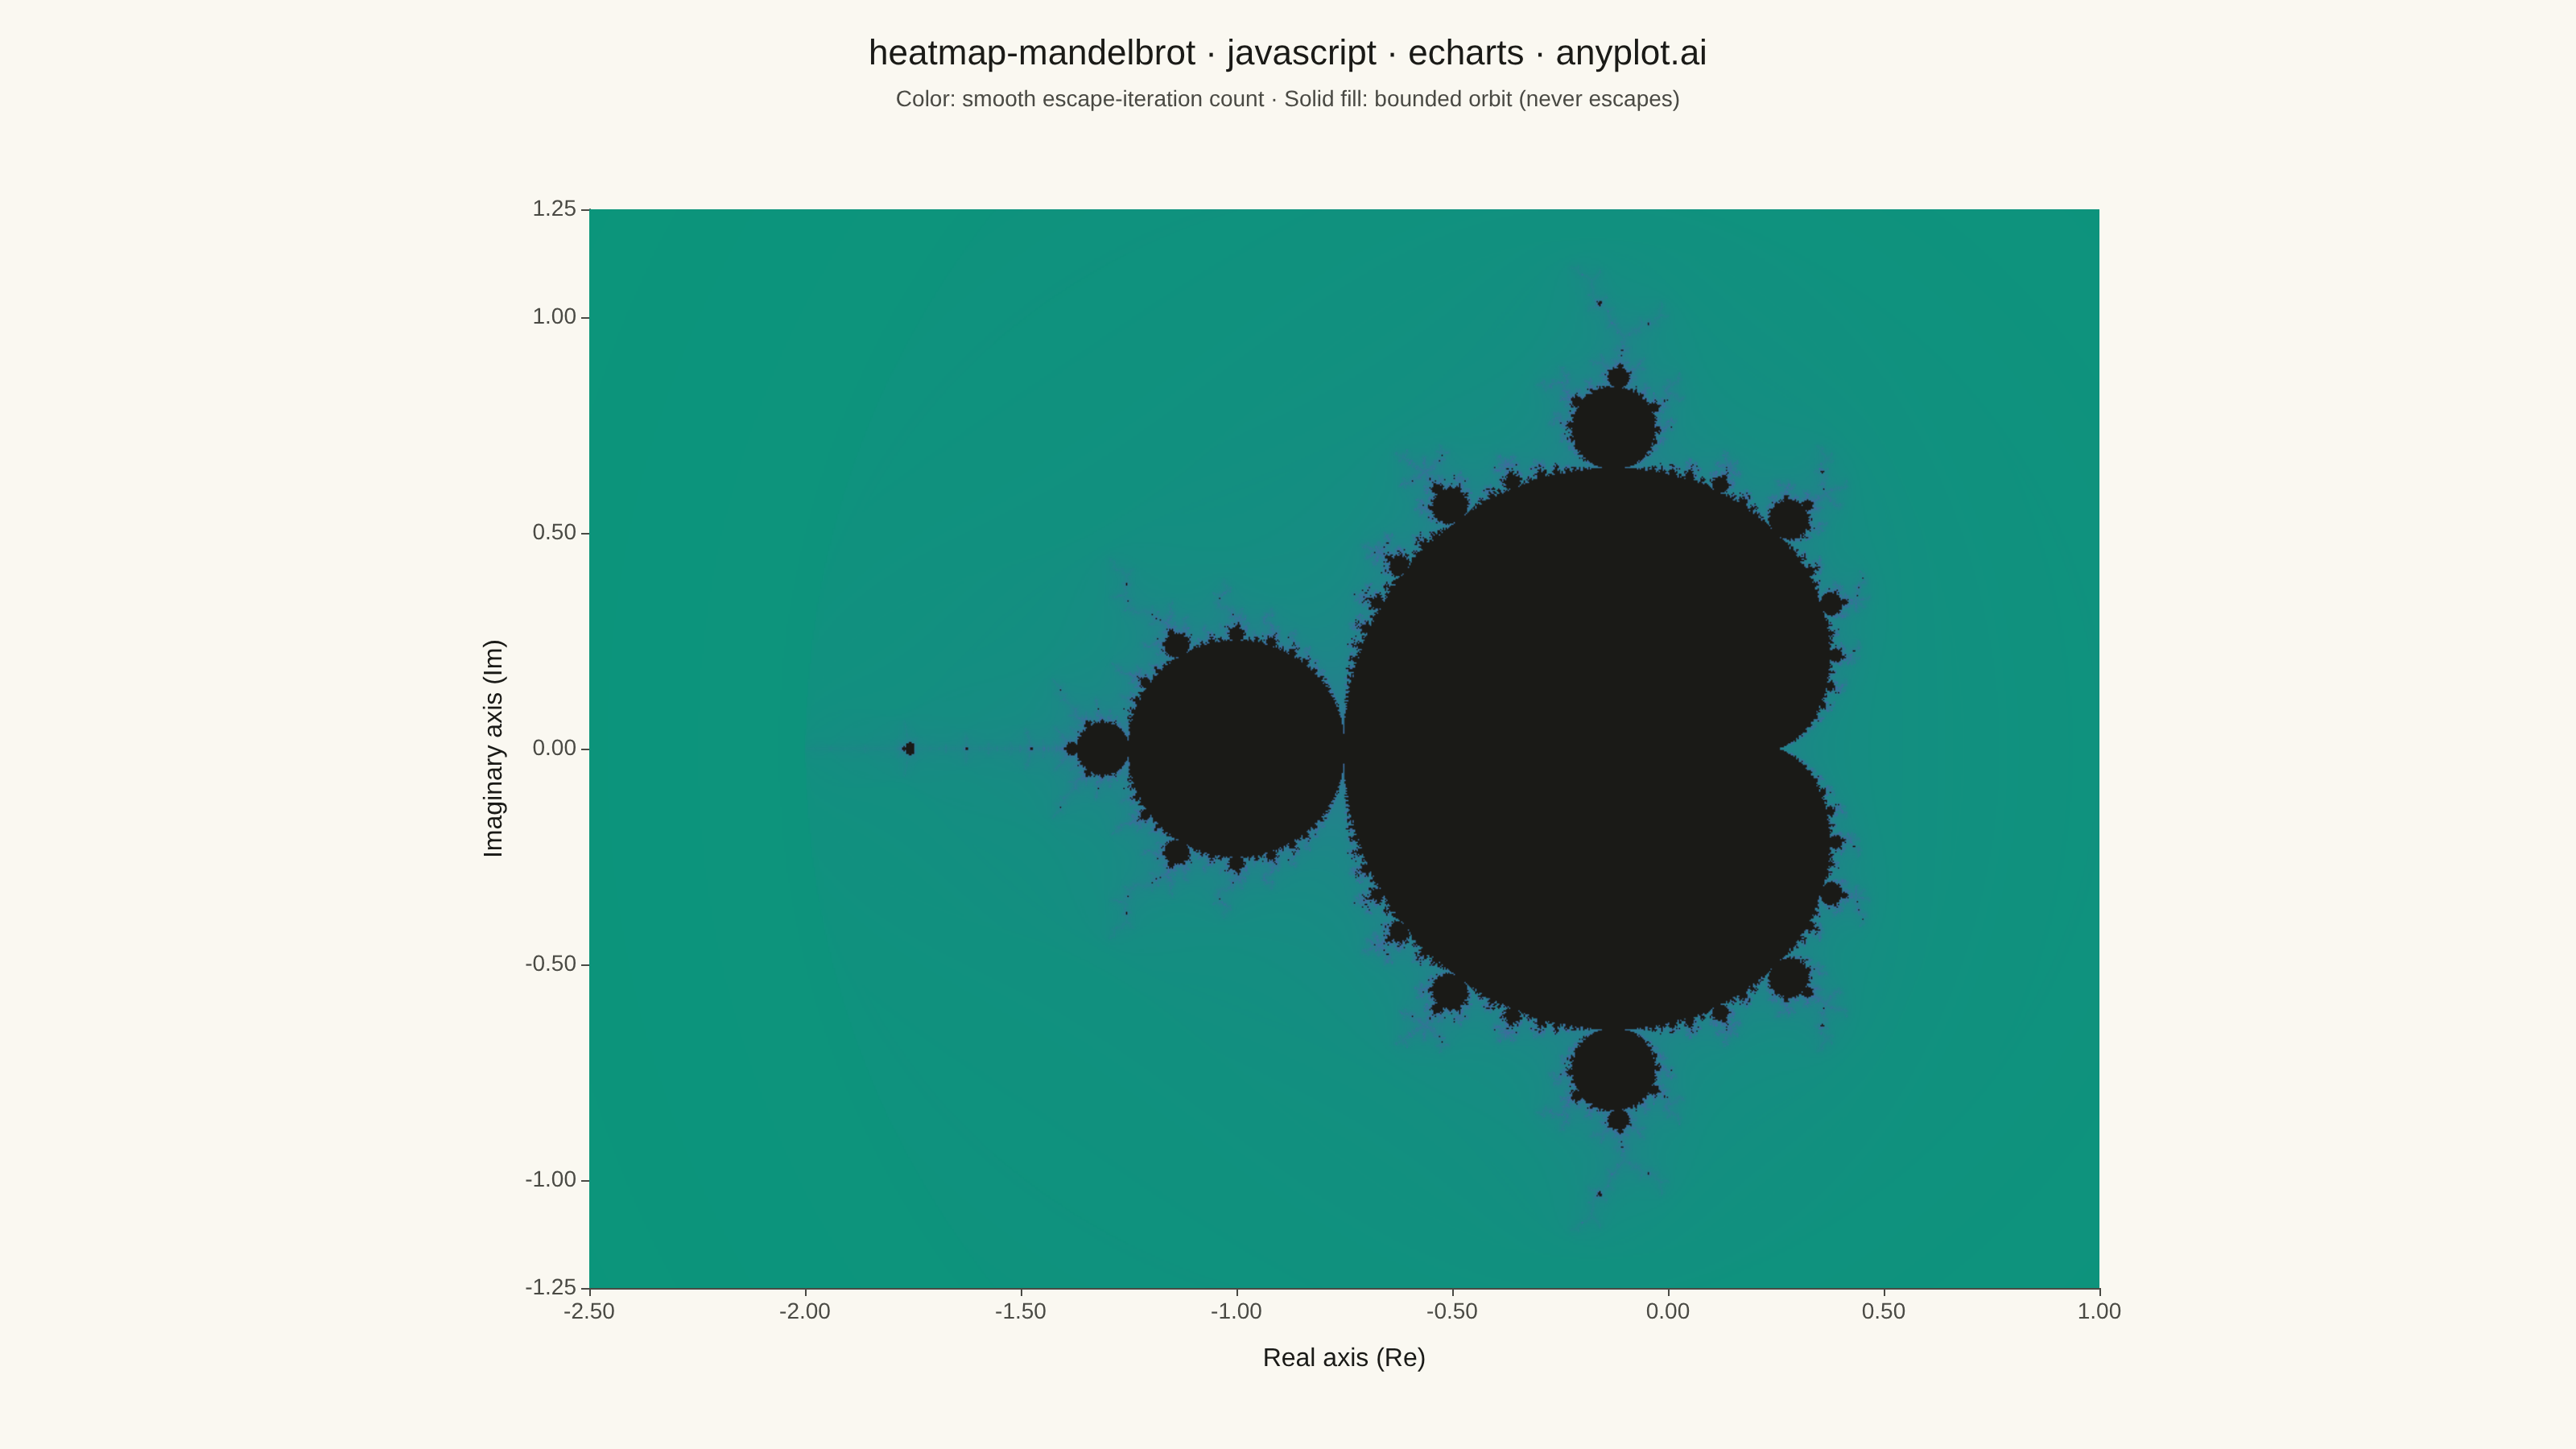
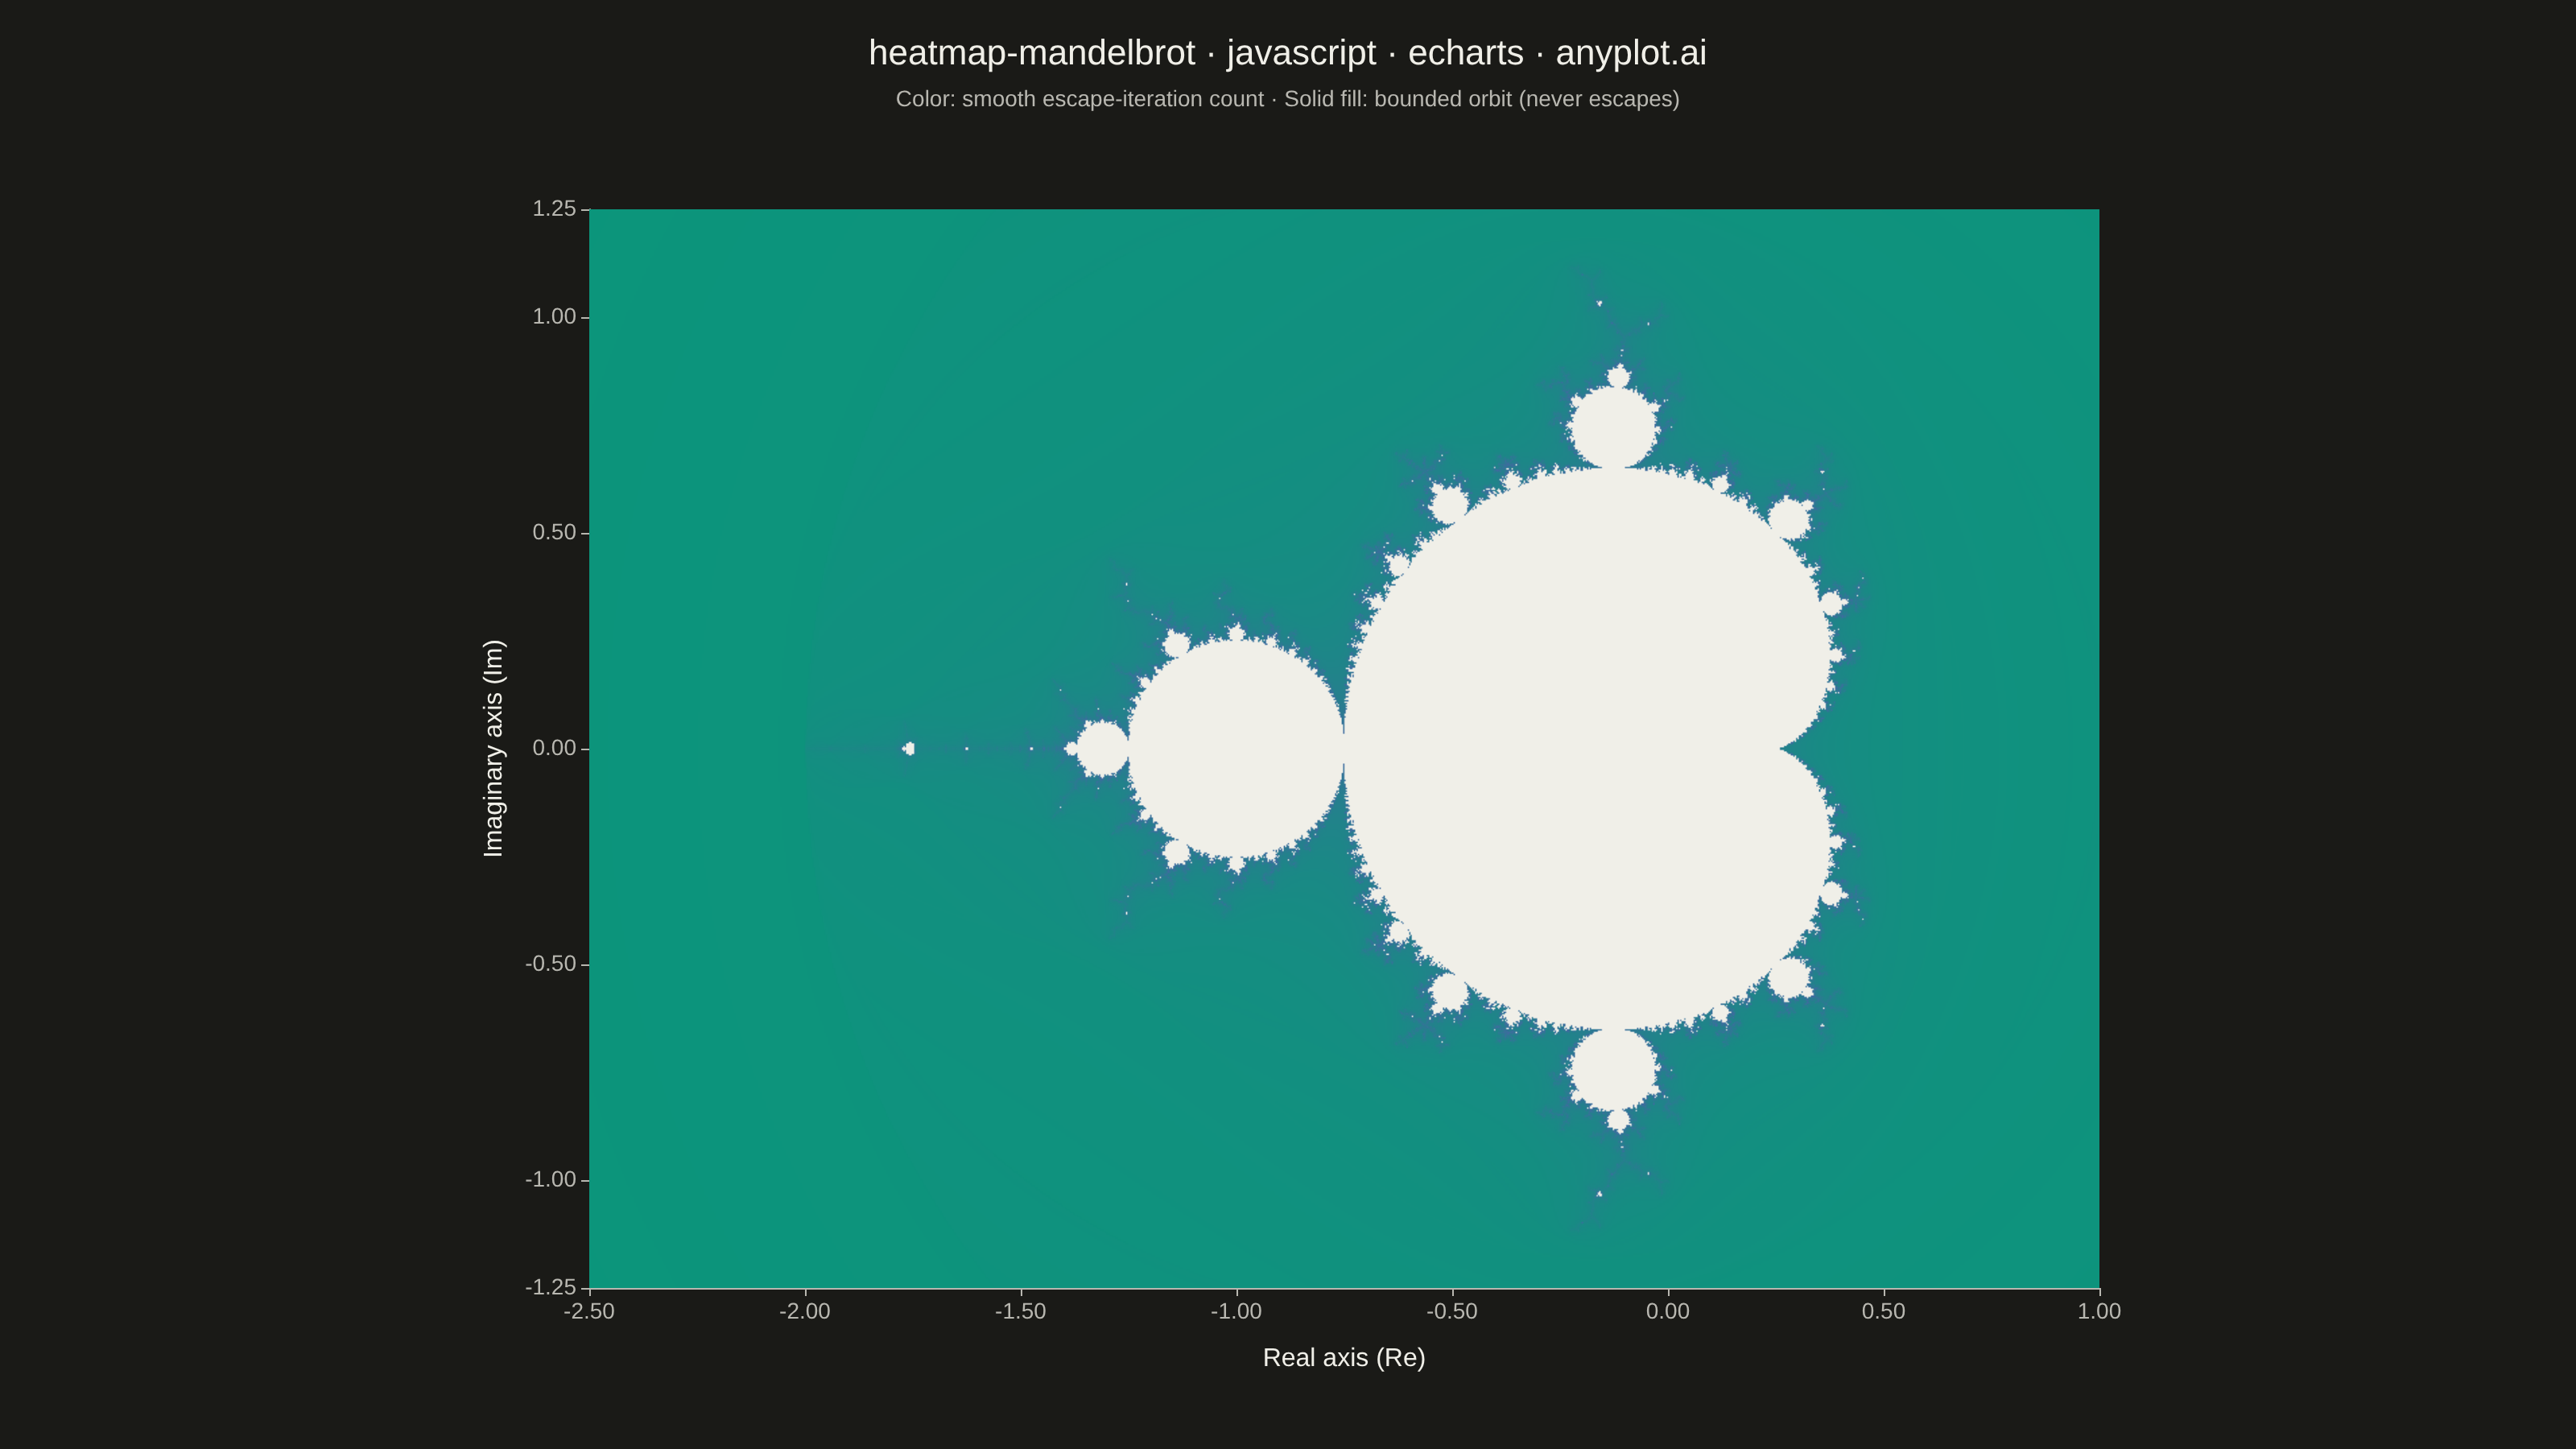
The same plot in 14 other libraries — JavaScript: Chart.js, D3.js, Highcharts, MUI X Charts; Python: Altair, Bokeh, lets-plot, Matplotlib, Plotly, plotnine, Pygal, Seaborn; R: ggplot2; Julia: Makie.jl. Compare all 15 side by side: Mandelbrot Set Fractal Visualization in Python, R, Julia and JavaScript.
A visualization of the Mandelbrot set, the most iconic fractal in mathematics. Each pixel represents a complex number c on the complex plane, colored by how quickly the iteration z(n+1) = z(n)^2 + c diverges. The boundary between convergent and divergent regions reveals infinitely complex, self-similar structure including the characteristic cardioid and period-2 bulb.
// anyplot.ai
// heatmap-mandelbrot: Mandelbrot Set Fractal Visualization
// Library: echarts 6.1.0 | JavaScript 22.23.2
// Quality: 82/100 | Created: 2026-08-25

//# anyplot-orientation: landscape
const t = window.ANYPLOT_TOKENS;
const size = window.ANYPLOT_SIZE || { width: 1600, height: 900 };

// --- Complex-plane window & escape parameters -------------------------------
const X_MIN = -2.5;
const X_MAX = 1.0;
const Y_MIN = -1.25;
const Y_MAX = 1.25;
const MAX_ITER = 100;
const DATA_ASPECT = (X_MAX - X_MIN) / (Y_MAX - Y_MIN);

// --- Raster resolution (>= spec's 800x600 minimum, matches the plane's aspect) --
const GRID_H = 800;
const GRID_W = Math.round(GRID_H * DATA_ASPECT);

// --- Colors: Imprint sequential gradient for escaped points, a fixed solid --
// --- color for the bounded interior (a data color, so it must stay identical
// --- across themes rather than following the theme-adaptive ink token) ------
function hexToRgb(hex) {
  const n = parseInt(hex.slice(1), 16);
  return [(n >> 16) & 255, (n >> 8) & 255, n & 255];
}
const seqStart = hexToRgb(t.seq[0]);
const seqEnd = hexToRgb(t.seq[1]);
const insideRgb = hexToRgb("#1A1A17");

// z(n+1) = z(n)^2 + c, smooth-colored via the normalized (fractional) escape
// count so bands don't appear at integer iteration boundaries.
function escapeColor(cx, cy) {
  let zx = 0;
  let zy = 0;
  let n = 0;
  while (zx * zx + zy * zy <= 4 && n < MAX_ITER) {
    const zxNext = zx * zx - zy * zy + cx;
    zy = 2 * zx * zy + cy;
    zx = zxNext;
    n++;
  }
  if (n === MAX_ITER) return insideRgb;
  const logZn = Math.log(zx * zx + zy * zy) / 2;
  const smoothN = n + 1 - Math.log(logZn / Math.LN2) / Math.LN2;
  // Gentle gamma so mid-range iteration counts don't crowd the dark end.
  const frac = Math.pow(Math.max(0, Math.min(1, smoothN / MAX_ITER)), 0.42);
  return [
    Math.round(seqStart[0] + (seqEnd[0] - seqStart[0]) * frac),
    Math.round(seqStart[1] + (seqEnd[1] - seqStart[1]) * frac),
    Math.round(seqStart[2] + (seqEnd[2] - seqStart[2]) * frac),
  ];
}

// --- Render the raster once into an offscreen canvas -------------------------
const raster = document.createElement("canvas");
raster.width = GRID_W;
raster.height = GRID_H;
const rasterCtx = raster.getContext("2d");
const imageData = rasterCtx.createImageData(GRID_W, GRID_H);
for (let row = 0; row < GRID_H; row++) {
  const cy = Y_MAX - (row / (GRID_H - 1)) * (Y_MAX - Y_MIN);
  for (let col = 0; col < GRID_W; col++) {
    const cx = X_MIN + (col / (GRID_W - 1)) * (X_MAX - X_MIN);
    const [r, g, b] = escapeColor(cx, cy);
    const idx = (row * GRID_W + col) * 4;
    imageData.data[idx] = r;
    imageData.data[idx + 1] = g;
    imageData.data[idx + 2] = b;
    imageData.data[idx + 3] = 255;
  }
}
rasterCtx.putImageData(imageData, 0, 0);
const fractalImage = raster.toDataURL("image/png");

// --- Fit the plane's true aspect ratio inside the mount (letterboxed) --------
const MARGIN = { top: 130, bottom: 100, left: 120, right: 50 };
const availW = size.width - MARGIN.left - MARGIN.right;
const availH = size.height - MARGIN.top - MARGIN.bottom;
let plotW = availW;
let plotH = plotW / DATA_ASPECT;
if (plotH > availH) {
  plotH = availH;
  plotW = plotH * DATA_ASPECT;
}
const padW = (availW - plotW) / 2;
const padH = (availH - plotH) / 2;
const gridLeft = MARGIN.left + padW;
const gridRight = MARGIN.right + padW;
const gridTop = MARGIN.top + padH;
const gridBottom = MARGIN.bottom + padH;

// --- Init ---------------------------------------------------------------------
const chart = echarts.init(document.getElementById("container"));

// --- Option ---------------------------------------------------------------------
chart.setOption({
  animation: false,
  backgroundColor: "transparent",
  title: {
    text: "heatmap-mandelbrot · javascript · echarts · anyplot.ai",
    subtext: "Color: smooth escape-iteration count · Solid fill: bounded orbit (never escapes)",
    left: "center",
    top: 18,
    textStyle: { color: t.ink, fontSize: 22, fontWeight: 500 },
    subtextStyle: { color: t.inkSoft, fontSize: 14 },
  },
  grid: { left: gridLeft, right: gridRight, top: gridTop, bottom: gridBottom },
  xAxis: {
    type: "value",
    min: X_MIN,
    max: X_MAX,
    name: "Real axis (Re)",
    nameLocation: "middle",
    nameGap: 36,
    nameTextStyle: { color: t.ink, fontSize: 16 },
    axisLabel: { color: t.inkSoft, fontSize: 14, formatter: (v) => v.toFixed(2) },
    axisLine: { onZero: false, lineStyle: { color: t.inkSoft } },
    axisTick: { onZero: false, lineStyle: { color: t.inkSoft } },
    splitLine: { show: false },
  },
  yAxis: {
    type: "value",
    min: Y_MIN,
    max: Y_MAX,
    name: "Imaginary axis (Im)",
    nameLocation: "middle",
    nameGap: 46,
    nameTextStyle: { color: t.ink, fontSize: 16 },
    axisLabel: { color: t.inkSoft, fontSize: 14, formatter: (v) => v.toFixed(2) },
    axisLine: { onZero: false, lineStyle: { color: t.inkSoft } },
    axisTick: { onZero: false, lineStyle: { color: t.inkSoft } },
    splitLine: { show: false },
  },
  series: [
    {
      type: "custom",
      coordinateSystem: "cartesian2d",
      data: [[X_MIN, Y_MIN, 0]],
      renderItem: (_params, api) => {
        const corner1 = api.coord([X_MIN, Y_MIN]);
        const corner2 = api.coord([X_MAX, Y_MAX]);
        return {
          type: "image",
          style: {
            image: fractalImage,
            x: Math.min(corner1[0], corner2[0]),
            y: Math.min(corner1[1], corner2[1]),
            width: Math.abs(corner2[0] - corner1[0]),
            height: Math.abs(corner1[1] - corner2[1]),
          },
        };
      },
    },
  ],
});
chart.on("finished", () => {
  window.__anyplotReady = true;
});
Runnable source as JSON, for any HTTP client: https://api.anyplot.ai/specs/heatmap-mandelbrot/echarts/code. Any spec id and library id listed in llms-full.txt fit the same URL shape; every URL below is complete and callable.
{
  "spec_id": "heatmap-mandelbrot",
  "language": "javascript",
  "library": "echarts",
  "page": "https://anyplot.ai/heatmap-mandelbrot/javascript/echarts",
  "hub": "https://anyplot.ai/heatmap-mandelbrot",
  "code_json": "https://api.anyplot.ai/specs/heatmap-mandelbrot/echarts/code",
  "spec_json": "https://api.anyplot.ai/specs/heatmap-mandelbrot",
  "render_light_png": "https://storage.googleapis.com/anyplot-images/plots/heatmap-mandelbrot/javascript/echarts/plot-light.png",
  "render_dark_png": "https://storage.googleapis.com/anyplot-images/plots/heatmap-mandelbrot/javascript/echarts/plot-dark.png",
  "interactive_light_html": "https://storage.googleapis.com/anyplot-images/plots/heatmap-mandelbrot/javascript/echarts/plot-light.html",
  "interactive_dark_html": "https://storage.googleapis.com/anyplot-images/plots/heatmap-mandelbrot/javascript/echarts/plot-dark.html",
  "quality_score": 82.0,
  "license": "MIT",
  "guide": "https://anyplot.ai/llms.txt"
}
Part of Mandelbrot Set Fractal Visualization on anyplot.ai.