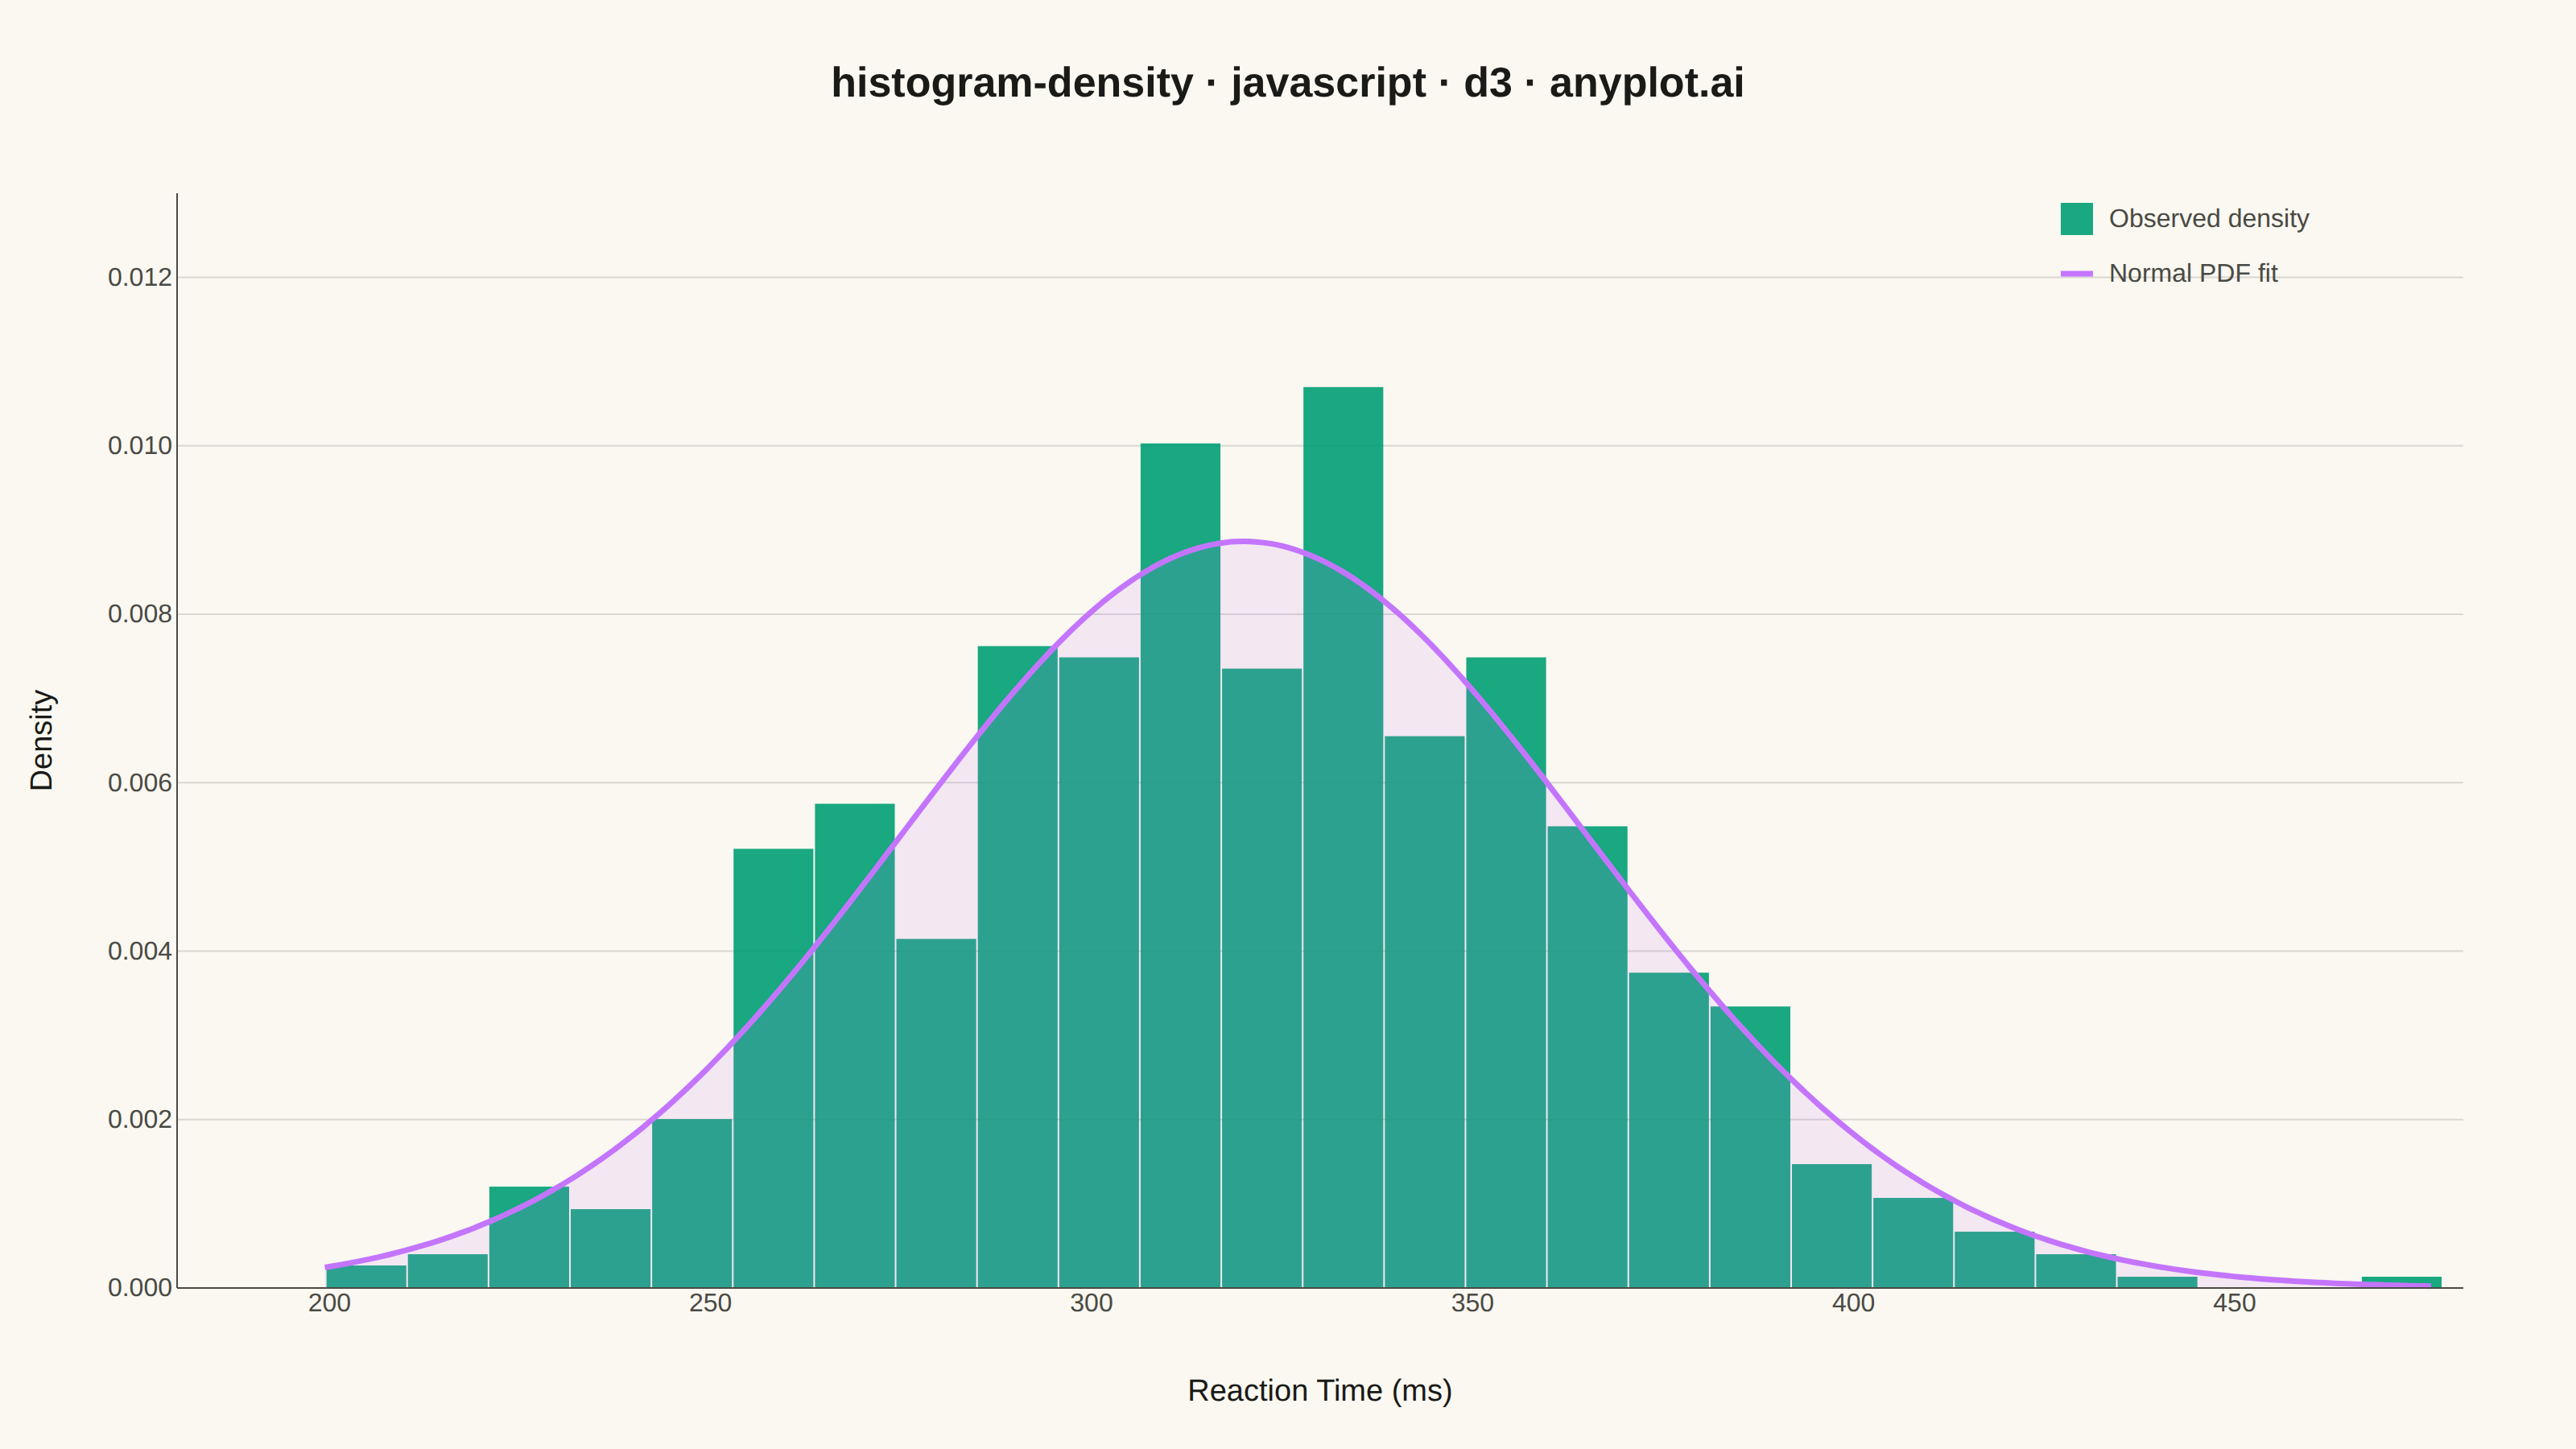
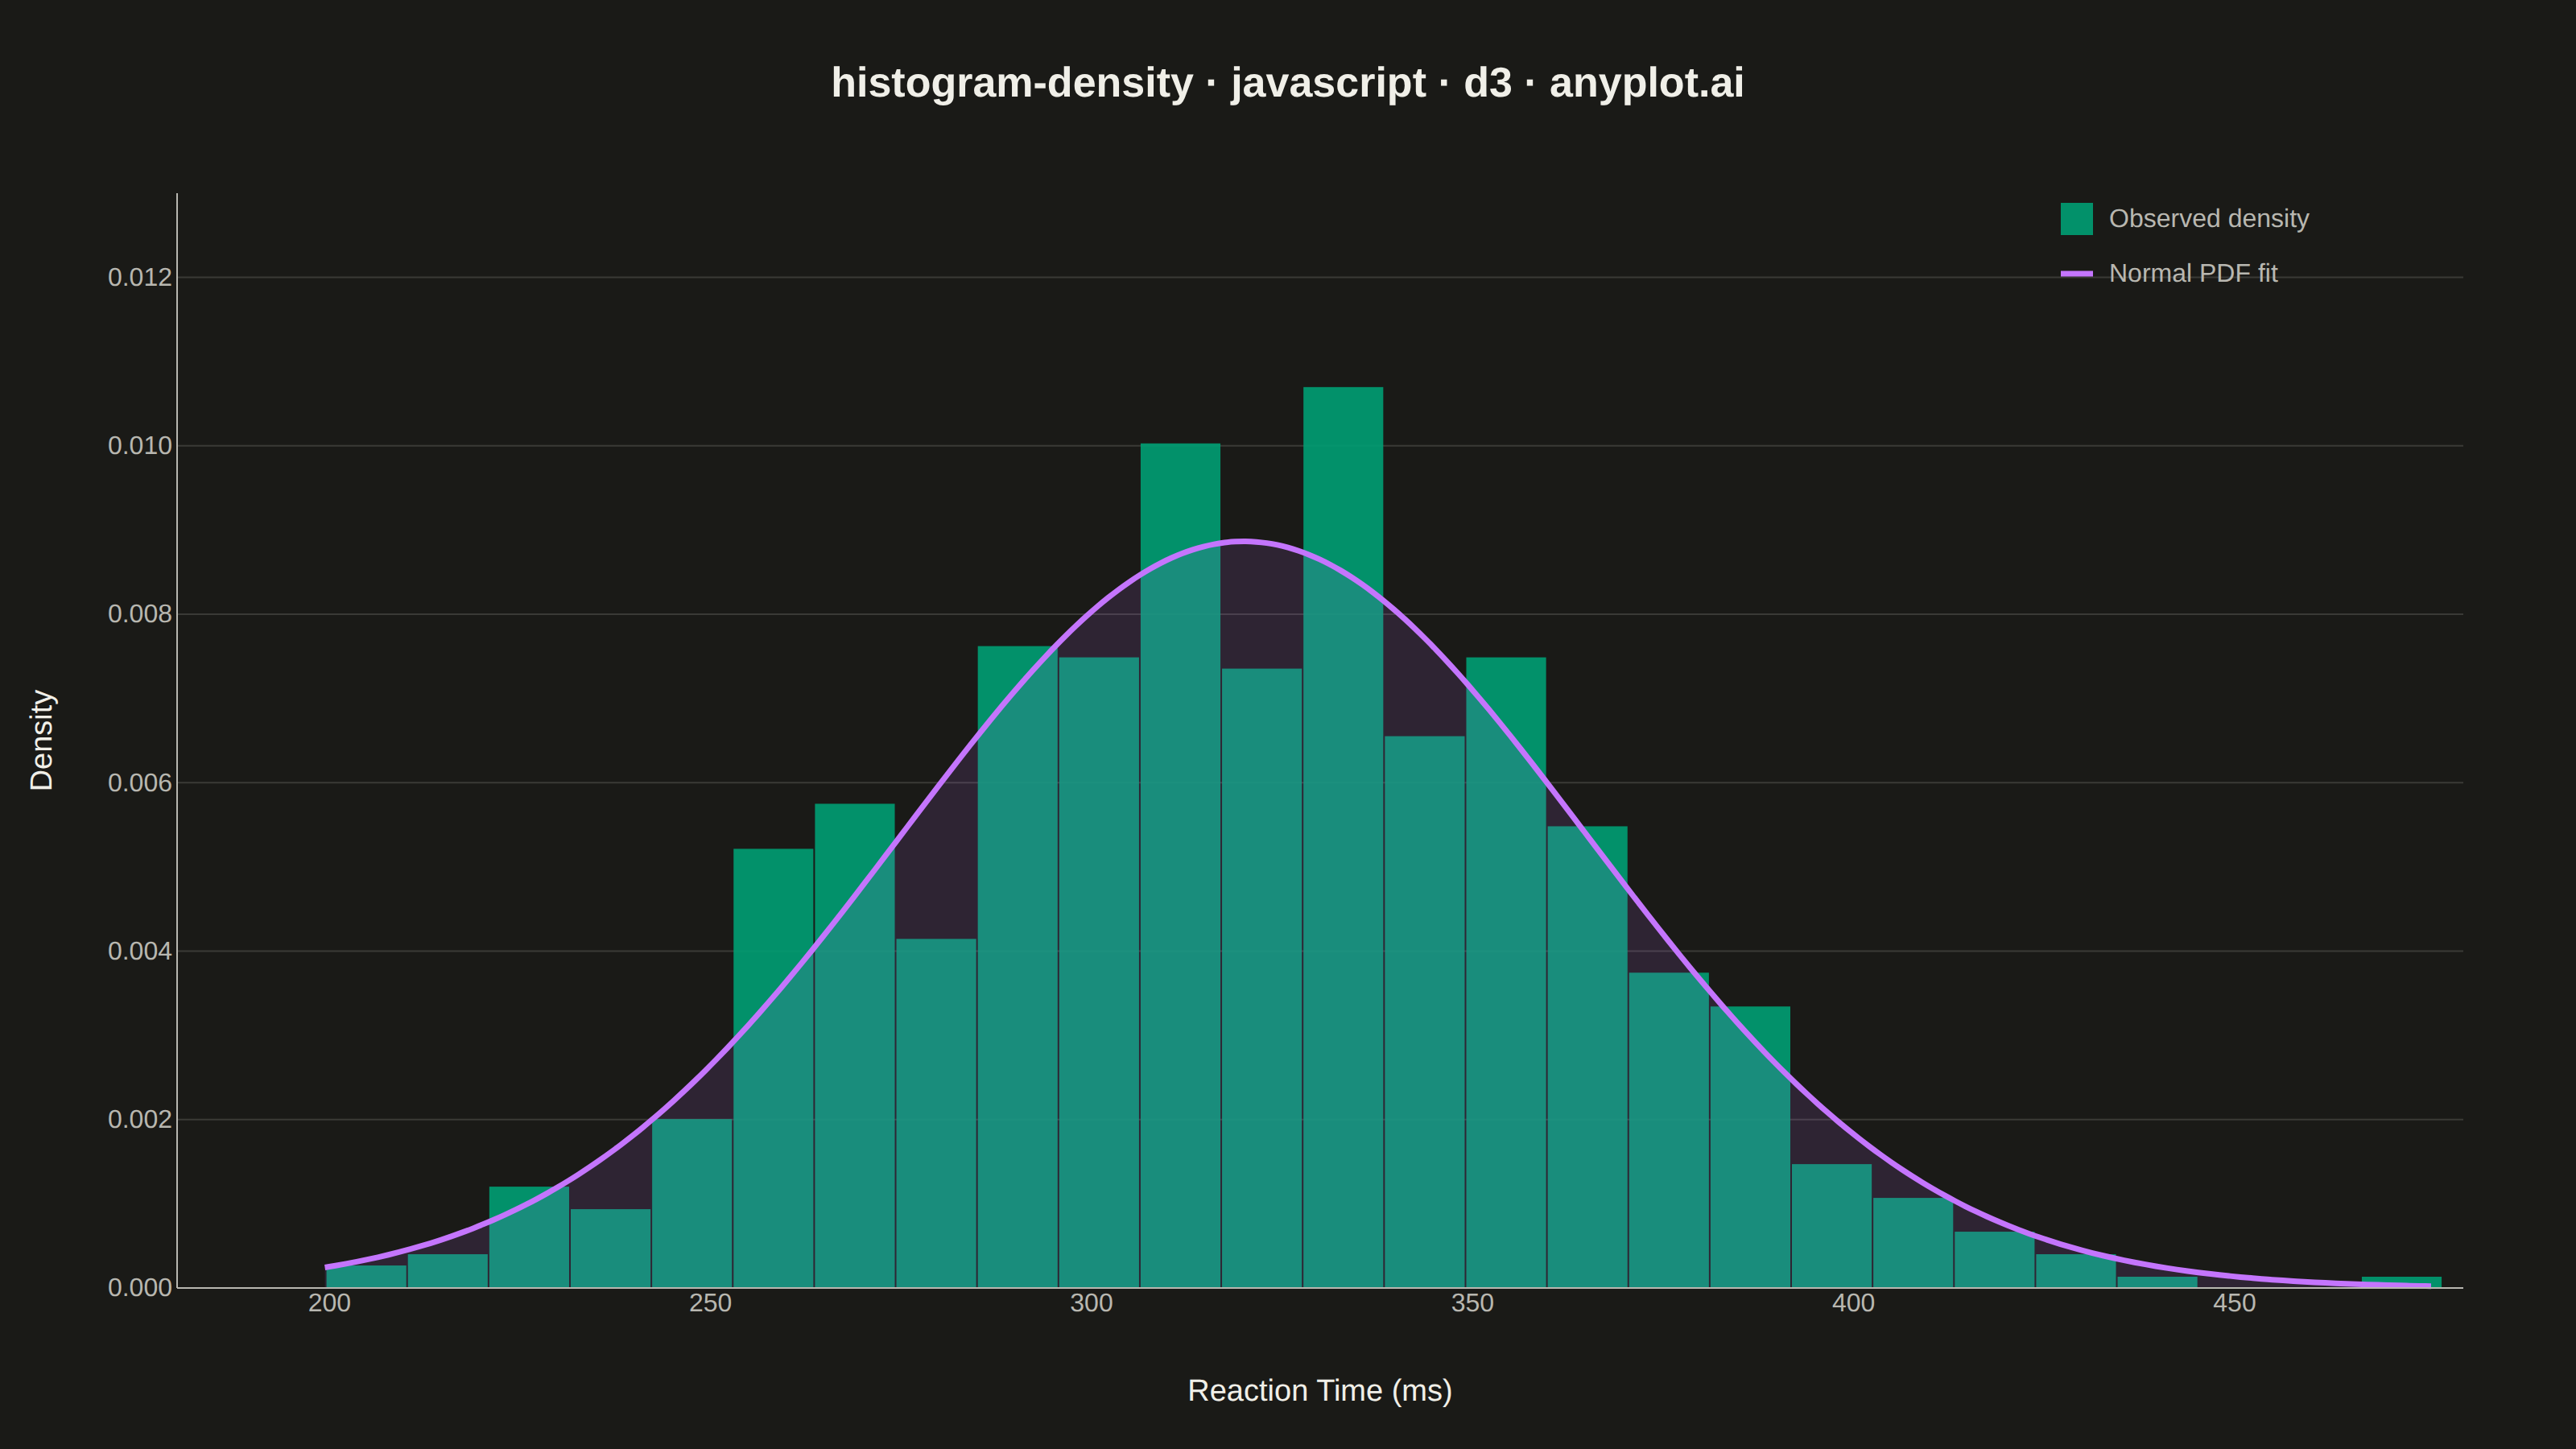
The same plot in 14 other libraries — JavaScript: Chart.js, Apache ECharts, Highcharts, MUI X Charts; Python: Altair, Bokeh, lets-plot, Matplotlib, Plotly, plotnine, Pygal, Seaborn; R: ggplot2; Julia: Makie.jl. Compare all 15 side by side: Density Histogram in Python, R, Julia and JavaScript.
A density histogram displays the distribution of a continuous variable normalized so that the total area under the histogram equals 1, representing probability density instead of raw counts. This normalization allows direct comparison between distributions with different sample sizes and enables overlaying theoretical probability density functions (PDFs) for statistical analysis.
// anyplot.ai
// histogram-density: Density Histogram
// Library: d3 7.9.0 | JavaScript 22.23.2
// Quality: 92/100 | Created: 2026-09-05

const t = window.ANYPLOT_TOKENS;
const { width, height } = window.ANYPLOT_SIZE;
const margin = { top: 120, right: 70, bottom: 100, left: 110 };
const iw = width - margin.left - margin.right;
const ih = height - margin.top - margin.bottom;

// --- Data: reaction times from a psychology experiment (ms), fixed-seed LCG -
function lcg(seed) {
  let state = seed;
  return () => {
    state = (state * 1664525 + 1013904223) % 4294967296;
    return state / 4294967296;
  };
}
const rand = lcg(42);
function randomNormal() {
  const u1 = Math.max(rand(), 1e-9);
  const u2 = rand();
  return Math.sqrt(-2 * Math.log(u1)) * Math.cos(2 * Math.PI * u2);
}

const MEAN = 320;
const STD = 45;
const N = 700;
const reactionTimes = Array.from({ length: N }, () => MEAN + STD * randomNormal());

// --- Histogram binning, normalized to probability density -------------------
// Built manually with equal-width bins — d3.bin()'s default threshold
// heuristic can leave a sliver-width edge bin, which spikes the density of a
// single stray sample.
const [dataMin, dataMax] = d3.extent(reactionTimes);
const NUM_BINS = 26;
const binWidth = (dataMax - dataMin) / NUM_BINS;
const counts = new Array(NUM_BINS).fill(0);
for (const v of reactionTimes) {
  const idx = Math.min(NUM_BINS - 1, Math.floor((v - dataMin) / binWidth));
  counts[idx] += 1;
}
const density = counts.map((count, i) => ({
  x0: dataMin + i * binWidth,
  x1: dataMin + (i + 1) * binWidth,
  y: count / (N * binWidth),
}));

// --- Theoretical normal PDF, fit from the same mean/std ---------------------
const pdf = (x) => Math.exp(-0.5 * ((x - MEAN) / STD) ** 2) / (STD * Math.sqrt(2 * Math.PI));
const pdfPoints = d3.range(dataMin, dataMax, (dataMax - dataMin) / 200).map((x) => ({ x, y: pdf(x) }));

// --- SVG mount ----------------------------------------------------------
const svg = d3.select("#container").append("svg").attr("width", width).attr("height", height);
const g = svg.append("g").attr("transform", `translate(${margin.left},${margin.top})`);

// --- Scales -------------------------------------------------------------
const x = d3.scaleLinear().domain([dataMin, dataMax]).nice().range([0, iw]);
const yMax = Math.max(d3.max(density, (d) => d.y), d3.max(pdfPoints, (d) => d.y));
const y = d3.scaleLinear().domain([0, yMax * 1.15]).nice().range([ih, 0]);

// --- Y-axis grid (bar chart convention: horizontal only) ---------------------
g.append("g")
  .call(d3.axisLeft(y).ticks(6).tickSize(-iw).tickFormat(""))
  .call((sel) => sel.select(".domain").remove())
  .selectAll("line")
  .attr("stroke", t.grid);

// --- Bars: observed density ---------------------------------------------
g.selectAll("rect")
  .data(density)
  .join("rect")
  .attr("x", (d) => x(d.x0) + 1)
  .attr("y", (d) => y(d.y))
  .attr("width", (d) => Math.max(0, x(d.x1) - x(d.x0) - 1))
  .attr("height", (d) => ih - y(d.y))
  .attr("fill", t.palette[0])
  .attr("opacity", 0.9);

// --- Theoretical PDF overlay ----------------------------------------------
// Subtle area fill under the curve reinforces the empirical-vs-theoretical
// comparison at a glance, beyond the line alone.
const area = d3.area().x((d) => x(d.x)).y0(ih).y1((d) => y(d.y)).curve(d3.curveNatural);
g.append("path").datum(pdfPoints).attr("fill", t.palette[1]).attr("opacity", 0.12).attr("d", area);

const line = d3.line().x((d) => x(d.x)).y((d) => y(d.y)).curve(d3.curveNatural);
g.append("path").datum(pdfPoints).attr("fill", "none").attr("stroke", t.palette[1]).attr("stroke-width", 3.5).attr("d", line);

// --- Axes -----------------------------------------------------------------
const xAxis = g.append("g").attr("transform", `translate(0,${ih})`).call(d3.axisBottom(x).ticks(8).tickSize(0));
const yAxis = g.append("g").call(d3.axisLeft(y).ticks(6).tickSize(0));
for (const ax of [xAxis, yAxis]) {
  ax.selectAll("text").attr("fill", t.inkSoft).style("font-size", "16px");
  ax.select(".domain").attr("stroke", t.inkSoft);
}

// --- Axis labels ------------------------------------------------------------
g.append("text")
  .attr("x", iw / 2)
  .attr("y", ih + 70)
  .attr("text-anchor", "middle")
  .attr("fill", t.ink)
  .style("font-size", "19px")
  .text("Reaction Time (ms)");

g.append("text")
  .attr("transform", "rotate(-90)")
  .attr("x", -ih / 2)
  .attr("y", -78)
  .attr("text-anchor", "middle")
  .attr("fill", t.ink)
  .style("font-size", "19px")
  .text("Density");

// --- Legend -----------------------------------------------------------------
const legend = g.append("g").attr("transform", `translate(${iw - 250}, 6)`);
legend.append("rect").attr("width", 20).attr("height", 20).attr("fill", t.palette[0]).attr("opacity", 0.9);
legend.append("text").attr("x", 30).attr("y", 15).attr("fill", t.inkSoft).style("font-size", "16px").text("Observed density");
legend.append("line").attr("x1", 0).attr("x2", 20).attr("y1", 44).attr("y2", 44).attr("stroke", t.palette[1]).attr("stroke-width", 3.5);
legend.append("text").attr("x", 30).attr("y", 49).attr("fill", t.inkSoft).style("font-size", "16px").text("Normal PDF fit");

// --- Title --------------------------------------------------------------
svg
  .append("text")
  .attr("x", width / 2)
  .attr("y", 60)
  .attr("text-anchor", "middle")
  .attr("fill", t.ink)
  .style("font-size", "26px")
  .style("font-weight", "600")
  .text("histogram-density · javascript · d3 · anyplot.ai");
Runnable source as JSON, for any HTTP client: https://api.anyplot.ai/specs/histogram-density/d3/code. Any spec id and library id listed in llms-full.txt fit the same URL shape; every URL below is complete and callable.
{
  "spec_id": "histogram-density",
  "language": "javascript",
  "library": "d3",
  "page": "https://anyplot.ai/histogram-density/javascript/d3",
  "hub": "https://anyplot.ai/histogram-density",
  "code_json": "https://api.anyplot.ai/specs/histogram-density/d3/code",
  "spec_json": "https://api.anyplot.ai/specs/histogram-density",
  "render_light_png": "https://storage.googleapis.com/anyplot-images/plots/histogram-density/javascript/d3/plot-light.png",
  "render_dark_png": "https://storage.googleapis.com/anyplot-images/plots/histogram-density/javascript/d3/plot-dark.png",
  "interactive_light_html": "https://storage.googleapis.com/anyplot-images/plots/histogram-density/javascript/d3/plot-light.html",
  "interactive_dark_html": "https://storage.googleapis.com/anyplot-images/plots/histogram-density/javascript/d3/plot-dark.html",
  "quality_score": 92.0,
  "license": "MIT",
  "guide": "https://anyplot.ai/llms.txt"
}
Part of Density Histogram on anyplot.ai.