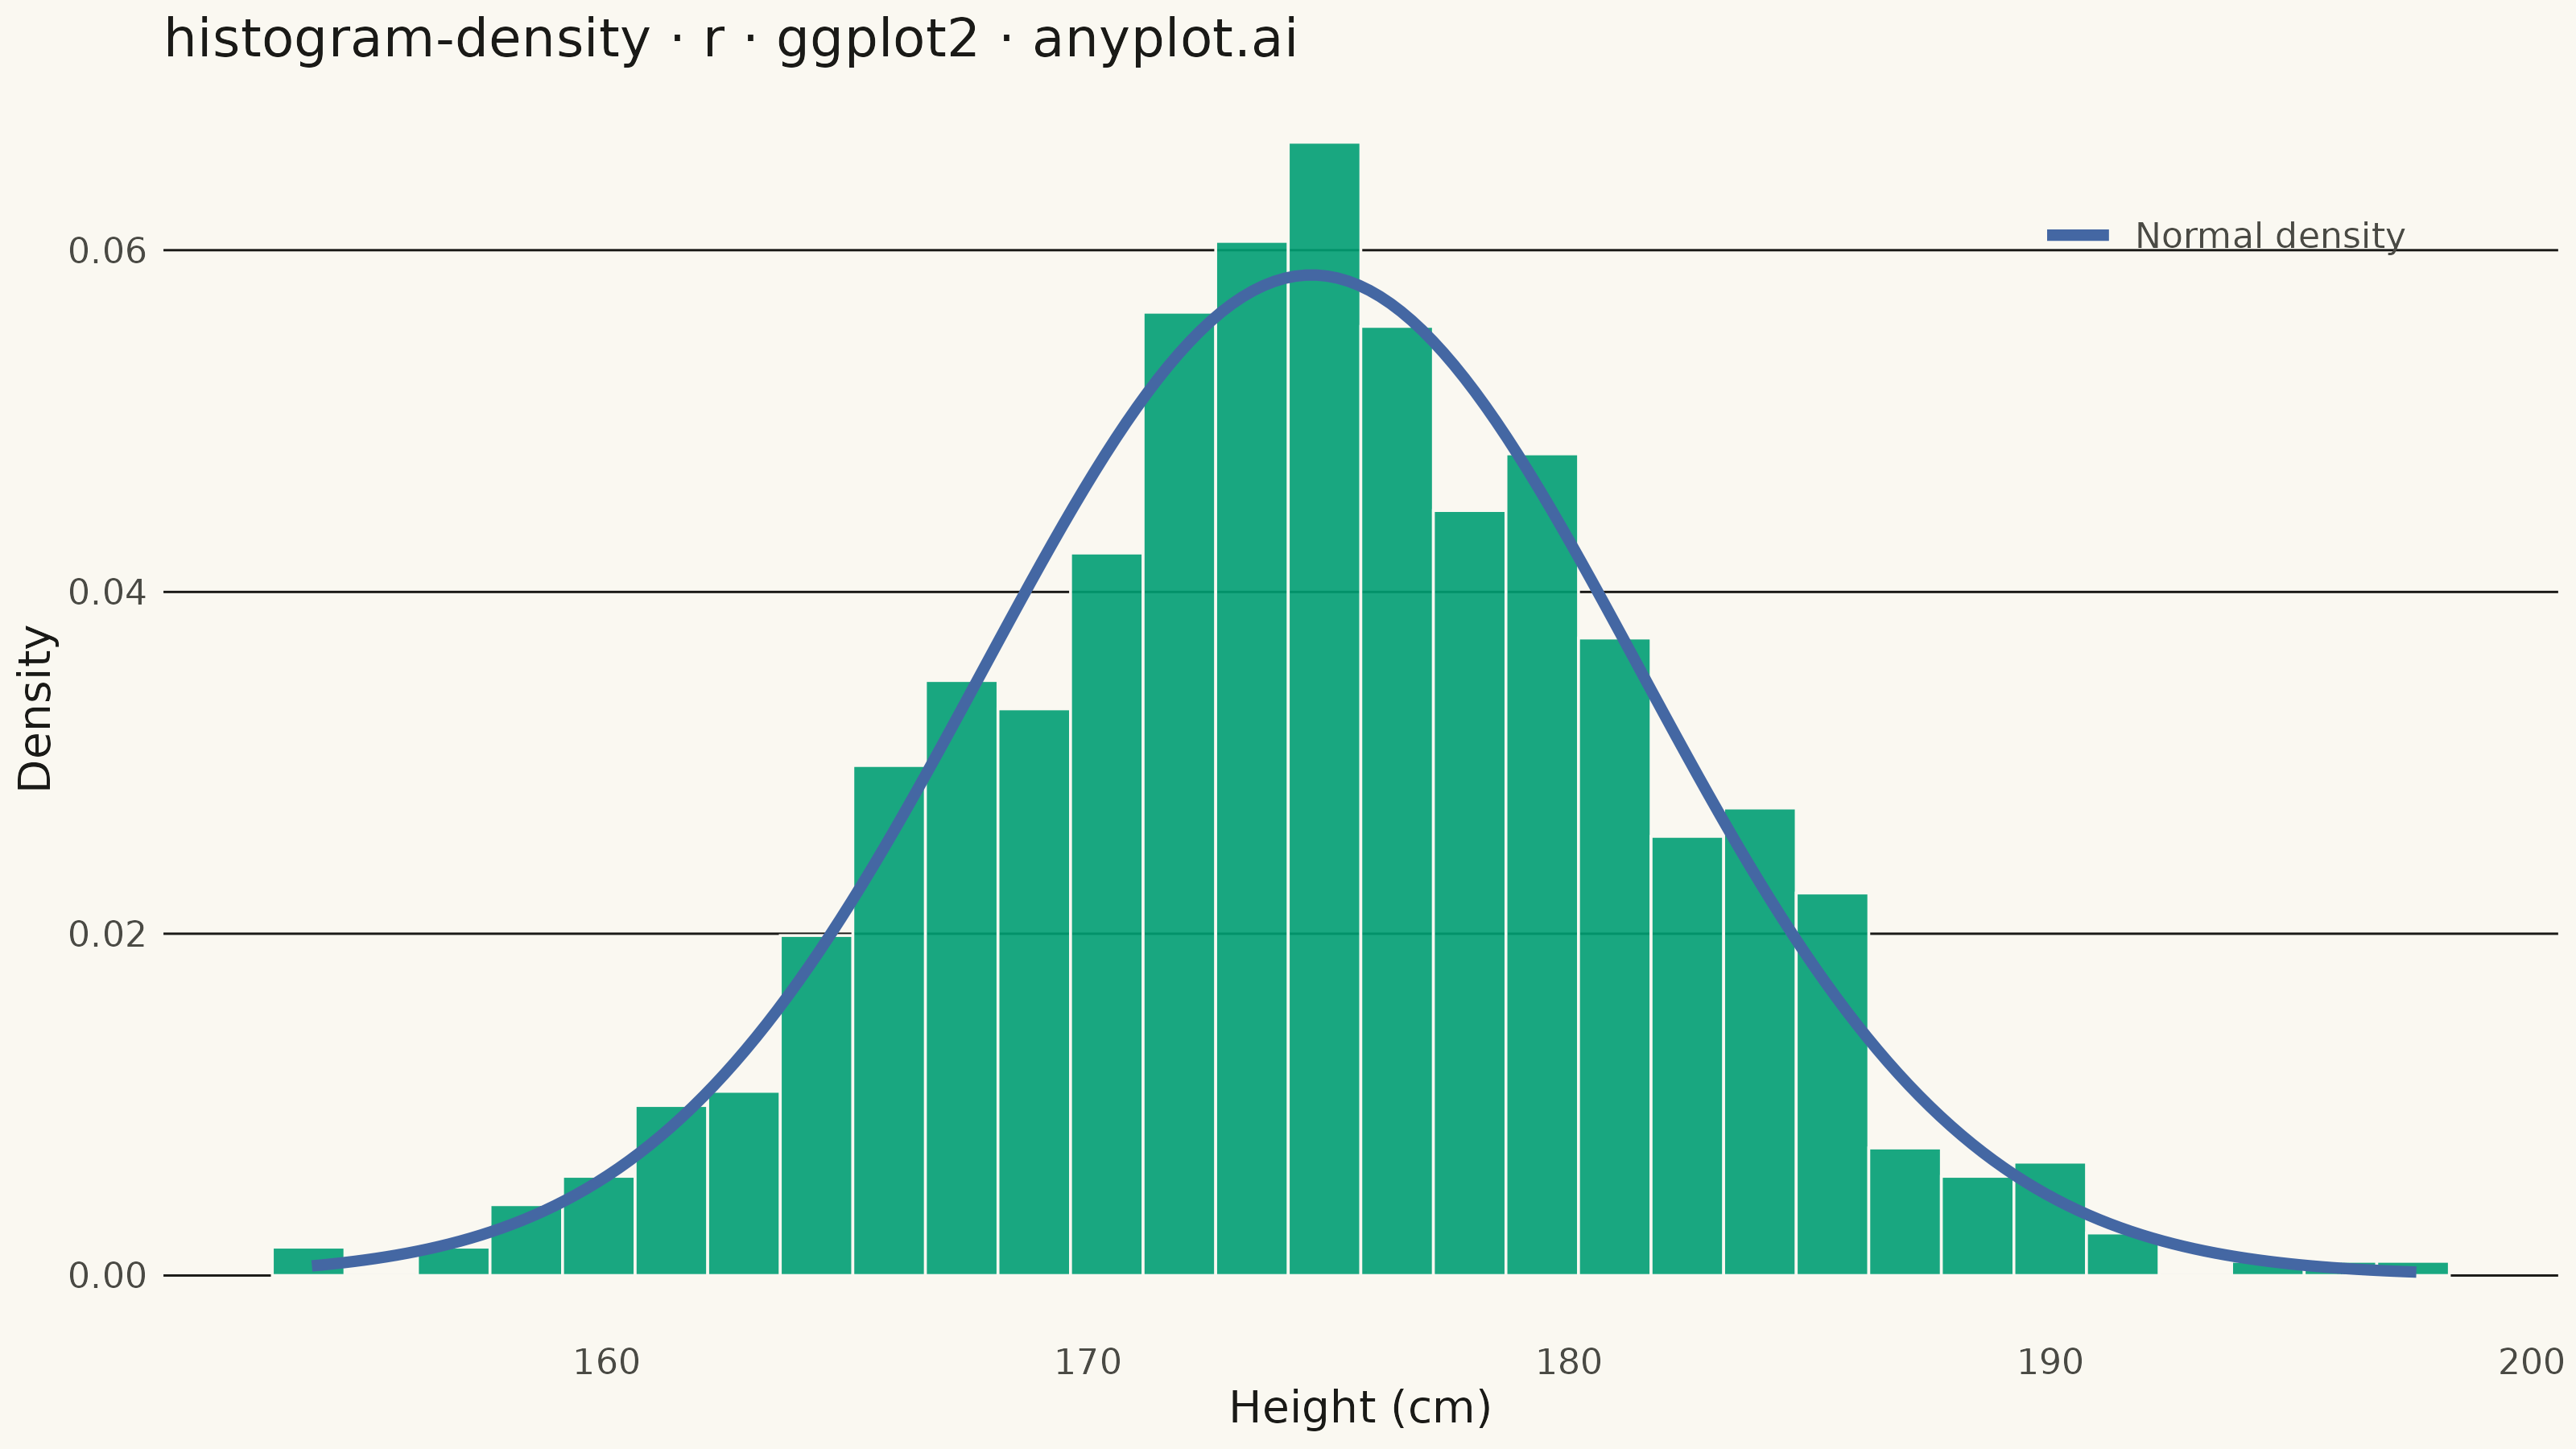
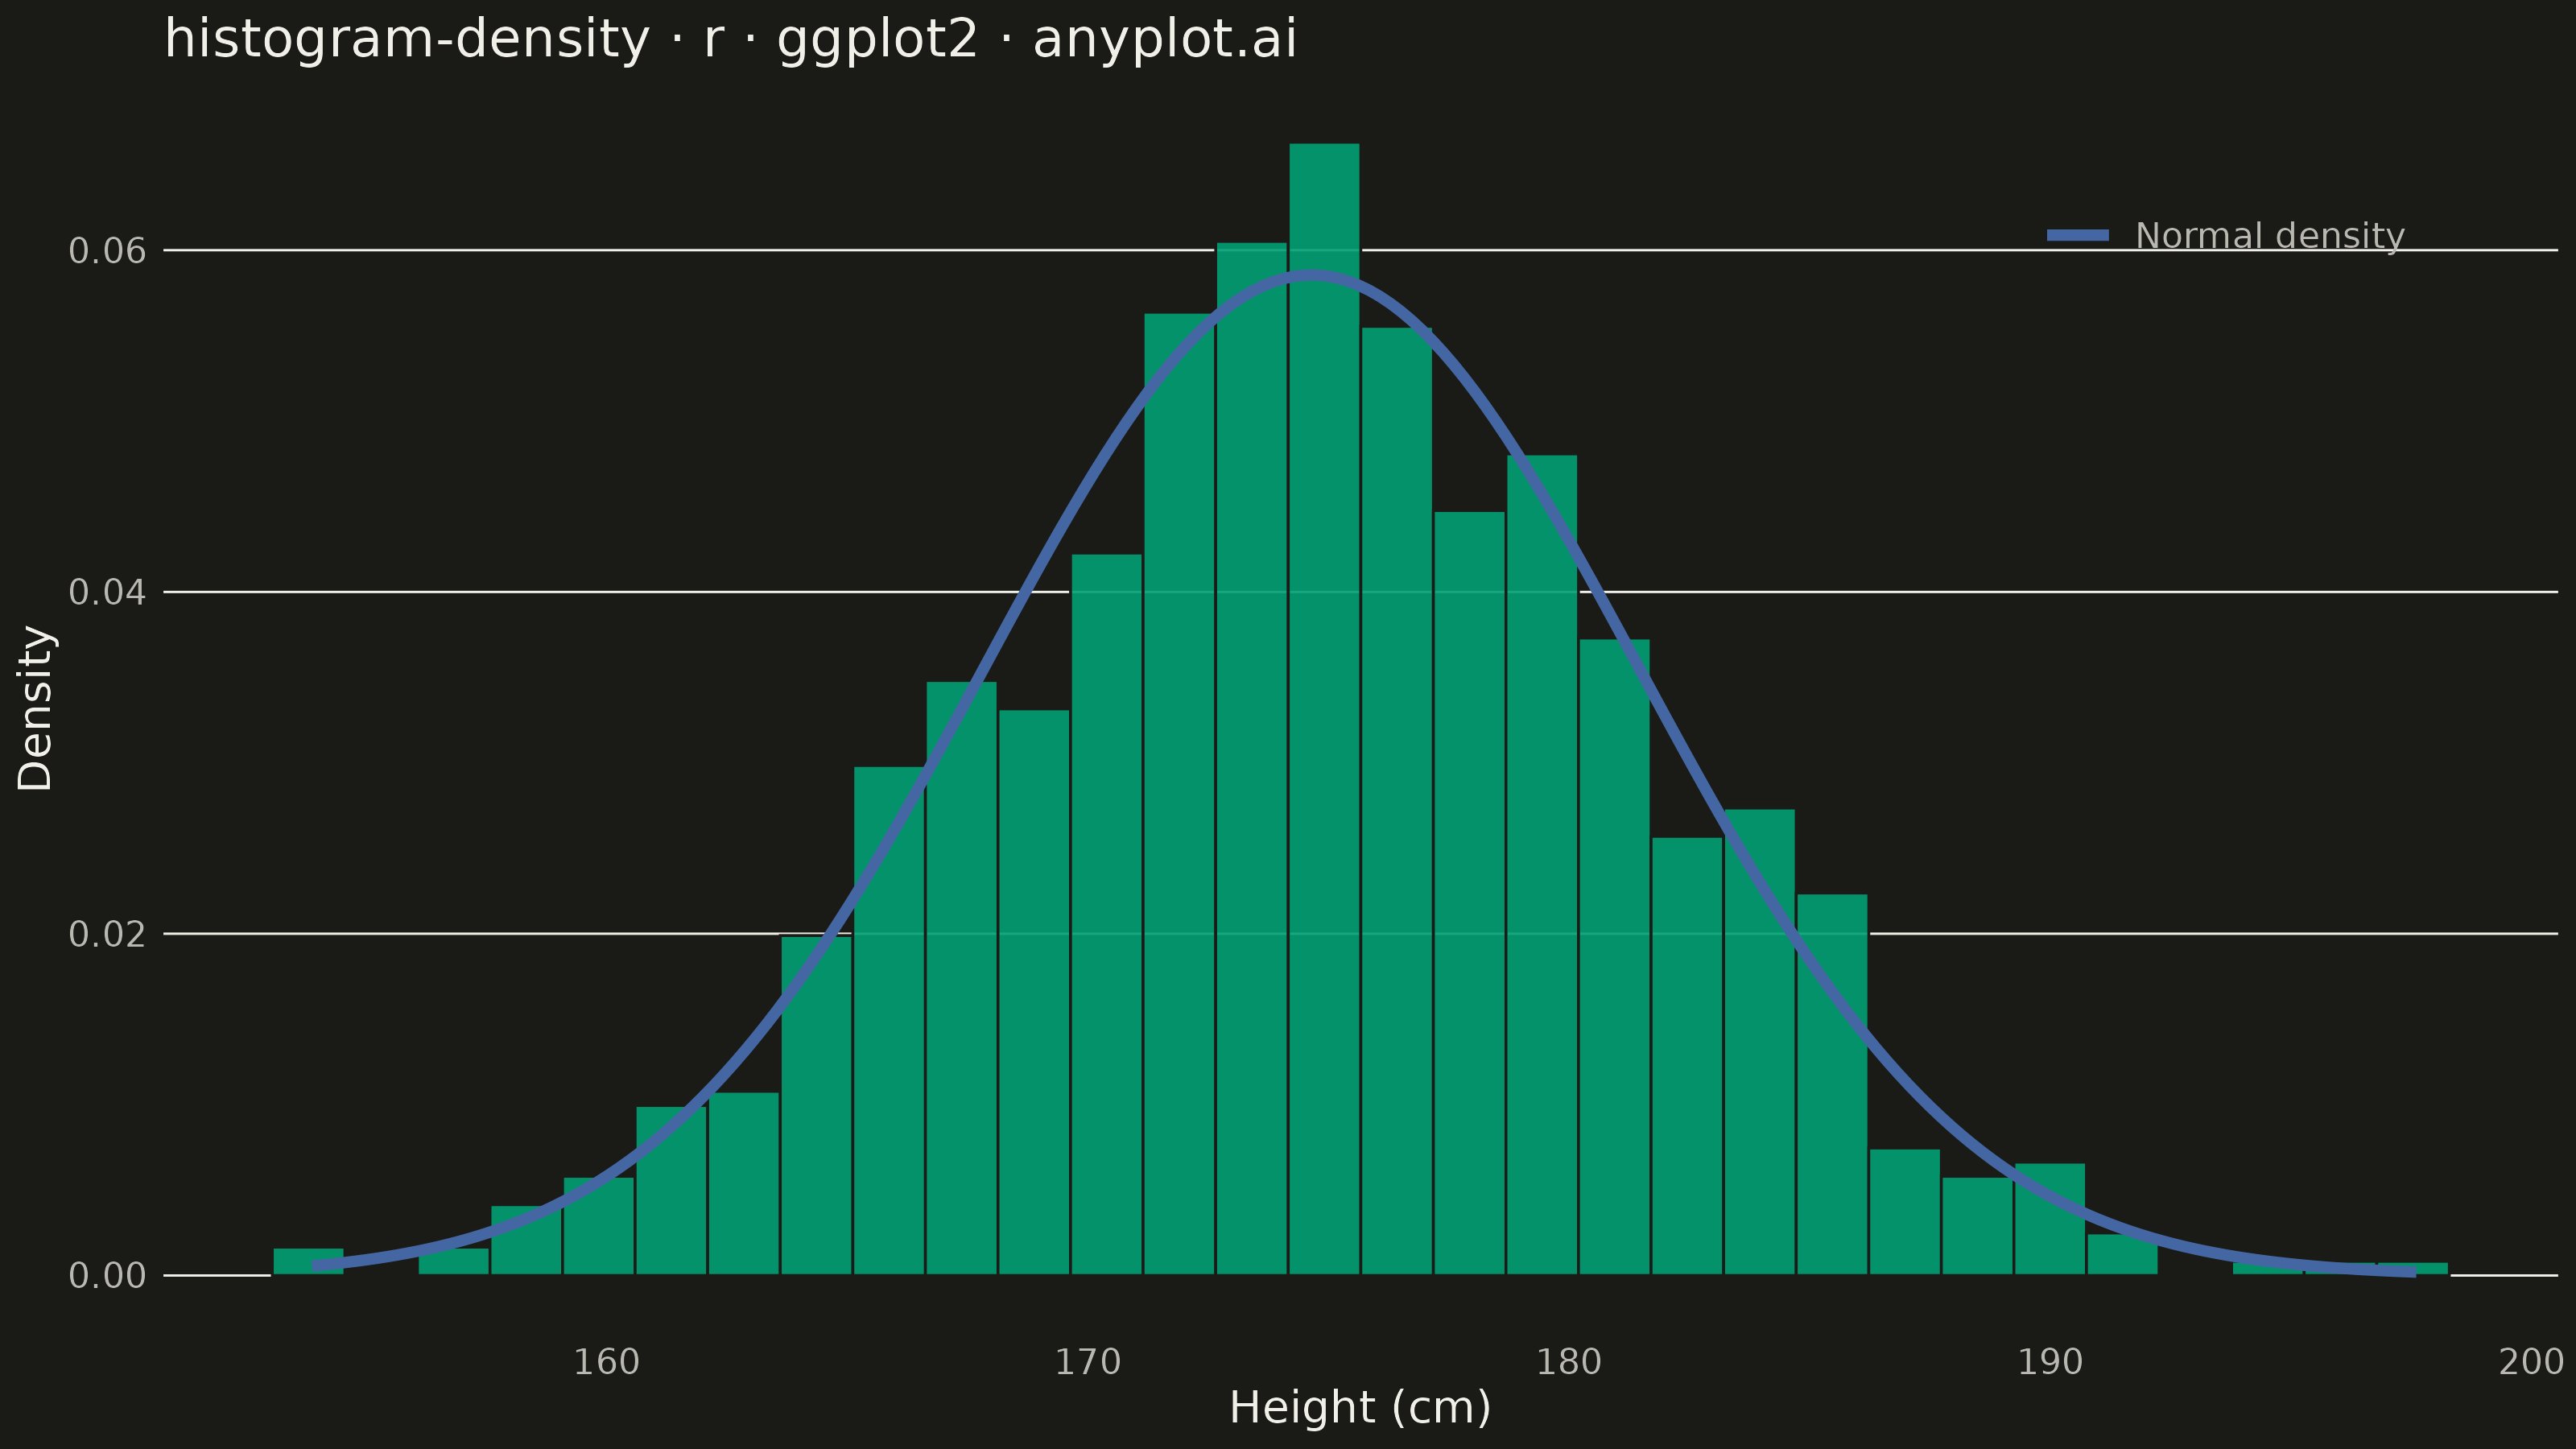
The same plot in 14 other libraries — Python: Altair, Bokeh, lets-plot, Matplotlib, Plotly, plotnine, Pygal, Seaborn; Julia: Makie.jl; JavaScript: Chart.js, D3.js, Apache ECharts, Highcharts, MUI X Charts. Compare all 15 side by side: Density Histogram in Python, R, Julia and JavaScript.
A density histogram displays the distribution of a continuous variable normalized so that the total area under the histogram equals 1, representing probability density instead of raw counts. This normalization allows direct comparison between distributions with different sample sizes and enables overlaying theoretical probability density functions (PDFs) for statistical analysis.
#' anyplot.ai
#' histogram-density: Density Histogram
#' Library: ggplot2 3.5.1 | R 4.4.1
#' Quality: 90/100 | Created: 2026-09-05

library(ggplot2)
library(dplyr)
library(ragg)

set.seed(42)

# --- Theme tokens -----------------------------------------------------------
THEME    <- Sys.getenv("ANYPLOT_THEME", "light")
PAGE_BG  <- if (THEME == "light") "#FAF8F1" else "#1A1A17"
INK      <- if (THEME == "light") "#1A1A17" else "#F0EFE8"
INK_SOFT <- if (THEME == "light") "#4A4A44" else "#B8B7B0"

# Imprint categorical palette (see prompts/default-style-guide.md)
IMPRINT_PALETTE <- c(
  "#009E73", # 1 — brand green, ALWAYS first series
  "#C475FD", # 2 — lavender
  "#4467A3"  # 3 — blue, used here for the fitted normal curve
)

# --- Data ---------------------------------------------------------------
# Simulated adult male height sample (cm) — a classic near-normal continuous
# measurement, well suited to demonstrating a density histogram against a
# fitted theoretical PDF.
heights <- tibble::tibble(height_cm = rnorm(800, mean = 175, sd = 7))

fit_mean <- mean(heights$height_cm)
fit_sd   <- sd(heights$height_cm)
pdf_curve <- tibble::tibble(
  x = seq(min(heights$height_cm), max(heights$height_cm), length.out = 200),
  y = dnorm(x, mean = fit_mean, sd = fit_sd)
)

# --- Plot -----------------------------------------------------------------
p <- ggplot(heights, aes(x = height_cm)) +
  geom_histogram(
    aes(y = after_stat(density)),
    bins = 30,
    fill = IMPRINT_PALETTE[1],
    color = PAGE_BG,
    linewidth = 0.3,
    alpha = 0.9
  ) +
  geom_line(
    data = pdf_curve,
    aes(x = x, y = y, color = "Normal density"),
    linewidth = 1.2
  ) +
  scale_color_manual(values = IMPRINT_PALETTE[3], name = NULL) +
  labs(
    title = "histogram-density · r · ggplot2 · anyplot.ai",
    x = "Height (cm)",
    y = "Density"
  ) +
  theme_minimal(base_size = 8) +
  theme(
    plot.background   = element_rect(fill = PAGE_BG, color = PAGE_BG),
    panel.background  = element_rect(fill = PAGE_BG, color = NA),
    panel.grid.major.x = element_blank(),
    panel.grid.minor   = element_blank(),
    panel.grid.major.y = element_line(color = INK, linewidth = 0.25),
    axis.title        = element_text(color = INK, size = 10),
    axis.text         = element_text(color = INK_SOFT, size = 8),
    plot.title        = element_text(color = INK, size = 12),
    legend.position          = "inside",
    legend.position.inside   = c(0.86, 0.88),
    legend.background = element_blank(),
    legend.text       = element_text(color = INK_SOFT, size = 8),
    legend.key        = element_blank()
  )

# --- Save -------------------------------------------------------------------
ggsave(
  filename = sprintf("plot-%s.png", THEME),
  plot     = p,
  device   = ragg::agg_png,
  width    = 8,
  height   = 4.5,
  units    = "in",
  dpi      = 400
)
Runnable source as JSON, for any HTTP client: https://api.anyplot.ai/specs/histogram-density/ggplot2/code. Any spec id and library id listed in llms-full.txt fit the same URL shape; every URL below is complete and callable.
{
  "spec_id": "histogram-density",
  "language": "r",
  "library": "ggplot2",
  "page": "https://anyplot.ai/histogram-density/r/ggplot2",
  "hub": "https://anyplot.ai/histogram-density",
  "code_json": "https://api.anyplot.ai/specs/histogram-density/ggplot2/code",
  "spec_json": "https://api.anyplot.ai/specs/histogram-density",
  "render_light_png": "https://storage.googleapis.com/anyplot-images/plots/histogram-density/r/ggplot2/plot-light.png",
  "render_dark_png": "https://storage.googleapis.com/anyplot-images/plots/histogram-density/r/ggplot2/plot-dark.png",
  "quality_score": 90.0,
  "license": "MIT",
  "guide": "https://anyplot.ai/llms.txt"
}
Part of Density Histogram on anyplot.ai.