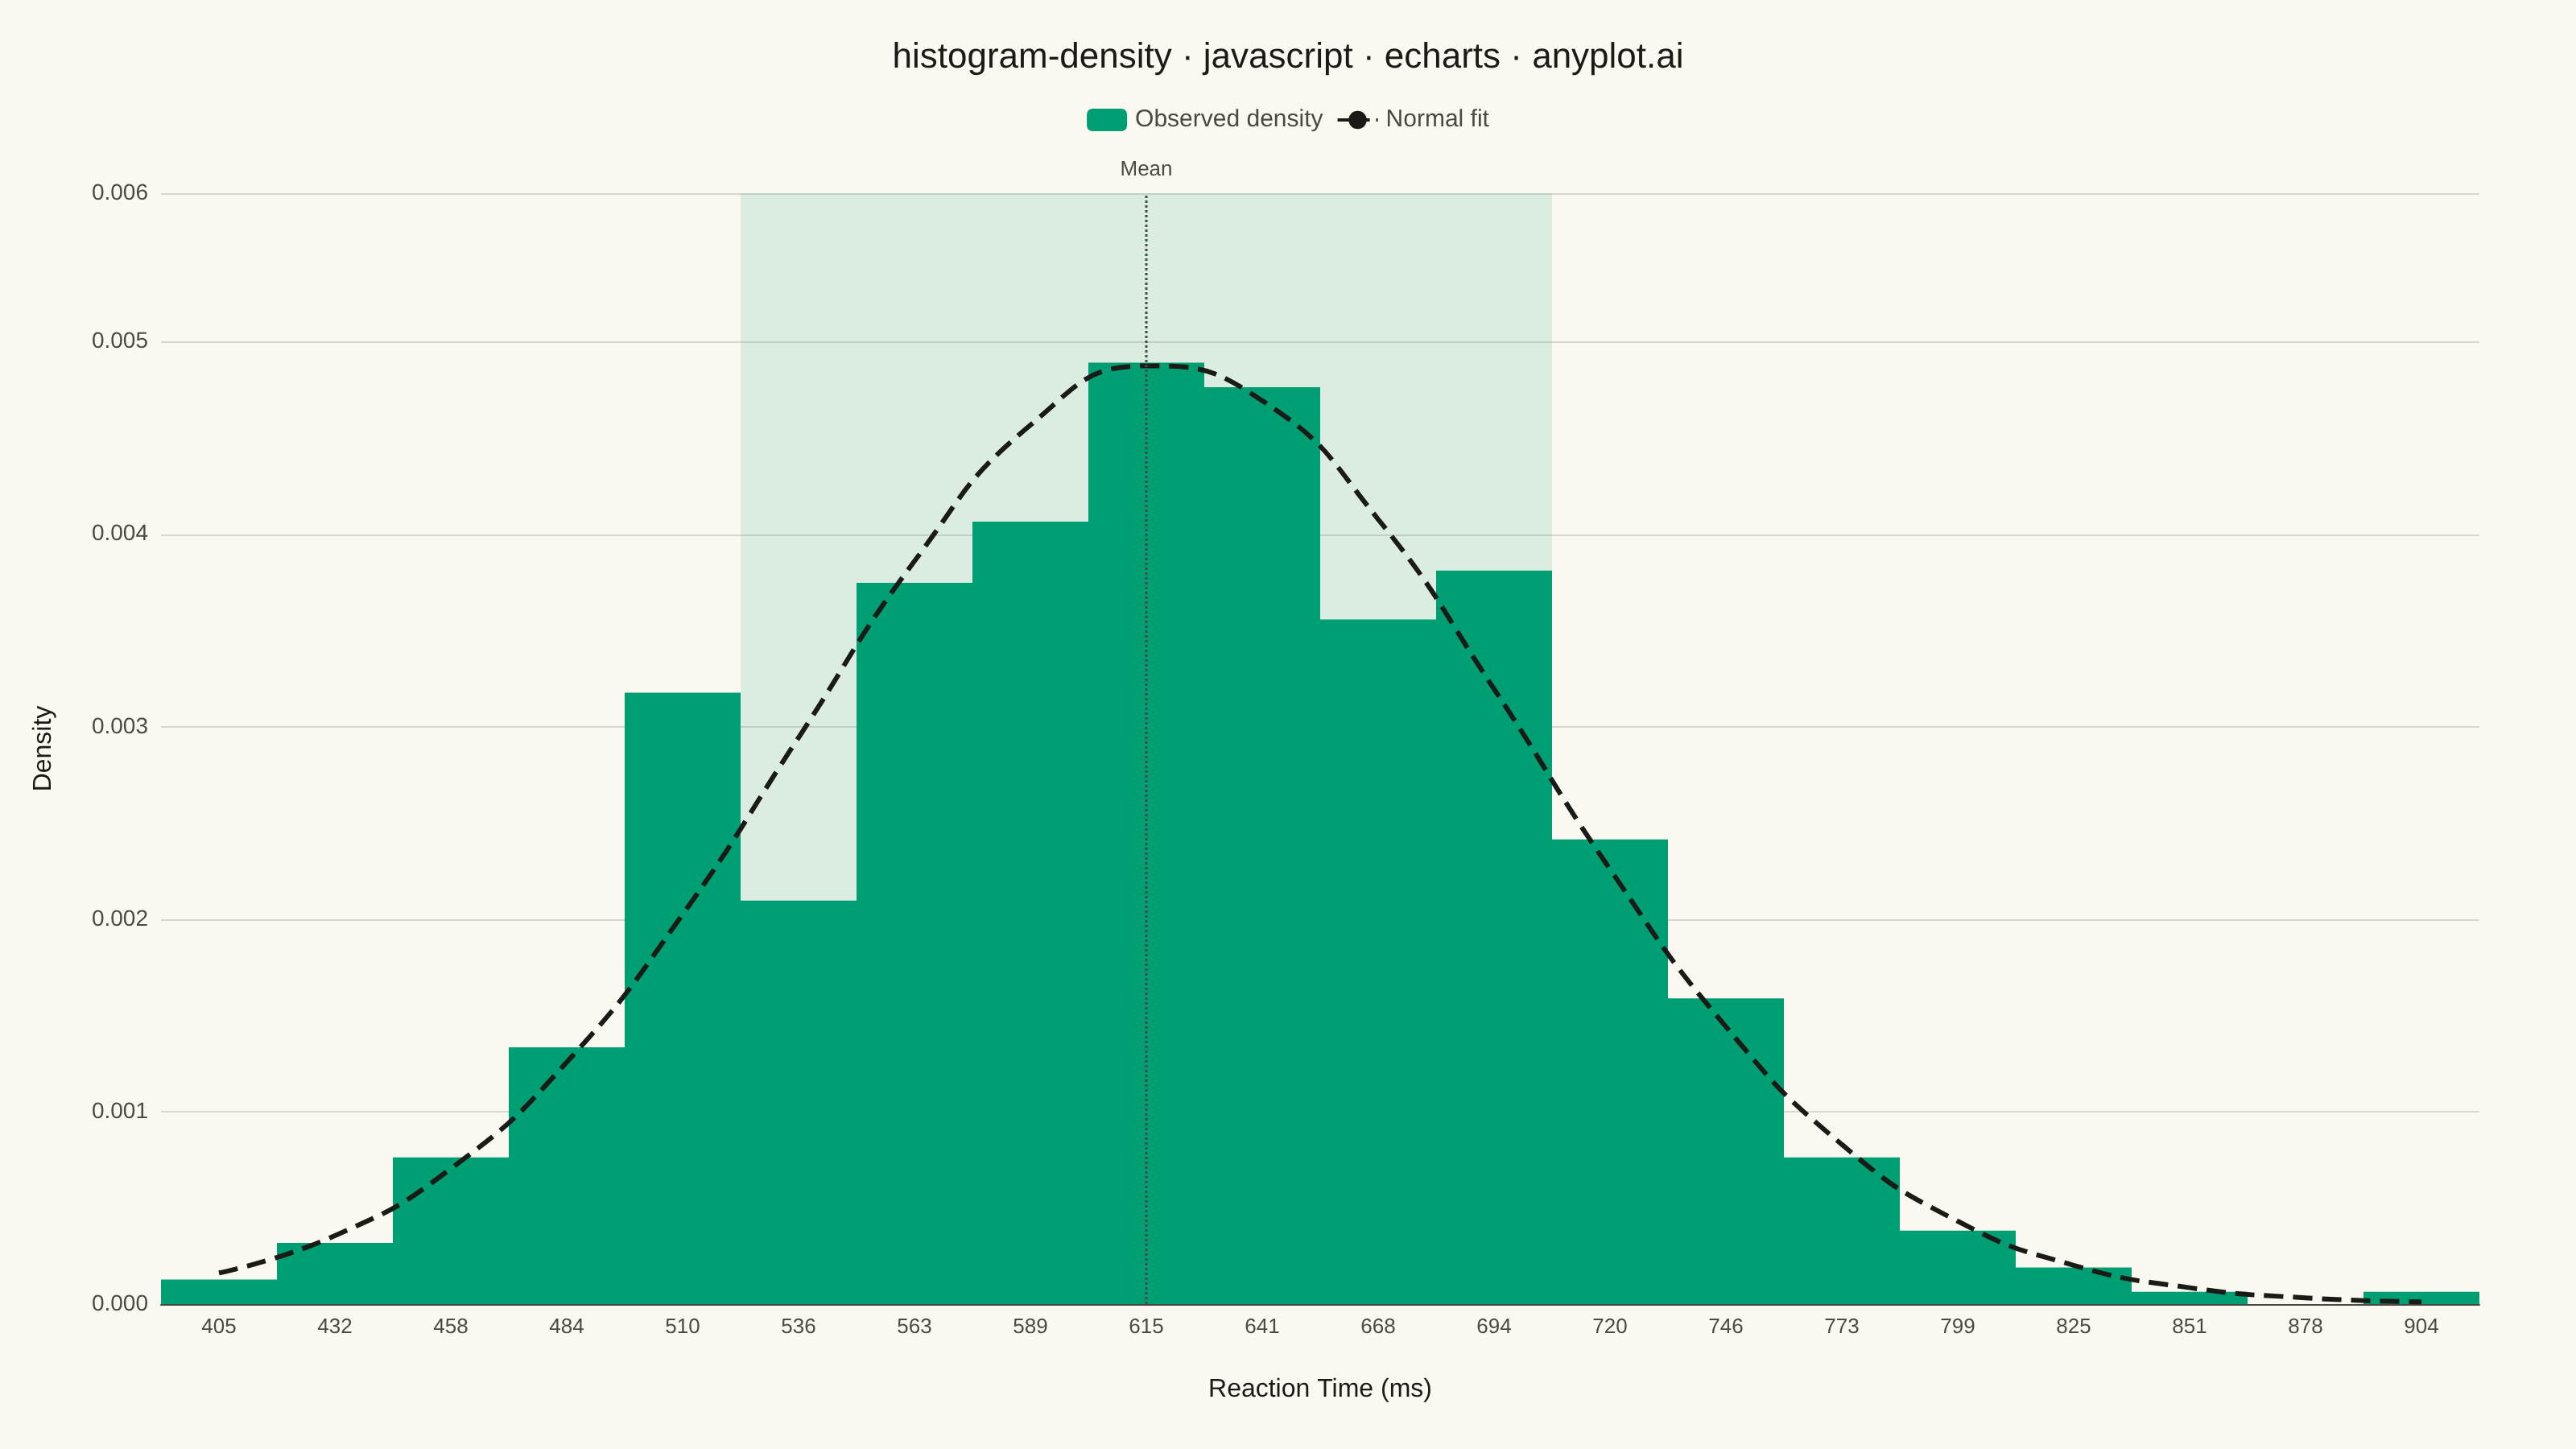
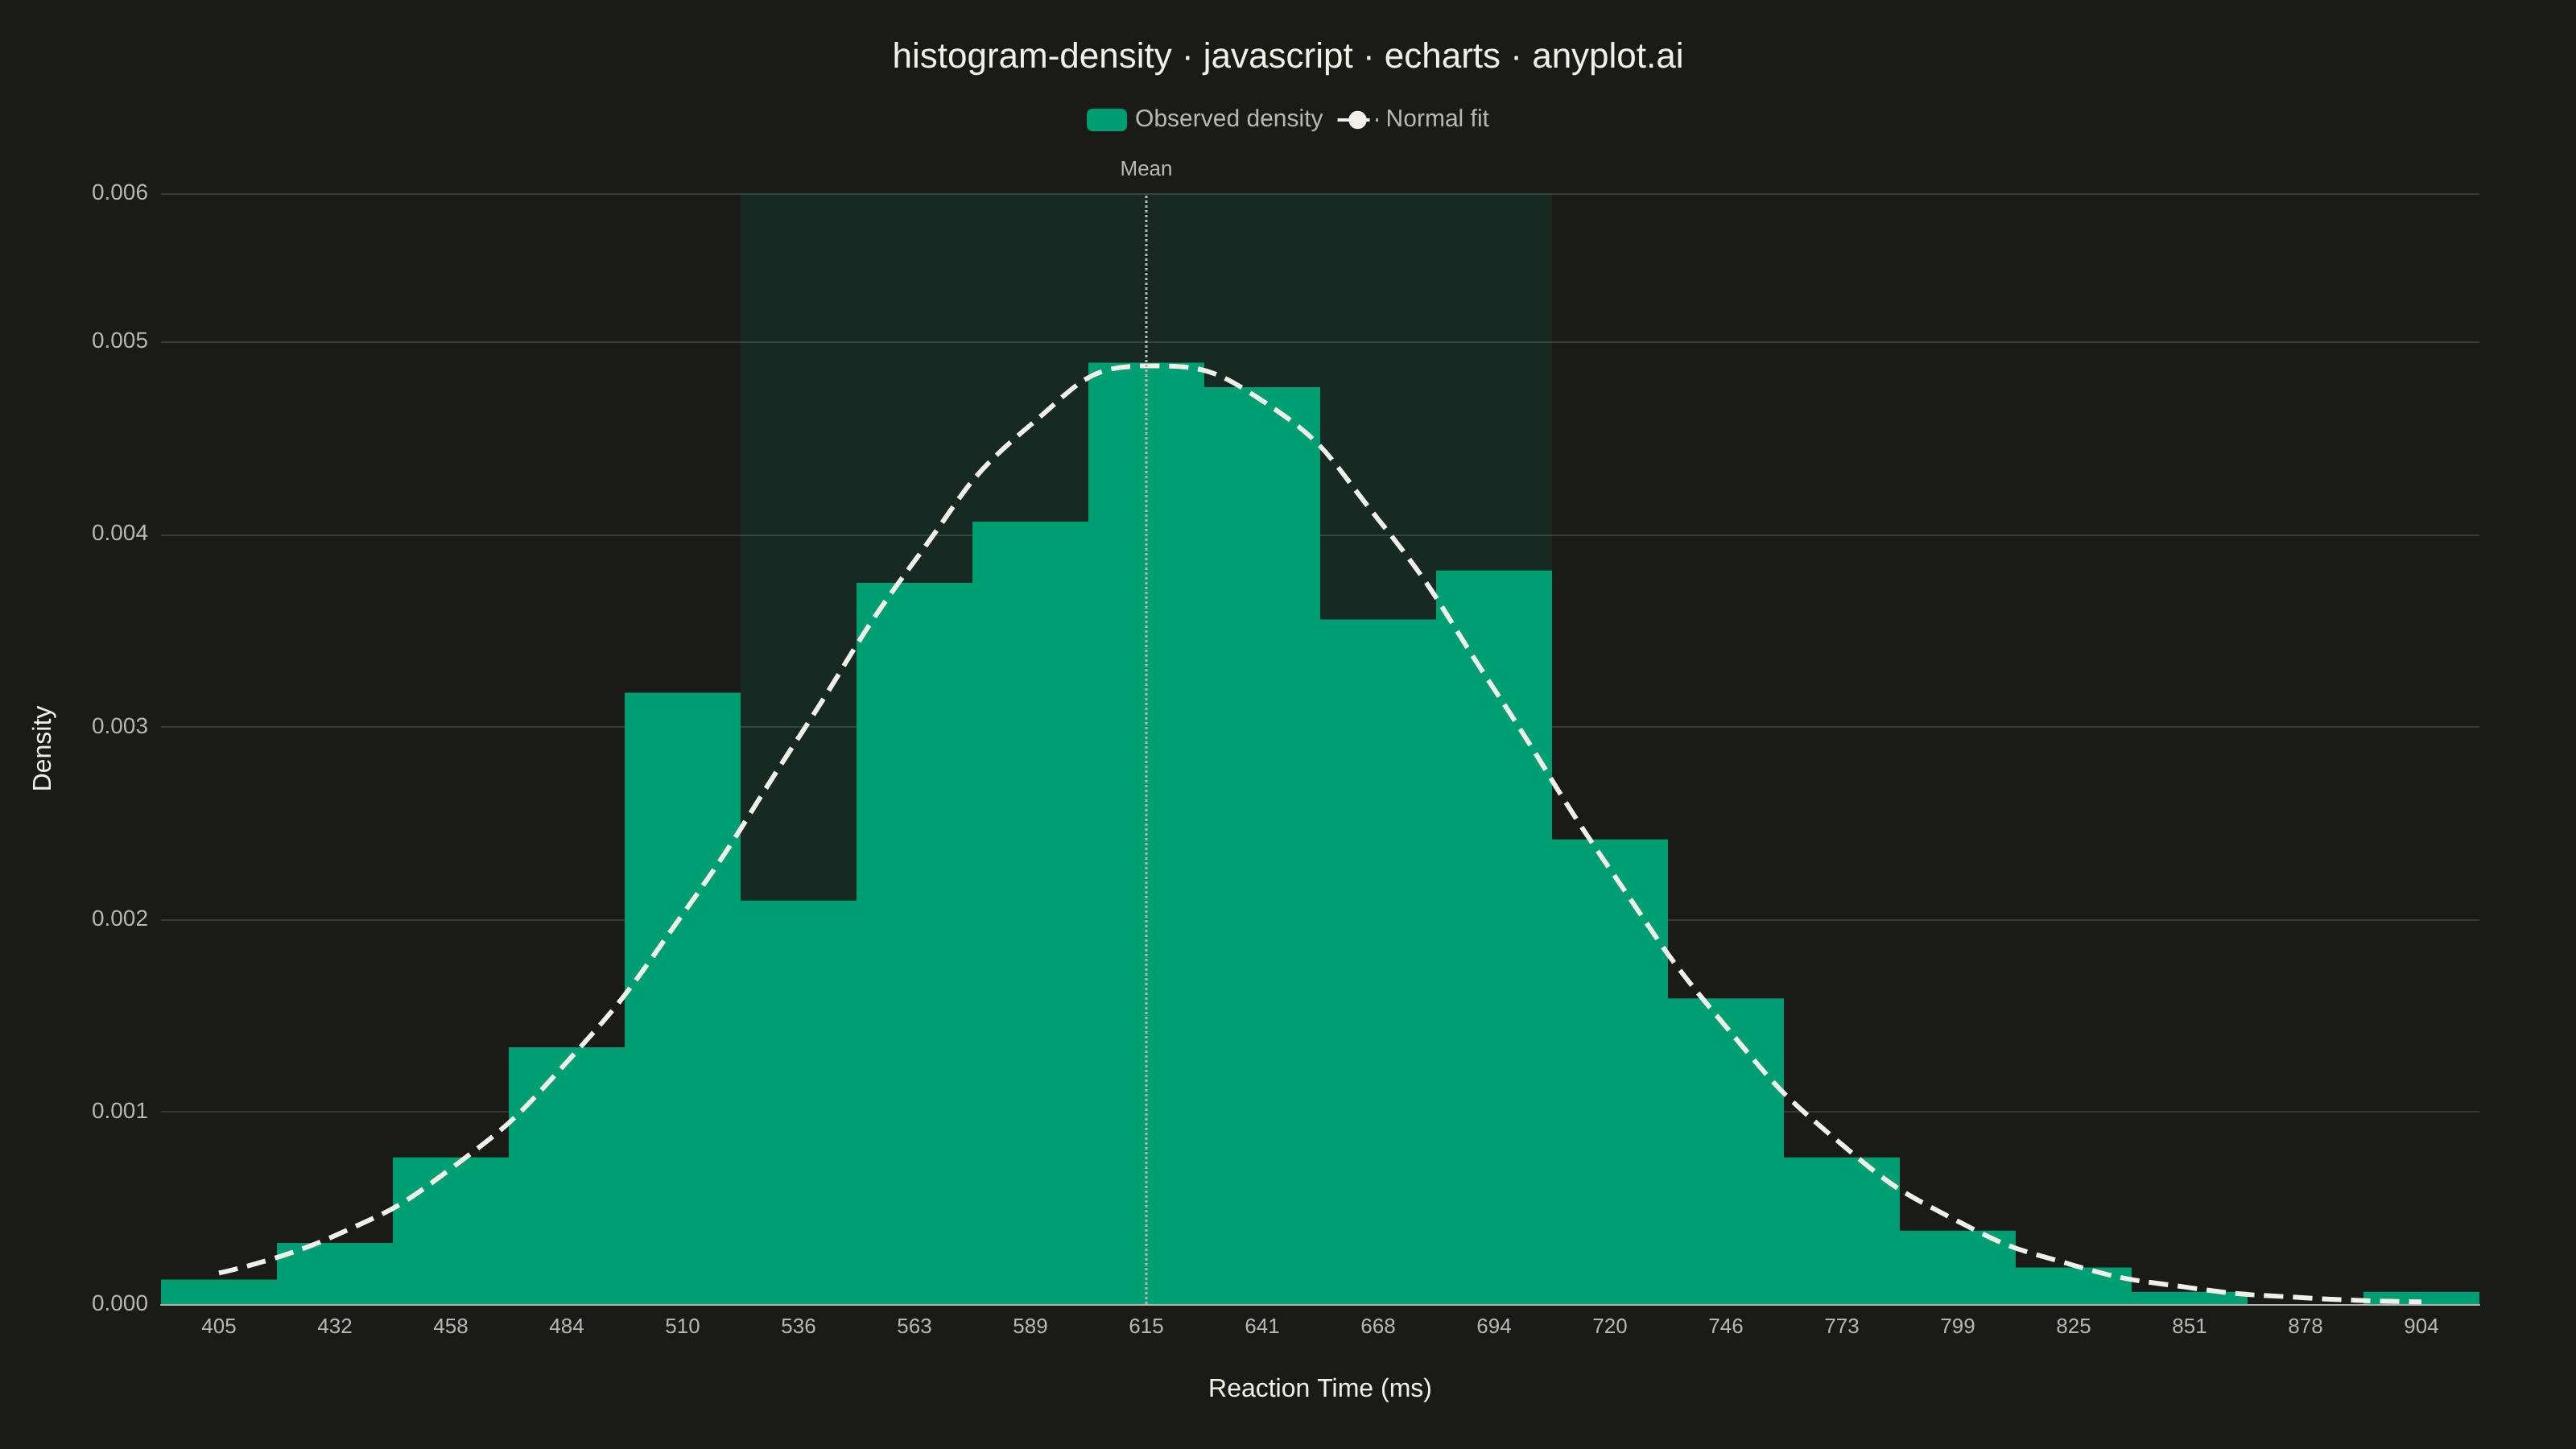
The same plot in 14 other libraries — JavaScript: Chart.js, D3.js, Highcharts, MUI X Charts; Python: Altair, Bokeh, lets-plot, Matplotlib, Plotly, plotnine, Pygal, Seaborn; R: ggplot2; Julia: Makie.jl. Compare all 15 side by side: Density Histogram in Python, R, Julia and JavaScript.
A density histogram displays the distribution of a continuous variable normalized so that the total area under the histogram equals 1, representing probability density instead of raw counts. This normalization allows direct comparison between distributions with different sample sizes and enables overlaying theoretical probability density functions (PDFs) for statistical analysis.
// anyplot.ai
// histogram-density: Density Histogram
// Library: echarts 6.1.0 | JavaScript 22.23.2
// Quality: 92/100 | Created: 2026-09-05

//# anyplot-orientation: landscape
const t = window.ANYPLOT_TOKENS;

// --- Data (in-memory, deterministic) ---------------------------------------
// Reaction times (ms) from a simulated cognitive-task experiment, n=600.
function lcg(seed) {
  let state = seed;
  return () => {
    state = (state * 1664525 + 1013904223) % 4294967296;
    return state / 4294967296;
  };
}
const rand = lcg(42);

function randomNormal() {
  const u1 = Math.max(rand(), 1e-12);
  const u2 = rand();
  return Math.sqrt(-2 * Math.log(u1)) * Math.cos(2 * Math.PI * u2);
}

const sampleCount = 600;
const trueMean = 620;
const trueStd = 85;
const reactionTimes = Array.from(
  { length: sampleCount },
  () => trueMean + trueStd * randomNormal(),
);

// Sample statistics feed the theoretical PDF overlay (goodness-of-fit check).
const sampleMean = reactionTimes.reduce((a, b) => a + b, 0) / sampleCount;
const variance =
  reactionTimes.reduce((a, b) => a + (b - sampleMean) ** 2, 0) / sampleCount;
const sampleStd = Math.sqrt(variance);

// --- Binning: normalize so total bar area == 1 (density, not raw count) ----
const binCount = 20;
const minValue = Math.min(...reactionTimes);
const maxValue = Math.max(...reactionTimes);
const binWidth = (maxValue - minValue) / binCount;
const counts = new Array(binCount).fill(0);
reactionTimes.forEach((value) => {
  const idx = Math.min(binCount - 1, Math.floor((value - minValue) / binWidth));
  counts[idx] += 1;
});

const binCenters = counts.map((_, i) => minValue + (i + 0.5) * binWidth);
const binLabels = binCenters.map((c) => Math.round(c).toString());
const densities = counts.map((count) => count / (sampleCount * binWidth));

// Theoretical normal PDF fit to the sample, evaluated at the same bin centers.
const normalPdf = binCenters.map((x) => {
  const z = (x - sampleMean) / sampleStd;
  return Math.exp(-0.5 * z * z) / (sampleStd * Math.sqrt(2 * Math.PI));
});

// Nearest-bin lookups drive the mean/±1σ annotations below.
const nearestBinIndex = (target) =>
  binCenters.reduce(
    (best, c, i) =>
      Math.abs(c - target) < Math.abs(binCenters[best] - target) ? i : best,
    0,
  );
const meanBinLabel = binLabels[nearestBinIndex(sampleMean)];
const lowStdBinLabel = binLabels[nearestBinIndex(sampleMean - sampleStd)];
const highStdBinLabel = binLabels[nearestBinIndex(sampleMean + sampleStd)];

// --- Init -------------------------------------------------------------------
const chart = echarts.init(document.getElementById("container"));

// --- Option -----------------------------------------------------------------
chart.setOption({
  animation: false,
  color: t.palette,
  backgroundColor: "transparent",
  title: {
    text: "histogram-density · javascript · echarts · anyplot.ai",
    left: "center",
    top: 20,
    textStyle: { color: t.ink, fontSize: 22, fontWeight: 500 },
  },
  legend: {
    data: ["Observed density", "Normal fit"],
    top: 62,
    textStyle: { color: t.inkSoft, fontSize: 15 },
  },
  grid: { left: 100, right: 60, top: 120, bottom: 90 },
  xAxis: {
    type: "category",
    data: binLabels,
    name: "Reaction Time (ms)",
    nameLocation: "center",
    nameGap: 45,
    nameTextStyle: { color: t.ink, fontSize: 16 },
    axisLabel: { color: t.inkSoft, fontSize: 13 },
    axisLine: { lineStyle: { color: t.inkSoft } },
    axisTick: { show: false },
    splitLine: { show: false },
  },
  yAxis: {
    type: "value",
    name: "Density",
    nameLocation: "center",
    nameGap: 65,
    nameTextStyle: { color: t.ink, fontSize: 16 },
    axisLabel: {
      color: t.inkSoft,
      fontSize: 14,
      formatter: (value) => value.toFixed(3),
    },
    axisLine: { show: false },
    splitLine: { lineStyle: { color: t.grid } },
    // Headroom above the tallest bar/curve keeps the "Mean" markLine label clear of the data.
    max: (value) => value.max * 1.18,
  },
  series: [
    {
      name: "Observed density",
      type: "bar",
      data: densities,
      barCategoryGap: "0%",
      itemStyle: { color: t.palette[0] },
      z: 2,
      markArea: {
        silent: true,
        itemStyle: { color: t.palette[0], opacity: 0.12 },
        label: { show: false },
        data: [[{ xAxis: lowStdBinLabel }, { xAxis: highStdBinLabel }]],
      },
      markLine: {
        silent: true,
        symbol: "none",
        lineStyle: { color: t.inkSoft, type: "dotted", width: 1.5 },
        label: {
          formatter: "Mean",
          color: t.inkSoft,
          fontSize: 13,
          rotate: 0,
          position: "end",
          distance: 8,
        },
        data: [{ xAxis: meanBinLabel }],
      },
    },
    {
      name: "Normal fit",
      type: "line",
      data: normalPdf,
      smooth: true,
      symbol: "none",
      itemStyle: { color: t.ink },
      lineStyle: { color: t.ink, width: 3, type: "dashed" },
      z: 3,
    },
  ],
});
Runnable source as JSON, for any HTTP client: https://api.anyplot.ai/specs/histogram-density/echarts/code. Any spec id and library id listed in llms-full.txt fit the same URL shape; every URL below is complete and callable.
{
  "spec_id": "histogram-density",
  "language": "javascript",
  "library": "echarts",
  "page": "https://anyplot.ai/histogram-density/javascript/echarts",
  "hub": "https://anyplot.ai/histogram-density",
  "code_json": "https://api.anyplot.ai/specs/histogram-density/echarts/code",
  "spec_json": "https://api.anyplot.ai/specs/histogram-density",
  "render_light_png": "https://storage.googleapis.com/anyplot-images/plots/histogram-density/javascript/echarts/plot-light.png",
  "render_dark_png": "https://storage.googleapis.com/anyplot-images/plots/histogram-density/javascript/echarts/plot-dark.png",
  "interactive_light_html": "https://storage.googleapis.com/anyplot-images/plots/histogram-density/javascript/echarts/plot-light.html",
  "interactive_dark_html": "https://storage.googleapis.com/anyplot-images/plots/histogram-density/javascript/echarts/plot-dark.html",
  "quality_score": 92.0,
  "license": "MIT",
  "guide": "https://anyplot.ai/llms.txt"
}
Part of Density Histogram on anyplot.ai.