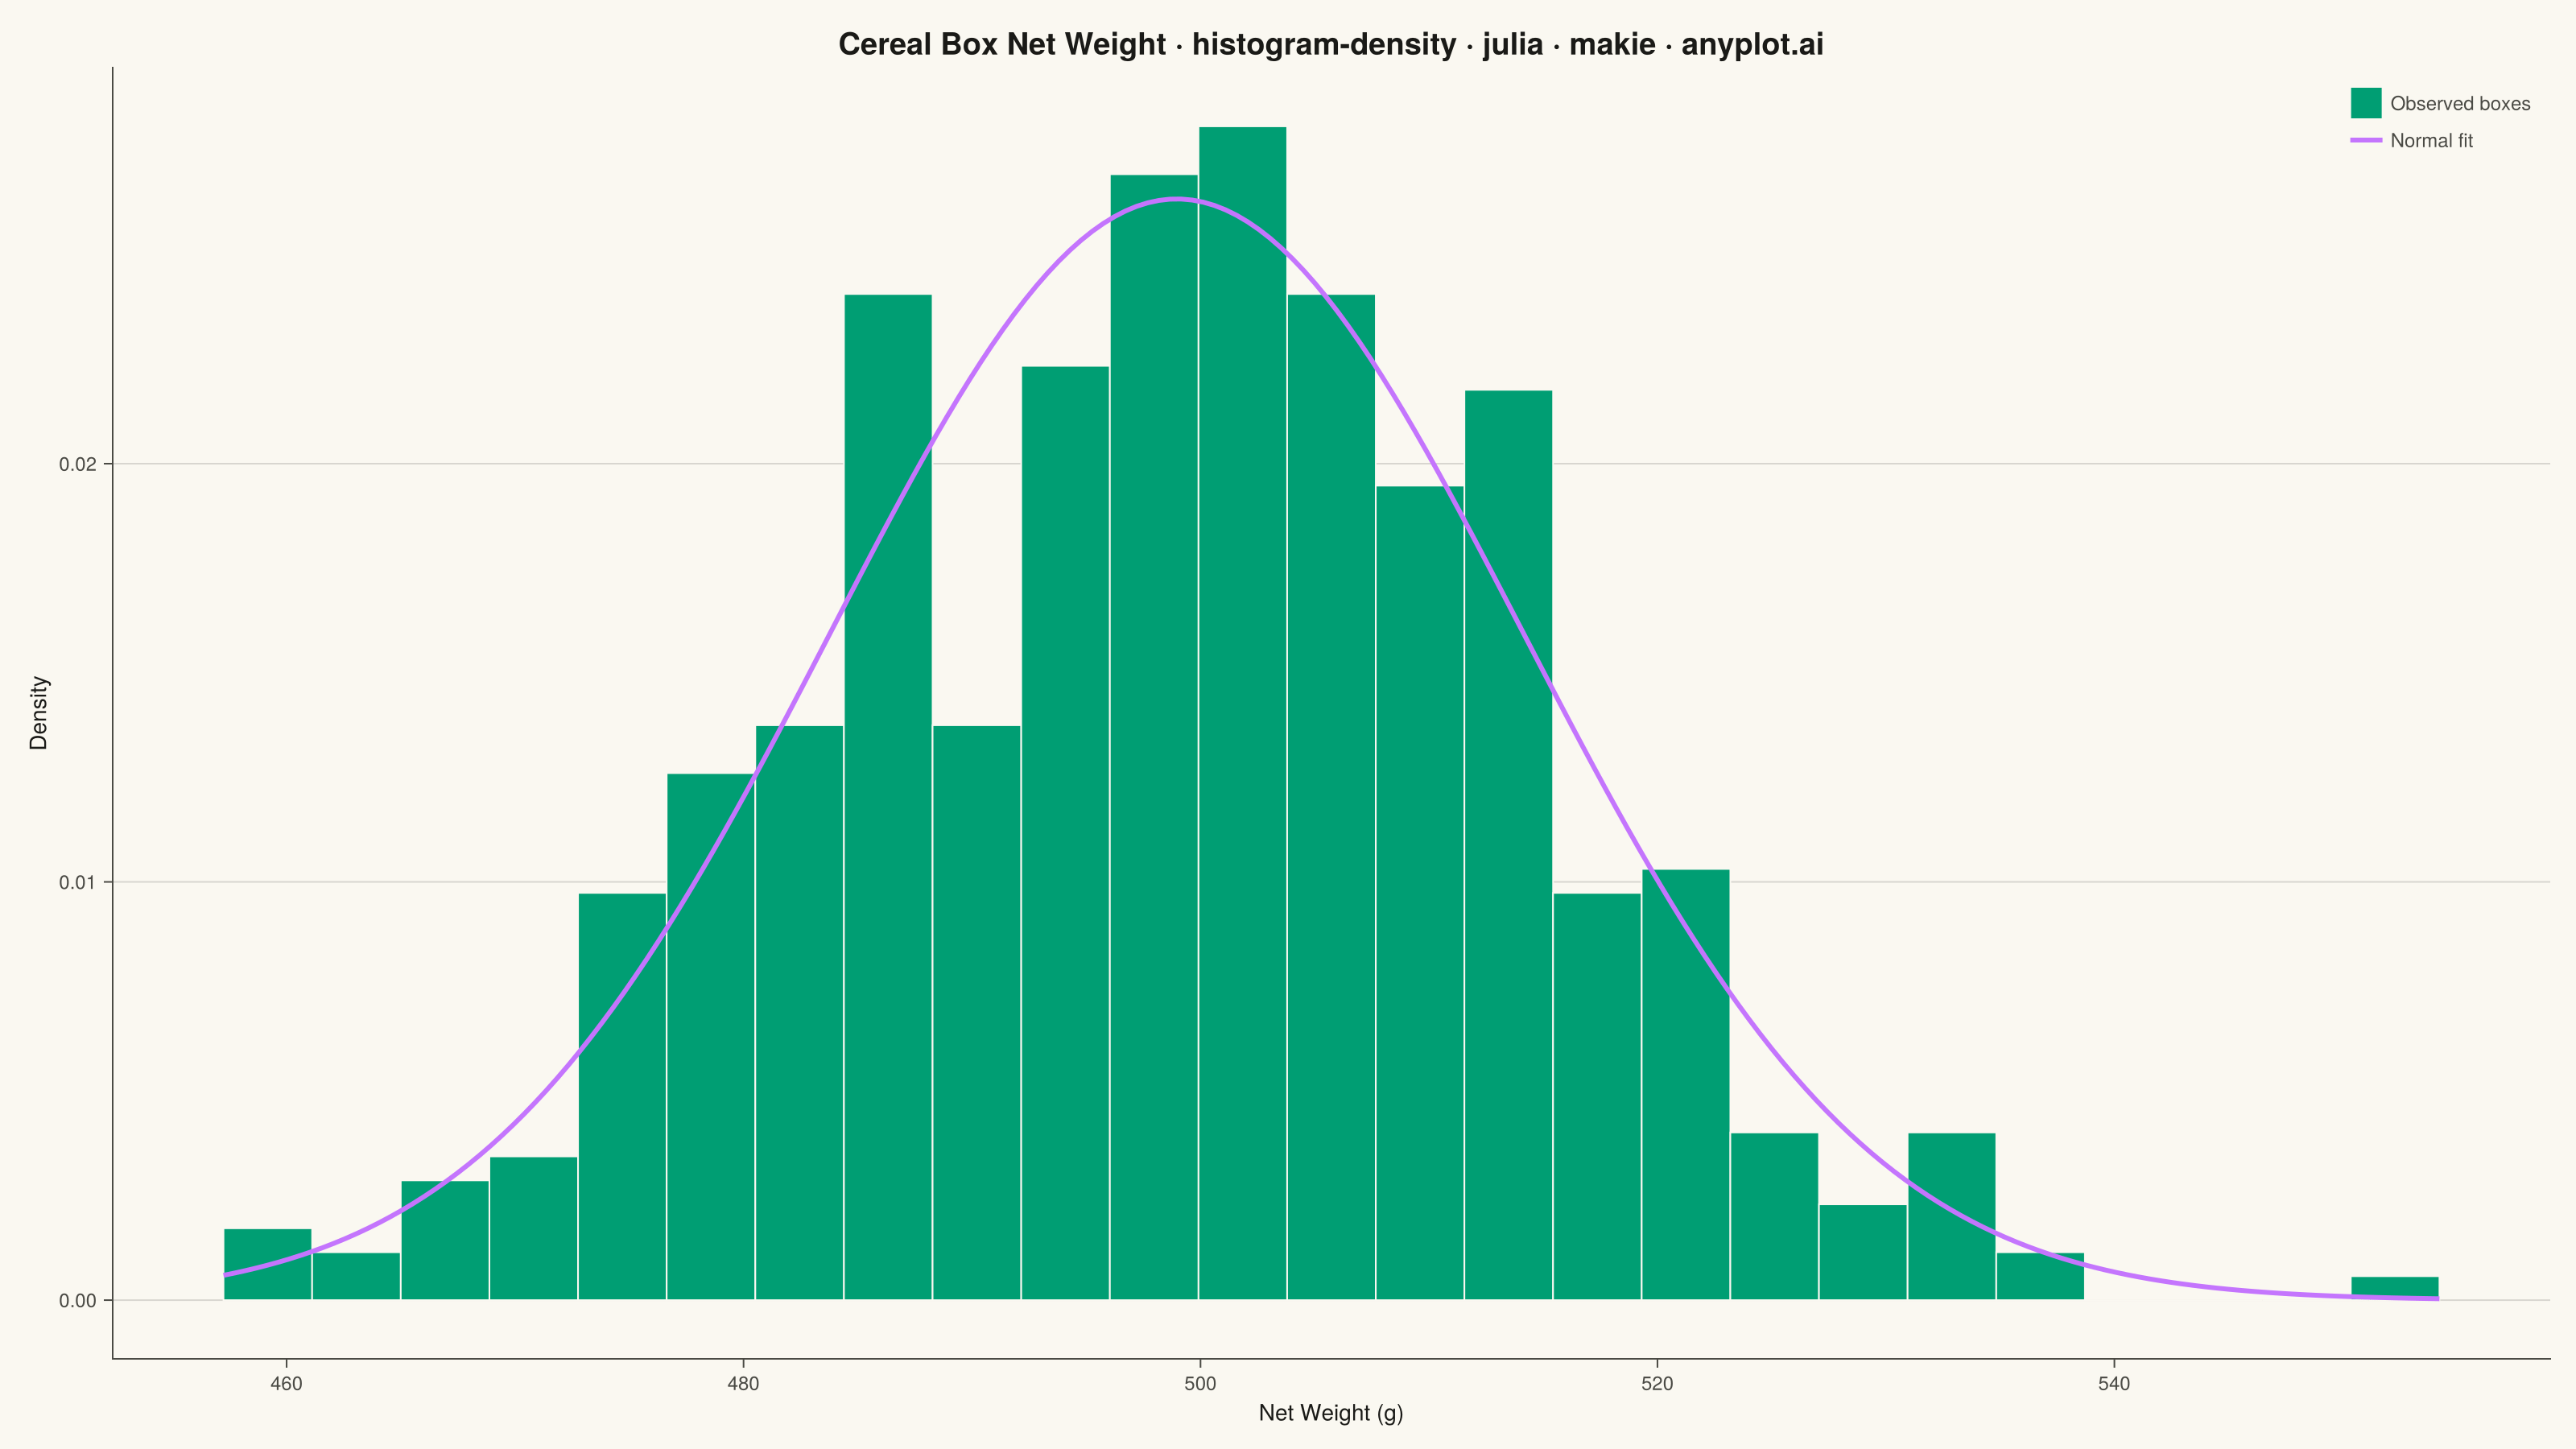
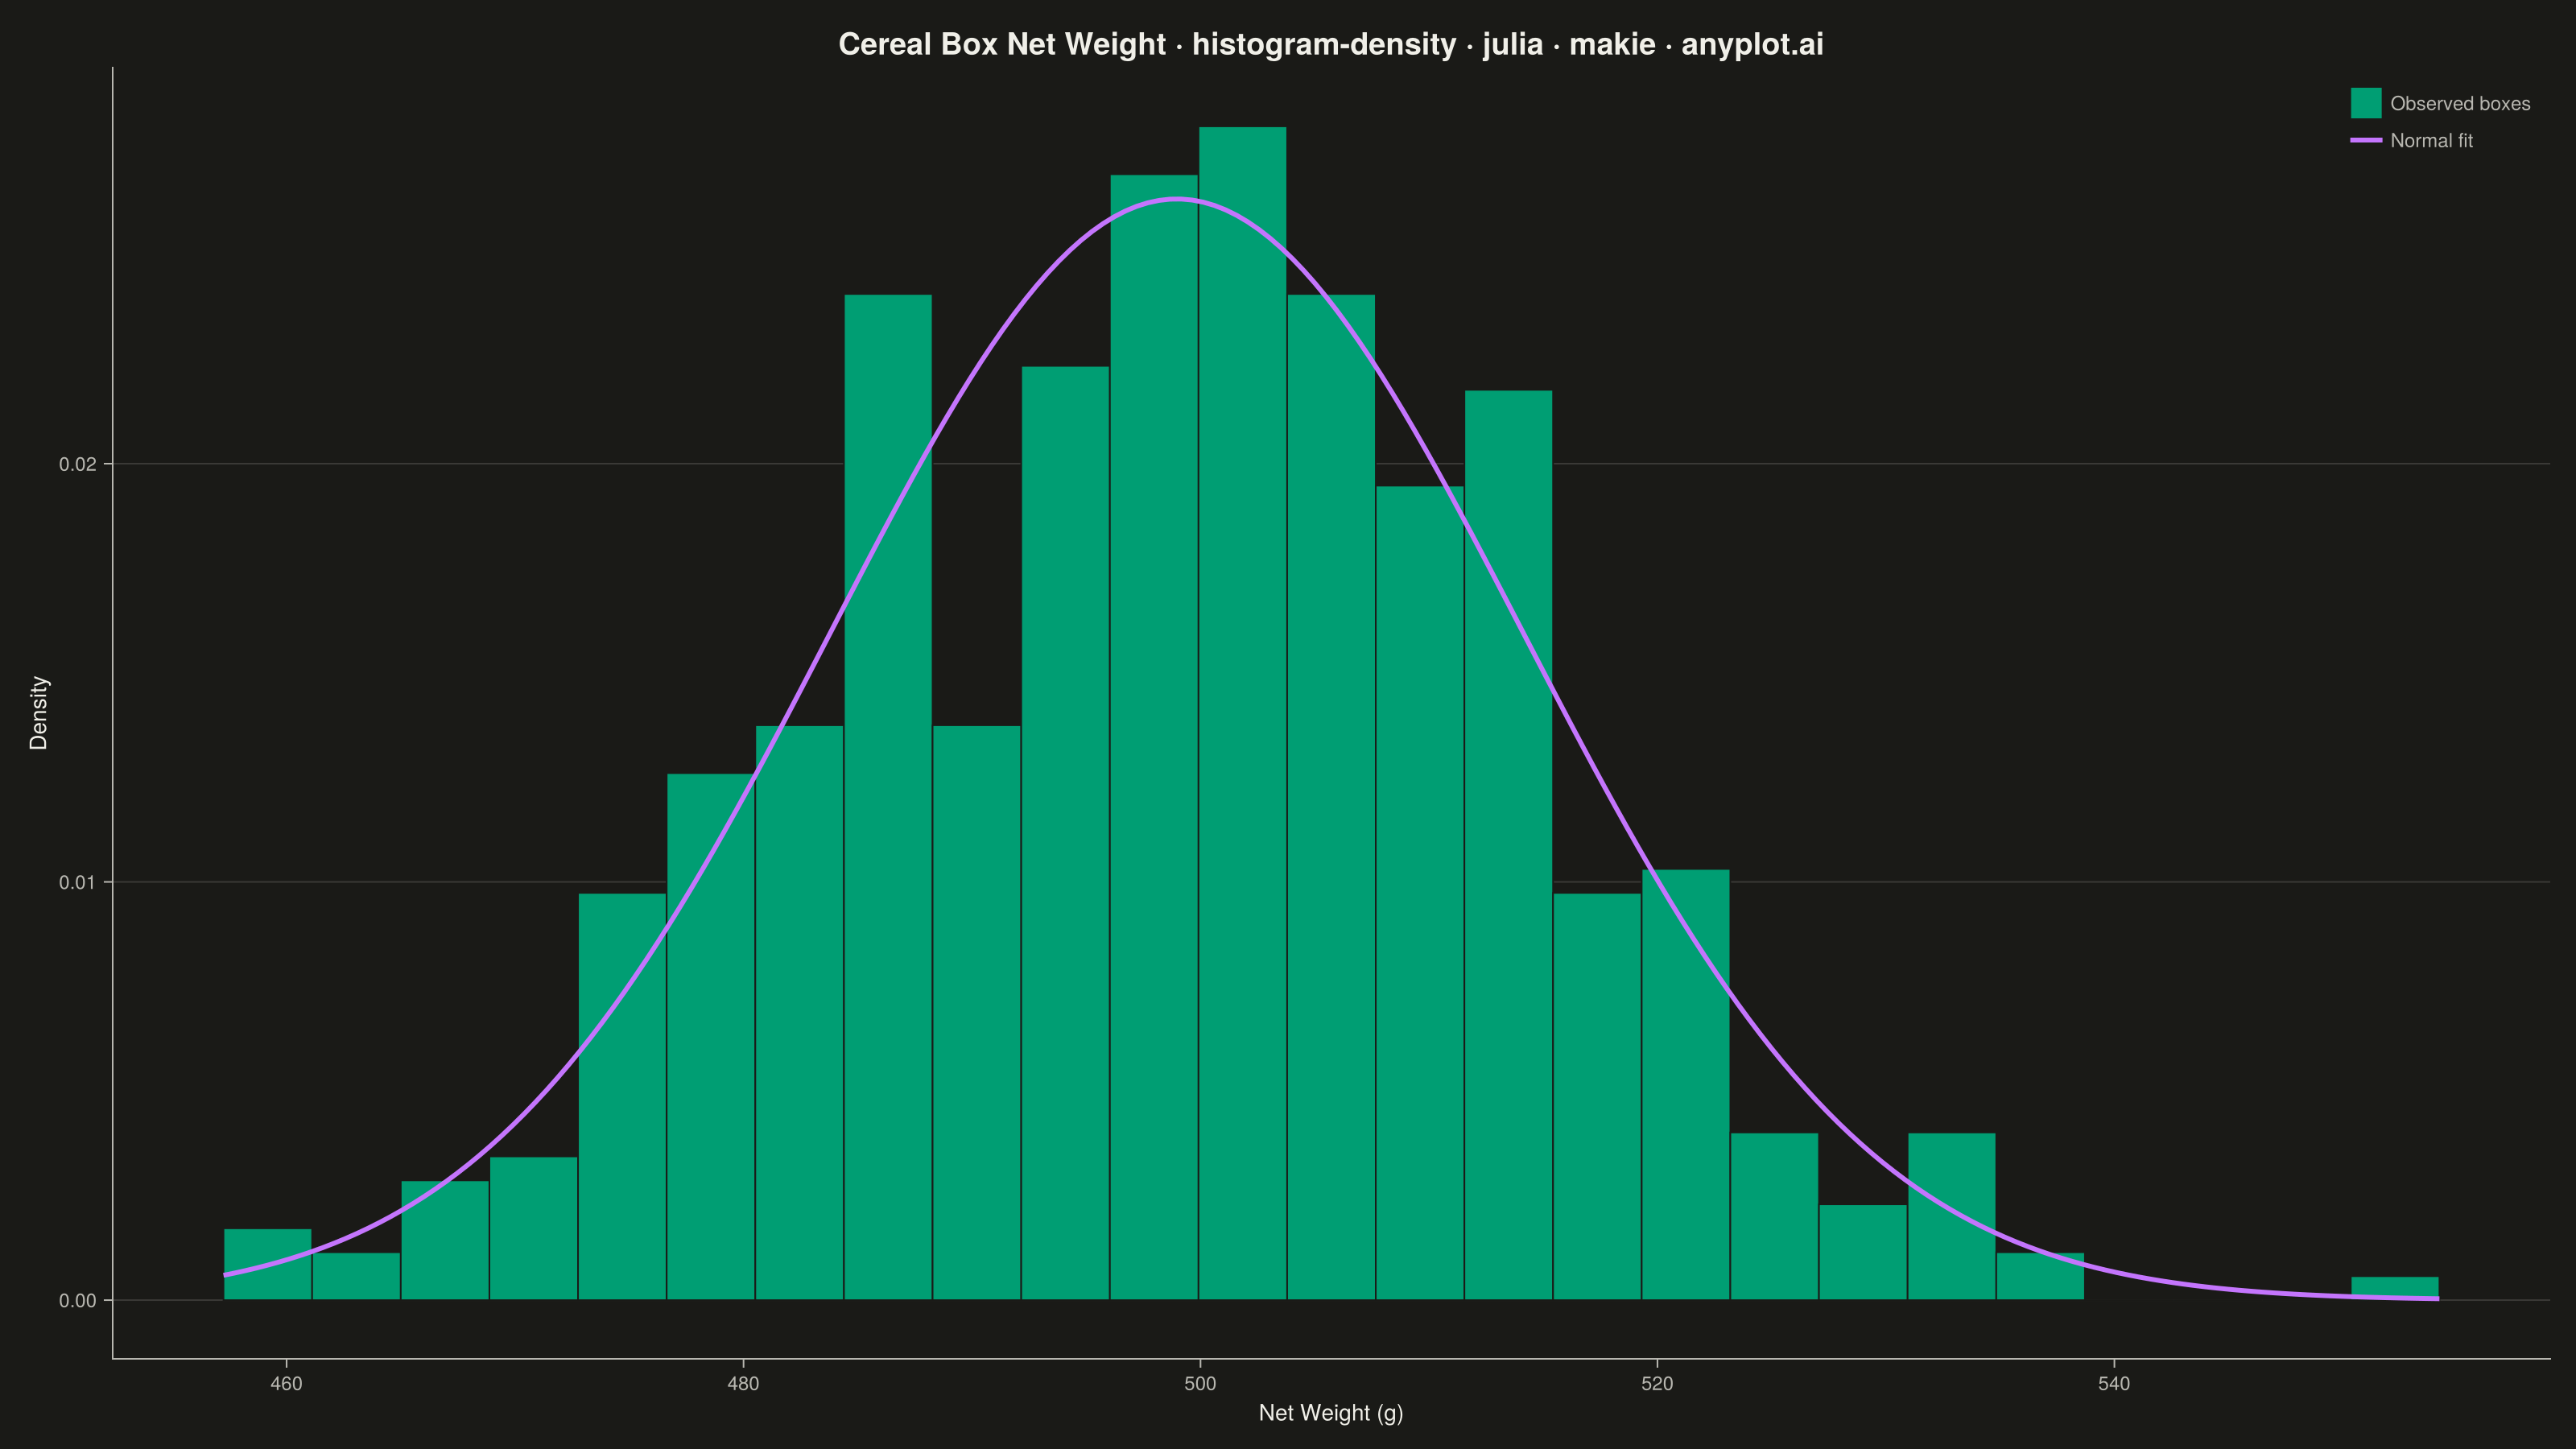
The same plot in 14 other libraries — Python: Altair, Bokeh, lets-plot, Matplotlib, Plotly, plotnine, Pygal, Seaborn; R: ggplot2; JavaScript: Chart.js, D3.js, Apache ECharts, Highcharts, MUI X Charts. Compare all 15 side by side: Density Histogram in Python, R, Julia and JavaScript.
A density histogram displays the distribution of a continuous variable normalized so that the total area under the histogram equals 1, representing probability density instead of raw counts. This normalization allows direct comparison between distributions with different sample sizes and enables overlaying theoretical probability density functions (PDFs) for statistical analysis.
# anyplot.ai
# histogram-density: Density Histogram
# Library: makie 0.21.9 | Julia 1.11.9
# Quality: 70/100 | Created: 2026-09-05

using CairoMakie
using Colors
using Random
using Statistics

Random.seed!(42)

# --- Theme tokens -----------------------------------------------------------
const THEME    = get(ENV, "ANYPLOT_THEME", "light")
const PAGE_BG  = THEME == "light" ? colorant"#FAF8F1" : colorant"#1A1A17"
const INK      = THEME == "light" ? colorant"#1A1A17" : colorant"#F0EFE8"
const INK_SOFT = THEME == "light" ? colorant"#4A4A44" : colorant"#B8B7B0"
const IMPRINT_PALETTE = [
    colorant"#009E73", colorant"#C475FD", colorant"#4467A3", colorant"#BD8233",
    colorant"#AE3030", colorant"#2ABCCD", colorant"#954477", colorant"#99B314",
]

# --- Data ---------------------------------------------------------------
# Net weight (grams) of cereal boxes off a filling line, nominal fill 500 g.
box_weights = 500 .+ 15 .* randn(450)
nominal_fill = 500.0
n_bins = 20

mu = mean(box_weights)
sigma = std(box_weights)
x_fit = range(minimum(box_weights), maximum(box_weights); length = 200)
pdf_fit = @. 1 / (sigma * sqrt(2π)) * exp(-0.5 * ((x_fit - mu) / sigma)^2)

# Locate the isolated out-of-spec box (heaviest bin) for a callout annotation.
bin_edges = range(minimum(box_weights), maximum(box_weights); length = n_bins + 1)
bin_width = step(bin_edges)
outlier_lo = bin_edges[end-1]
outlier_mid = (bin_edges[end-1] + bin_edges[end]) / 2
outlier_density = count(>=(outlier_lo), box_weights) / (length(box_weights) * bin_width)
outlier_label_y = outlier_density + 0.0045

# --- Plot -----------------------------------------------------------------
title_text = "Cereal Box Net Weight · histogram-density · julia · makie · anyplot.ai"

fig = Figure(
    resolution      = (1600, 900),
    fontsize        = 14,
    backgroundcolor = PAGE_BG,
)

ax = Axis(
    fig[1, 1];
    title             = title_text,
    titlesize         = 19,
    titlecolor        = INK,
    xlabel            = "Net Weight (g)",
    ylabel            = "Density",
    xlabelsize        = 14,
    ylabelsize        = 14,
    xlabelcolor       = INK,
    ylabelcolor       = INK,
    xticklabelsize    = 12,
    yticklabelsize    = 12,
    xticklabelcolor   = INK_SOFT,
    yticklabelcolor   = INK_SOFT,
    xtickcolor        = INK_SOFT,
    ytickcolor        = INK_SOFT,
    backgroundcolor   = PAGE_BG,
    topspinevisible   = false,
    rightspinevisible = false,
    leftspinecolor    = INK_SOFT,
    bottomspinecolor  = INK_SOFT,
    xgridvisible      = false,
    ygridcolor        = RGBAf(INK.r, INK.g, INK.b, 0.15),
)

hist!(
    ax, box_weights;
    normalization = :pdf,
    bins          = n_bins,
    color         = IMPRINT_PALETTE[1],
    strokewidth   = 1,
    strokecolor   = PAGE_BG,
    label         = "Observed boxes",
)

band!(ax, x_fit, zeros(length(x_fit)), pdf_fit; color = (IMPRINT_PALETTE[2], 0.18))
lines!(ax, x_fit, pdf_fit; color = IMPRINT_PALETTE[2], linewidth = 3, label = "Normal fit")

density!(
    ax, box_weights;
    npoints     = 200,
    color       = :transparent,
    strokecolor = IMPRINT_PALETTE[3],
    strokewidth = 4,
    linestyle   = :dash,
    label       = "Smoothed density (KDE)",
)

vlines!(ax, [nominal_fill]; color = INK, linestyle = :dash, linewidth = 2.5, label = "Nominal fill (500 g)")

lines!(
    ax, [outlier_mid, outlier_mid], [outlier_density, outlier_label_y];
    color = INK, linewidth = 1.5, linestyle = :dot,
)
text!(
    ax, outlier_mid, outlier_label_y;
    text = "Out-of-spec box", align = (:center, :bottom), color = INK, fontsize = 13, font = :bold,
)

axislegend(
    ax;
    position      = :rt,
    framevisible  = false,
    labelcolor    = INK_SOFT,
    labelsize     = 12,
    backgroundcolor = :transparent,
)

# --- Save -------------------------------------------------------------------
save("plot-$(THEME).png", fig; px_per_unit = 2)
Runnable source as JSON, for any HTTP client: https://api.anyplot.ai/specs/histogram-density/makie/code. Any spec id and library id listed in llms-full.txt fit the same URL shape; every URL below is complete and callable.
{
  "spec_id": "histogram-density",
  "language": "julia",
  "library": "makie",
  "page": "https://anyplot.ai/histogram-density/julia/makie",
  "hub": "https://anyplot.ai/histogram-density",
  "code_json": "https://api.anyplot.ai/specs/histogram-density/makie/code",
  "spec_json": "https://api.anyplot.ai/specs/histogram-density",
  "render_light_png": "https://storage.googleapis.com/anyplot-images/plots/histogram-density/julia/makie/plot-light.png",
  "render_dark_png": "https://storage.googleapis.com/anyplot-images/plots/histogram-density/julia/makie/plot-dark.png",
  "quality_score": 70.0,
  "license": "MIT",
  "guide": "https://anyplot.ai/llms.txt"
}
Part of Density Histogram on anyplot.ai.